
Abstract
The graphene oxide nanosheets can act as a nanocarrier for the delivery of therapeutic agents. The PEGylated GO has high solubility, good stability, and more biocompatibility in physiological solutions. In this study, the anticancer effects of synthesized GO-PEG as a drug nanocarrier evaluated to estimate the synergistic cytotoxic effect of drugs loaded on this type of nanocarrier and to determine the actual effect of any drugs encapsulated on it. The cytotoxic effects of GO-PEG nanosheets were evaluated on HeLa cell line by MTT assay. The results exhibited cytotoxic property of PEGylated GO drug nanocarrier significantly is dose dependent and incubation time dependent.
Introduction
Recently, nanoscale drug delivery systems (NDDS), such as nanoparticles, nanospheres, nanoliposomes, nanocapsules, micelles, carbon nanotubes, and nanosheets, at the interface of nanotechnology and biomedical applications have drawn considerable attention, because they facilitate the good targeting, efficient loading, and controlled release of drugs (Liu et al. Citation2014, Xianbo et al. Citation2015, Zhu and Liao Citation2015).
The graphene oxide (GO) nanosheets are multilayer or single sheets that have a high density of hydroxyl and carboxyl groups (Gilje et al. Citation2007). The surface modification or functionalization of graphene and GO by covalent chemical bonding to other species is possible, due to the presence of oxygen groups as the reactive sites, such as hydroxyl, epoxy, and carboxyl in the graphene lattice (Kuila et al. Citation2012). Also, biocompatibility and biosolubility of GO platforms could be affected by their modification (Liu et al. Citation2013).
The GO is a water-soluble derivative of graphene that has a large planer surface area on both sides of a single sheet for efficient loading of drug molecules based on noncovalent dynamic bonding interactions, for example, hydrogen bonding, hydrophobic interactions, π–π stacking, and electrostatic forces. The GO nanocarriers respond to stimuli release by pH, temperature, UV-Vis lights, chemical reagent or electric fields (Rana et al. Citation2011).
In recent years, several groups investigated that graphene can act as a nanocarrier for loading and delivery of different therapeutic agents such as SN-38, doxorubicin, camptothecin, methotrexate, etc. which are commonly used anticancer drugs (Ni et al. Citation2013).
The nanoscale GO (NGO) was functionalized or PEGylated by polyethylene glycol (PEG) to cause high solubility beside good stability in both aqueous and physiological solutions, such as serum. Then, the GO-PEG nanosheets can act as a good soluble carrier for water-insoluble drugs (Liu et al. Citation2008). It is well known that the surface chemistry of nanomaterials is an important part of the drug carrier design with good biocompatibility and controlled behavior in biological systems.
The polyethylene glycol (PEG) is a hydrophilic biocompatible polymer extensively applied to functionalize various nanomaterials to improve their biocompatibility, reducing their nonspecific adsorption to biological molecules and cells and improvement of their in vivo pharmacokinetics for better tumor targeting (Anari et al. Citation2015, Veronese et al. Citation2005). Typically, most of PEG-drug conjugates have been designed for the delivery of antitumor agents, such as cisplatin and paclitaxel, that are expected to be stable in circulation to reaching the targeted cells or tissues (Banerjee et al. Citation2012).
In this study, a GO-PEG nanocarrier was synthesized and its cytotoxic effects on HeLa cancer cell line were investigated after different periods of incubations in various concentrations of GO-PEG nanosheets. Furthermore, the results of nanoGO-PEG cytotoxicity evaluations may help us to determine the actual effect of any drugs loaded on GO-PEG nanosheet or to help estimate the synergistic cytotoxic effect of drugs with this type of nanocarrier.
Experimental
Synthesis of GO
A reaction flask containing a magnetic stir bar was charged with nitric acid (9 mL) and sulfuric acid (18 mL) and then cooled in an ice bath. After 15 min, the graphite (1 g) was added to the acid mixture under vigorous stirring to avoid agglomeration. After dispersing graphite powder, potassium chlorate (11 g) was added slowly over 1 h to avoid temperature increasing. The reaction flask was loosely capped to allow evolution of gas from the reaction mixture and stirred for seven days at room temperature and then diluted with 500 mL of distilled water under stirring. On completion of the reaction, the mixture was poured into 100 mL of deionized water and filtered. The GO was redispersed and washed with a 5% solution of HCl to remove metal ions. The GO was then washed repeatedly with deionized water until removed the acid and the pH of the filtrate was neutral. The resulting graphene oxide was dried at 60 °C under vacuum (Poh et al. Citation2012, Shahriary and Athawale Citation2014).
Synthesis of GO-PEG nanocarrier
For increasing the solubility of the GO nanosheets in a physiological media such as blood, GO joined with hydrophilic functional moieties such as PEG.
A solution containing GO (0.1 g) in DMSO (25 mL) mixed with PEG 200 (0.9 mL) and heated at 60 °C for two days under nitrogen atmosphere. On completion of the reaction, a solution of dicyclohexylcarbodiamide (DCC) (0.185 g) in dimethyl sulfoxide (DMSO) (5 mL) was added to the mixture and the reaction continued for additional 24 h. The final product was a black GO-PEG precipitate that filtered, washed, and purified with DMSO to remove the unreacted compounds and then dried in a vacuum oven.
Preparation of drug solutions
The stock solution of PEGylated graphene oxide nanocarrier (GO-PEG) was prepared in dimethyl sulfoxide (DMSO, Sigma-Aldrich, St. Louis, MO) at a concentration of 1000 μg/mL. Then, sterilized by filtration trough Millipore filter, 0.22 μm, and diluted by cell culture medium to various working concentrations (0.1–100 μg/mL). Nutrient medium was high Glu DMEM (Gibco BRL, Scotland) supplemented with 10% fetal bovine serum (FBS-Gibco BRL, Scotland), 100 units/mL penicillin (Sigma, St. Louis, MO) and 100 μg/mL streptomycin (Sigma, St. Louis, MO).
The MTT (3–(4,5-dimethylthiazol-2-yl)-2,5 diphenyltetrazolium bromide), (Sigma Aldrich M2128) dissolved at a concentration of 5 mg/mL in sterile phosphate-buffered saline (PBS), pH = 7.2 and filtered through a 0.22-μm Millipore filter before use. The HeLa cells were split using the 0.25–0.5% TRED (trypsin/EDTA, Gibco BRL, Scotland) medium prior to reaching 80% confluence.
Human cell culture
The HeLa (Human cervix carcinoma) cells (NCBI C155) were obtained from National Cell Bank of Iran in Pasteur Institute. The HeLa cells were cultured as mono layers by High Glu DMEM medium supplemented with 10% heat inactivated fetal bovine serum (FBS-Gibco BRL, Scotland), 2 mM L-glutamine (Gibco BRL, Scotland), 100 μg/mL streptomycin, and 100 Iu/mL penicillin (Sigma) and incubated at 37 °C in a humidified 5% CO2 atmosphere.
The HeLa cells for experiments were taken from exponentially growing phase and cultures were plated in 25-cm2 tissue culture flasks. Disaggregation was carried out using 2-min incubation at 37 °C with a %0.05 solution of trypsin in phosphate0buffered saline (PBS). The cells were counted by the trypan blue dye exclusion method (Moldeus et al. Citation1978). The alive cells were estimated through a hemocitometer and phase – contrast microscopy.
Cytotoxicity studies by MTT assay
The HeLa cells were grown in 96-well plates (5000 cells per well in volume of 200 μL of medium) and incubated 4 h after cell seeding and prior to the addition of a filtered different concentration of PEGylated GO. Final concentrations of studied compound in the treated wells were achieved 0.1, 1, 10, 100 μg/mL. All assays were carried out in eight replicates for each concentration and means ± SD values were used to calculate the cell viability. The final concentrations of DMSO (< 0.1%) were nontoxic to the cells. In the control wells only, the complete medium was added to the cells. The incubation time in different plates was variable (24, 48, and 72 h), and during the period, the control cells showed exponential growth. Cell survival was determined by MTT test (Mossman Citation1983) which measures the reduction of the yellow tetrazolium salt MTT into a purple formazan crystal by the activity of mitochondrial NAD(P)H-dependent oxidoreductase enzymes.
Then, 20 μL of an MTT solution (5 mg/mL) in PBS was added to the wells. Samples were incubated for further 4 h at 37 °C in the humidified atmosphere with 5% CO2. Supernatant was removed and 100 μL volume of solvent (usually DMSO) was added to each well, the plates agitated on a shaker incubator for 15 min to dissolve the formazan and the optical density then read. The absorbance at 570 nm and with a reference filter of 630 nm was measured using an enzyme-linked immunosorbent assay (ELISA) microplate reader (TECAN-Sunrise, Männedorf, Switzerland).
All experiments were performed in quadruplicate, and exported values are the mean of eight replicates. The percentage of cytotoxicity and cell viability was calculated according to mean absorbance of toxicant treated cells into a mean absorbance of negative control.
After calculation of cell viability percentage, the concentration of PEGylated GO nanocarrier giving 50% inhibition on HeLa cell line (IC50) was determined in varies incubation times.
Statistical analysis
The cell viability was calculated based on the optimal density readings at 570 nm. Results of cell viability as means ± SDs were presented graphically in the form of histograms, using Microsoft Excel computer program. IC50 was determined for the test samples by nonlinear regression analysis of curves. Graph Pad Prism version 4.00 was used to calculate IC50. Statistical analysis was done by paired Student’s t-test, one-way analysis of variance (ANOVA) and repeated measures. p values less than 0.05 were considered statistically significant.
Results and discussion
GO-PEG nanocarrier characterization
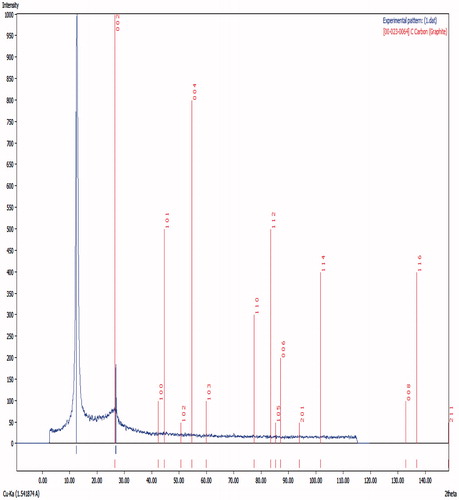
The identification of the crystalline phase of GO-PEG nanocomposite was carried out using a Bruker-D8 ADVANCE X-ray diffractometer which revealed X-ray powder diffraction (XRD) pattern when using CuKα radiation (K¼ 0.15405 nm) to determine the crystal structure of the product.
shows the XRD pattern of GO. In this figure, a sharp diffraction peak at 2θ = 12.77° is detected, suggesting the formation of GO with 6.93 Å interlayer spacing. A calculation using Scherrer's Equationequation (1)(1) for the highest peak at 2θ = 12.77 indicates an equivalent particle size of 25.6 nm.
(1)
where D is the average crystallite diameter, λ is the X-ray wavelength, θ the angle of Bragg diffraction, and β the difference between FWHM and the instrumental broadening ().
Figure 1. The XRD spectrum of graphene oxide.
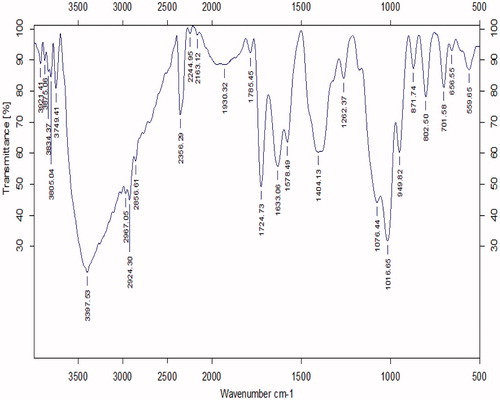
The FTIR spectrum of GO-PEG shows the C–O of ether and alcohol stretching bands at 1016 cm−1 and 1076 cm−1, the C–O of ester at 1262 cm−1, the C=O of ester at 1724 cm− 1 and the C=C bonds at 1633 and 1404 cm− 1. The stretching bands of C–H bonds were appearing at 2967, 2924, and 2856 cm− 1 (). The increased intensity of C–H and C–O stretching bands proves the effective conjugation of PEG to GO sheets, because the PEG polymer chains are full of these bonds.
Figure 2. The FTIR spectrum of GO-PEG.
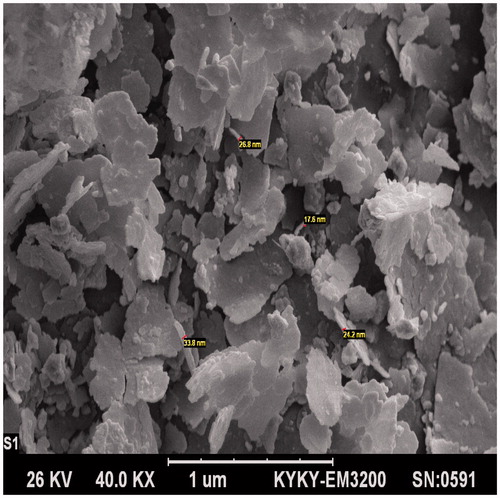
The FESEM image demonstrates plates of the synthesized GO-PEG nanocomposites, in which the monitored thickness of nanosheets were about 25 nm and layered structures of graphene plates were observed ().
Figure 3. The FESEM imaging of GO-PEG.
Cytotoxic studies
Nanotechnology can be specified as a pharmaceutical system whose various nanoscale materials have been utilized for different intention, such as biosensors, bio-imaging, diagnostic and drug delivery specially for cancer therapy (Akbarzadeh et al. Citation2012, Sharma et al. Citation2016).
A drug delivery system must be biocompatible, biodegradable, and efficiently durable. The therapeutic agents that loaded on nanocarrier require to be conserved throughout transfer and reaching to target cells such as cancer cells (Singh et al. Citation2016).
Liu demonstrated graphene platforms can use in drug delivery systems (Liu et al. Citation2013).
Nanosheets of GO are suitable to carry different agents, such as small drug, DNA, and antibody molecules, that bind to surface of nano-GO by π–π stacking and hydrophobic interactions (Abbasi et al. Citation2016). Drug-loading capacities of multilayer GO is higher than monolayer shapes but increase in number of layers and their thickness due to more rigidity of nanocarrier and then lower cell uptake or cell damage. Also, shape and size of GO nanosheets could effective on toxicity (Liu et al. Citation2013). Go nanosheets by interaction to cell membrane and mechanical damage induce cell death and could be cause of cytotoxicity effect of GO (Seabra et al. Citation2014).
PEG as a biocompatible polymer is the most used in anticancer drug delivery systems by the covalent attachment to nanomaterials and drugs. PEGylation improve the aqueous solubility of hydrophobic nanomaterials and enhance drug permeability to target cells (Banerjee et al. Citation2012, Mirakabad et al. Citation2016).
The in vitro cytotoxicity of GO-PEG nanosheets as a nanocarrier against human cervix carcinoma (HeLa) was investigated by MTT microculture colorimetric assay. In this method, by measuring the reduction of tetrazolium salt to purple formazan in living cells, the percentage was determined of HeLa cell line viability. After treatment of cancer cells with various concentrations of GO-PEG and various incubation periods for 24, 48, and 72 h, respectively (), Results show that the antiproliferative activity of GO-PEG nanocarrier significantly is dose dependent and incubation time dependent.
Figure 4. The viability percentage of the Hela cell line in various concentrations (0.1–100 μg/ml) of GO-PEG nanocarrier with a 24-h exposure. Each point represents a mean ± SD of four experiments with eight replicates per dose. Cell survival in concentrations of 1, 10, and 100 μg/ml are significantly different compared with the control group and 0.1 μg/ml has not significant difference. As indicated earlier, the bars, asterisks indicate p values that are statistically significant. *Symbol indicates (p < 0.05), **Symbol indicates (p < 0.01), ***Symbol indicates (p < 0.001). p values were calculated using statistical analysis software.
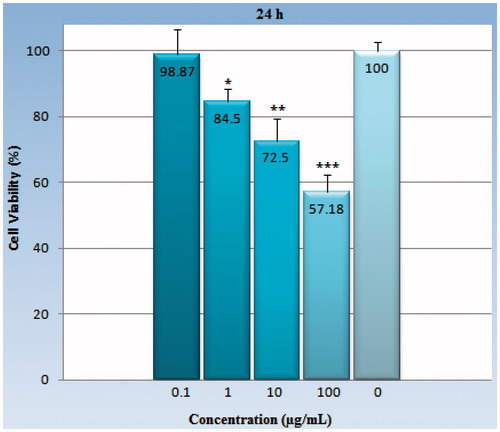
Figure 5. The viability percentage of the HeLa cell line in various concentrations (0.1–100 μg/ml) of GO-PEG nanocarrier with a 48-h exposure. Each point represents a mean ± SD of four experiments with eight replicates per dose. Cell survival in all of experimental concentrations 0.1, 1, 10, and 100 μg/ml are significantly different compared with the control group. As indicated earlier, the bars and asterisks indicate p values that are statistically significant. *Symbol indicates (p< 0.05), **symbol indicates (p< 0.01), ***symbol indicates (p< 0.001).
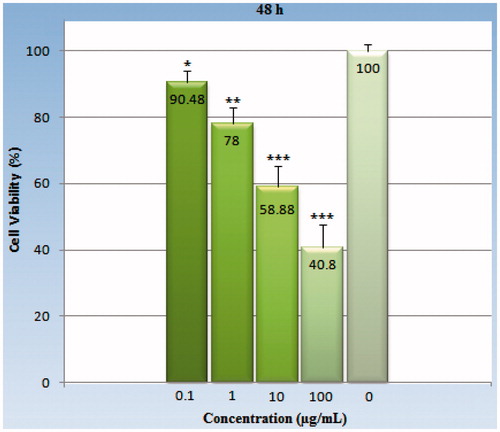
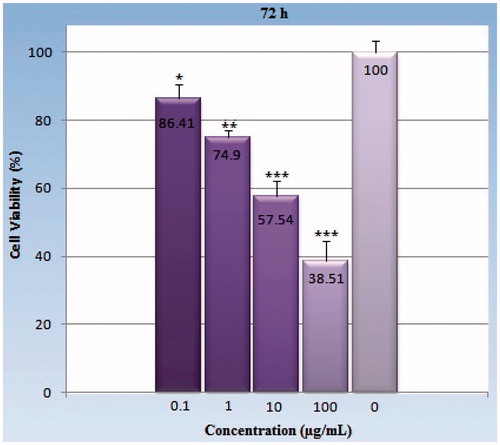
Figure 6. The viability percentage of the HeLa cell line in various concentrations (0.1–100 μg/ml) of GO-PEG nanocarrier with a 72-h exposure. Each point represents a mean ± SD of four experiments with eight replicates per dose. All of doses with p values being <0.05 are significantly different compared with the control group. As indicated earlier, the bars and asterisks indicate p values that are statistically significant. *Symbol indicates (p < 0.05), **symbol indicates (p < 0.01), ***symbol indicates (p < 0.001).
For example, the anticancer activity of GO-PEG against the HeLa cell line after 72-h incubation in 100 μg/mL concentration is 2.24 times more of 0.1 μg/mL. The results show in .
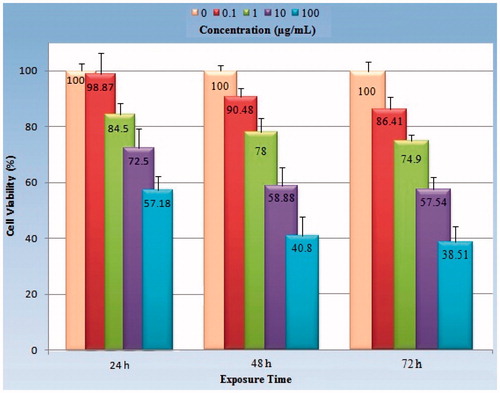
shows the time–response relationship with regard to the percentage of viability in various concentrations of GO-PEG on HeLa cells. Comparisons of data presented in this figure indicate that the cytotoxicity of GO-PEG nanocarrier in the similar concentration on HeLa cells increases with the increase in exposure time.
Figure 7. Analysis of exposure time–response relationship in regard to antiproliferative effect of GO-PEG on Hela cells. Each concentration (0.1, 1, 10, and 100 μg/ml) showed with a specific color which comparable in different exposure times. The cells were treated with different doses for 24, 48, and 72 h. Each point corresponds to a mean ± SD of four experiments with eight replicates per dose.
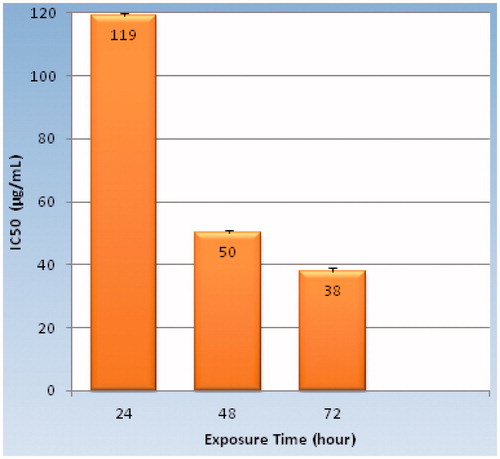
Also, IC50 (inhibitory concentration 50) of the GO-PEG after 24-h, 48-h, and 72-h incubation against HeLa cell line are, respectively, 119 ± 0.83, 50 ± 0.56, and 38 ± 0.61 μg/mL (). According to IC50 results, antiprolifrative activity of GO-PEG will be increased significantly at higher incubation period in which 72-h incubation period is 3.1 times more cytotoxic than 24-h incubation.
Figure 8. IC50 values (μg/mL) of GO-PEG nanocarrier on Hela cancer cell line in different incubation times (24, 48, and 72 h). IC50 = 119 ± 0.83 μg/mL for 24 h of exposure, IC50 = 50 ± 0.56 μg/mL for 48 h of exposure, IC50 = 38 ± 0.61 μg/mL for 72 h of exposure.
Wang et al. determined that a dose of more than 50 μg/mL of GO could decrease human fibroblast cell proliferation (Wang et al. Citation2011). Also, Hu et al. explored concentration up to 85 μg/mL of Go nanosheets is cytotoxic on A549 cell line (Hu et al. Citation2010), whereas the results of this research exhibit PEGylated GO nanosheets as a drug nanocarrier in the concentration range from 0.1 to 100 μg/mL could be significantly cytotoxic on HeLa cell line. According to data which show in , among studied concentrations, 100 μg/mL concentration of PEGylated GO in each of exposure times significantly is most cytotoxic. Probably, PEGylation of GO causes more permeability of cell membrane to synthesized GO nanosheets, enhancement of tumor cell targetability and then increase in cytotoxic effects of PEGylated GO.
Conclusions
The GO-PEG nanosheets as a drug carrier were synthesized and their structure was elucidated from the spectral and microscopic analysis. Then, the antiprolifrative effects of GO-PEG nanocarrier were evaluated on HeLa cancer cell lines by MTT assay. The MTT assay results show that the GO-PEG nanosheets as drug carriers significantly are to some extent cytotoxic on HeLa cancer cell line. Increasing of the GO-PEG concentration and exposure time increases the cytotoxicity of this substance. These results can be useful for evaluation of the actual effects of drugs loaded on this type of nanocarrier.
Disclosure statement
The authors report no conflicts of interest. The authors alone are responsible for the content and writing of this article.
References
- Abbasi E, Akbarzadeh A, Kouhi M, Milani M. 2016. Graphene: synthesis, bio-applications, and properties. Artif Cells Nanomed Biotechnol. 14:150–156.
- Akbarzadeh A, Samiei M, Davaran S. 2012. Magnetic nanoparticles: preparation, physical properties, and applications in biomedicine. Nanoscale Res Lett. 7:144.
- Anari E, Akbarzadeh A, Zarghami N. 2015. Chrysin-loaded PLGA-PEG nanoparticles designed for enhanced effect on the breast cancer cell line. Artif Cells Nanomed Biotechnol. [Epub ahead of print]. doi: 10.3109/21691401.2015.1029633.
- Banerjee SS, Aher N, Patil R, Khandare J. 2012. Poly(ethylene glycol)-prodrug conjugates: concept, design, and applications. J Drug Deliv. 2012:103973.
- Gilje S, Han S, Wang M, Wang KL, Kaner BR. 2007. A chemical route to graphene for device applications. Nano Lett. 7:3394–3398.
- Hu W, Peng C, Luo W, Lv M, Li X, Li D, Huang Q, Fan C. 2010. Graphene-based antibacterial paper. ACS Nano. 4:4317–4323.
- Kuila T, Bose S, Mishra A, Khara P, Kim NH, Lee JH. 2012. Chemical functionalization of graphene and its applications. Prog Mater Sci. 57:1061–1105.
- Liu J, Cui L, Losic D. 2013. Graphene and graphene oxide as new nanocarriers for drug delivery applications. Acta Biomater. 9:9243–9257.
- Liu T, Wang C, Gu X, Gong H, Cheng L, Shi X, et al. 2014. Drug delivery with PEGylated MoS2 nano-sheets for combined photothermal and chemotherapy of cancer. Adv Mater Weinheim. 26:3433–3440.
- Liu Z, Robinson JT, Sun X, Dai H. 2008. PEGylated nanographene oxide for delivery of water-insoluble cancer drugs. J Am Chem Soc. 130:10876–10877.
- Mirakabad FST, Akbarzadeh A, Milani M, Zarghami N, Taheri-Anganeh M, Zeighamian V, Badrzadeh F, Rahmati-Yamchi M. 2016. A Comparison between the cytotoxic effects of pure curcumin and curcumin-loaded PLGA-PEG nanoparticles on the MCF-7 human breast cancer cell line. Artif Cells Nanomed Biotechnol. 44:423–430.
- Moldeus P, Högberg J, Orrenius S. 1978. Isolation and use of liver cells. Methods Enzymol. 52:60–71.
- Mossman T. 1983. Rapid colorimetric assay for cellular growth and survival: application to proliferation and cytotoxicity assays. J Immunol Methods. 65:55–63.
- Ni Y, Zhang F, Kokot S. 2013. Graphene oxide as a nanocarrier for loading and delivery of medicinal drugs and as a biosensor for detection of serum albumin. Analytica Chimica Acta. 769:40–48.
- Poh HL, Šanek F, Ambrosi A, Zhao G, Sofer Z, Pumera M. 2012. Graphenes prepared by Staudenmaier, Hofmann and Hummers methods with consequent thermal exfoliation exhibit very different electrochemical properties. Nanoscale. 4:3515–3522.
- Rana VK, Choi MC, Kong JY, Kim GY, Kim MJ, Kim SH, et al. 2011. Synthesis and drug-delivery behavior of chitosan-functionalized graphene oxide hybrid nanosheets. Macromol Mater Eng. 296:131–140.
- Seabra AB, Paula AJ, de Lima R, Alves OL, Durán N. 2014. Nanotoxicity of graphene and graphene oxide. Chem Res Toxicol. 27:159–168.
- Shahriary L, Athawale AA. 2014. Graphene oxide synthesized by using Modified Hummers approach. Renew Energy Environ Eng. 02:58–63.
- Sharma H, Kumar K, Choudhary C, Mishra PK, Vaidya B. 2016. Development and characterization of metal oxide nanoparticles for the delivery of anticancer drug. Artif Cells Nanomed Biotechnol. 44:672–679.
- Singh D, Singh S, Sahu J, Srivastava S, Singh MR. 2016. Ceramic nanoparticles: recompense, cellular uptake and toxicity concerns. Artif Cells Nanomed Biotechnol. 44:401–409.
- Veronese FM, Pasut G. 2005. PEGylation, successful approach to drug delivery. Drug Discov Today. 10:1451–1458.
- Wang K, Ruan J, Song H, Zhang J, Wo Y, Guo S, Cui D. 2011. Biocompatibility of graphene oxide. Nanoscale Res Lett. 6:1–8.
- Xianbo M, Zeeshan A, Song L, Nongyue JH. 2015. Applications of magnetic nanoparticles in targeted drug delivery system. J Nanosci Nanotechnol. 15:54–62.
- Zhu Y, Liao L. 2015. Applications of nanoparticles for anticancer drug delivery: a review. J Nanosci Nanotechnol. 15:4753–4773.