Abstract
Objectives:
To estimate total costs and metastatic colorectal cancer (mCRC)-related costs and assess primary cost drivers of treating newly diagnosed mCRC patients after the introduction of biologic therapies.
Methods:
Using a large national claims database, costs of mCRC patients were estimated in 2004–2009 by examining (1) the cost difference between mCRC patient and their matched non-cancer cohorts, and (2) mCRC-related costs. Costs were further assessed by phase of disease (diagnostic, treatment, and death). The survival analysis technique was used to estimate cost of handling variable length of follow-up and data censoring.
Results:
A total of 6,746 mCRC patients met all eligibility criteria, 6,675 of them were matched to patients without cancer. Among the three phases of disease, the treatment phase was the longest (16.4 months). Compared with matched patients with no cancer, total monthly costs were $14,585 higher for mCRC patients, which was driven by higher inpatient ($7,546) and outpatient ($6,749) care (p < 0.001 for all comparisons). During the study period, cost share of biologics increased from 4.8% among patients diagnosed in 2004 to 9.4% for those diagnosed in 2008.
Conclusions:
The costs associated with treating mCRC are substantial. Inpatient and outpatient care remain key cost drivers in the medical management of mCRC. Cost chare of biologics was low, but increased between 2004 and 2009. The study sample only included patients with commercial and Medicare supplemental insurance in the US thus may not be generalizable to patients with other insurance or in other countries. Indirect costs associated with mCRC were not examined.
Introduction
According to estimates based on the Surveillance, Epidemiology and End Results (SEER) database, approximately 142,570 US men and women will be diagnosed with colorectal cancer (CRC) in 2010. Among them, approximately 19% will have metastatic CRC (mCRC) at diagnosis, while many others may develop metastatic disease over timeCitation1. The most common sites of metastasis are the liver and the lung. Benson suggests that as many as 30–40% of CRC patients will develop metastases of the liverCitation2.
From the early 1960s to the mid 1990s, fluorouracil (5-FU) was the primary chemotherapeutic agent available for the treatment of mCRC. However, treatment options have advanced during the last decade, as the new chemotherapies, including irinotecan, oxaliplatin and capecitabine, and the targeted biologic agents, including bevacizumab, cetuximab and panitumumab, have been approved for treatment of mCRC. Additionally, advances have been made with surgical techniques, which enhance oncology surgeon’s ability to perform resections of metastases. New chemotherapeutic and biologic agents may improve patient survival in two ways: first, they may slow or stop disease progression; and second, to the extent that they shrink previously inoperable tumors, their use in the neo-adjuvant setting may permit resection, which has been shown to have a substantial impact on survivalCitation2,Citation3.
Understanding the cost burden of treating mCRC, especially costs associated with biologics and its share in the total costs of mCRC, and identifying key cost drivers are critical for informing discussions about the value of new treatments. To the authors’ knowledge, no studies have examined costs of mCRC since the introduction of biologic therapies. A couple of studies examined costs for treating patients with CRC using the SEER-Medicare database. However, the timeframes for these studies predate the biologic use. These studies estimated the long-term cancer-related medical care costs of patients diagnosed with CRC between 1984 and 1994, by cancer stageCitation3,Citation4. Both of these estimates were made when 5-fluorouracil plus leucovorin was the standard of care for first-line treatment. By the mid-2000s, first-line treatment was dominated by treatment regimens containing irinotecan and oxaliplatinCitation2. In addition, neither of the two studies report costs associated with mCRC.
The most recent cost study was conducted by Paramore et al. to examine costs in 1998–2004. They extracted patients with mCRC from a large managed-care claims database and estimated cost difference between mCRC patients and their matched controls. For mCRC patients, the follow-up period was divided into three phases: diagnostic, treatment, and death, and costs of each phase were estimatedCitation5. However, the study period of Paramore et al. study was still before biologic agents were approved in the treatment of mCRC.
Using data from 2004 to 2008, the primary objective of this study is to provide an updated estimate of total costs of care for patients with mCRC and to examine the key cost drivers in the new era of managing mCRC when the combinations of biologics and chemotherapies have become the standard of care in mCRC and when the rates of resection are more common. Trend of cost share of biologics was also examined from 2004 to 2008.
Materials and methodology
Data source
The data sources used for this study were the Thomson Reuters MarketScan® Commercial Claims and Encounter Database and the Medicare Supplemental and Coordination of Benefits Database. The databases are constructed from claims and enrollment data provided by medium-to-large employer and health plans from across the US. They are Health Insurance Portability and Accountability Act (HIPAA) compliant. Combined, these two databases include patient-level medical and pharmacy claim histories for 30 million commercially insured lives in 2008. Enrollees are covered under a variety of plan types including both capitated (e.g., health management organizations) and non-capitated (e.g., fee-for-service) product lines. The databases capture the full continuum of care for insurance reimbursable services delivered across all settings including physician office visits, emergency department (ER) visits, hospital stays, and outpatient pharmacy claims. The age and gender distribution of patients in MarketScan are similar to that in the Medical Expenditure Panel Survey (MEPS) and the Medicare Beneficiary Survey (MCBS).
Patient selection
Patients with at least one inpatient or two outpatient diagnoses of CRC (ICD-9 codes 153.0–153.4, 153.6–153.9, 154.0, 154.1, and 154.8) and at least 1 inpatient or 2 outpatient diagnoses of metastasis (ICD-9 codes 196.0, 196.1, 196.3, 196.5, 197.0–197.4, 197.6–197.8, 198.x, 199.0) were extracted from 2004 to 2008. Index date was defined as the first claim date of metastatic disease after at least one CRC claim. Patients were excluded from the study if they had a diagnosis of 153.5 (appendix), 154.2 (anal canal, anal sphincter), or 154.3 (anus, unspecified) prior to CRC diagnosis, did not have 6 months of claims data prior to the index date, were under age 18 years on the index date, or had other primary cancer diagnoses or metastatic disease claims in the 6-month pre-period. The length of follow-up from the diagnosis of metastatic disease was variable, ending at death, the end of continuous enrollment, or the end of the study period (7/31/2009), whichever came first.
Patient baseline demographic and clinical characteristics
Patient demographic characteristics were measured on the index date. Clinical characteristics were measured during the 6-months pre-period. The Deyo–Charlson Comorbidity Index (CCI) was used to assess overall patient levels of comorbid conditionsCitation6. The Deyo CCI takes on values between 0 and 12, with higher scores representing higher risk of impending mortality based on presence of various chronic diseases. Because the control cohort was required to have no cancer diagnosis during the study period, in order to match CCI between patients with mCRC and patients without cancer, cancer diagnoses were removed from the scoring of the CCI.
Outcome metrics and methods to estimate cost of care for mCRC
The primary outcome metrics were total medical costs and cost components associated with mCRC. Cost estimates were based on paid amounts of adjudicated claims, including insurer and health plan payments, co-payments, and deductibles. All-cause total healthcare costs as well as mCRC specific costs were computed. Costs were analyzed by settings of care (inpatient, outpatient, ER, and outpatient pharmacy) as well as by type of service (such as, surgery and infusions). All costs were adjusted to 2008 dollars using the medical service component of the Consumer Price Index. mCRC-related costs for patients with mCRC were estimated using two methods.
The first method was a matched cohort analysis, similar to the Paramore et al. studyCitation5. The rationale for the case-control study design is that the cost difference between matched mCRC patients and patients with no cancer is an approximate measure of costs associated with mCRC. Each mCRC patient was assigned to a stratum defined by age (18–34, 35–44, 45–54, 55–64, 65–75, 75–84, 85+ years), gender, geographic region, calendar year of diagnosis, and CCI (0, 1, 2, 3, 4+). The potential control patients had no diagnosis of any cancer during the study period and were also assigned to a stratum. Within each stratum, one control patient was randomly selected for each mCRC patient without replacement. Costs associated with mCRC were estimated by the difference in the total costs of all medical care between matched mCRC patients and control patients. The second method directly estimated mCRC-related costs, based on claims with a primary diagnosis of CRC or mCRC and claims for treatments and procedures known to be used for mCRC. The sum of costs on these claims was considered mCRC-related costs.
Total medical costs were also examined by phase of disease. Each patient’s observation period was divided into three phases of disease according to a previously published algorithm: a diagnostic phase, a treatment phase and a death phaseCitation5,Citation7. The diagnostic phase begins with the index date and includes the full first 3 months of observation. The treatment phase consists of months 4 through the end of observation, unless a death is noted. Because claims data only have information on in-hospital deaths, a previously published algorithm to identify deaths was appliedCitation5,Citation8. Patients who had a hospital or emergency room visit with a fatal event within 30 days of their last available enrollment data were classified as having died. Following the algorithm used by Paramore et al., fatal events included hospitalizations, ER visits, the use of cardiac-stimulating medications such as epinephrine or lidocaine, ICD-9 diagnosis codes for cardiac arrest or failure, and procedure codes for resuscitation or defibrillation. For patients identified as having died, the death phase consisted of the last 3 months of observed claims, with any remaining months falling into the diagnostic and treatment phases. For patients who died and had only 3 or fewer months of follow-up, all months were allocated to the death phase. For patients who did not die and only had 3 or fewer months of data, all months were allocated to the diagnostic phase.
The secondary outcome metrics were healthcare utilization. Number of services received in the inpatient, outpatient, and ER setting and number of outpatient pharmacy prescriptions were counted on a monthly basis over the entire follow-up period for each patient.
Survival-based method
Because survival following diagnosis with cancer, particularly metastatic disease, is highly variable, it is difficult to assess costs over fixed periods of time or make use of data from all patients regardless of the amount of time they were observed. Therefore, estimation techniques that can adjust for varying periods of observation and censoring are essential in estimating the costs of care for cancer patients. The survival-based method developed by Etzioni and colleaguesCitation9 and LinCitation10 was used to estimate and compare costs between mCRC patients and controls over the variable length of follow-up. The method takes into account the survival function for each patient and assumes that once an event occurs that removes the patient from observation (e.g., death, end of insurance eligibility, or end of data follow-up) then the cost following the event or censoring is zero. To estimate the incremental total cost of care of mCRC patients over their controls during the full period of observation in this study, the method was applied to both cases and controls to estimate the cumulative costs at the end of years 1, 2, 3, and 4. Patients were considered censored if the study period ended (7/31/2009). Patients noted as having died or who were no longer observed in the database before the end of the study period were treated as failures or as not having survived in the model. The 95% confidence interval of survival adjusted costs was estimated using a bootstrap method with 2,000 iterations. The difference between the estimated costs of cases and controls provides an estimate of the total cost of care attributable to mCRC.
Trend of chemotherapy and biologic therapy cost share over time
In addition to total costs of care for mCRC, the trend of chemo- and biologic therapy cost shares was also analyzed. Total costs as well as costs of chemotherapies and costs of biologics during the follow-up period after mCRC diagnosis were estimated and the percentages of total costs that were due to chemotherapy and biologics were calculated, respectively.
Results
Patient population
Overall, a total of 6,746 mCRC patients met all eligibility criteria for the study. They were matched to patients without cancer, resulting in a 98.9% match rate and a final sample of 6,675 patients with newly diagnosed mCRC.
Demographic and clinical characteristics for the cases and controls are shown in . The mean age was 64.1 (SD 13.1) for cases and 62.6 (SD 14.1) for controls. In both cohorts, just over half (55.5%) of the patients were men; 29.3% lived in the North Central and 40.6% in the South. Cases and controls were well matched on CCI, with 73.3% of both samples having no other indications of chronic disease in the 6 months prior to index. On average, cases were observed for 488 days (SD 426) or roughly 16.3 months following diagnosis of mCRC, and controls were observed for 800 days (SD 531) days or roughly 26.7 months following index. Based on the first CRC diagnosis, 69.7% of cases had colon cancer and 30.3% had rectal cancer. The major sites for metastatic disease were liver (46.8%), lung (15.1%), retroperitoneum and peritoneum (11.6%), and other specified site (18.7%).
Table 1. Patient demographic and baseline clinical characteristics.
Healthcare resource utilization for mCRC
The variation in healthcare resource utilization by place and type of service for patients with mCRC is shown in . Most patients (86.9%) had a hospital admission at some point during the course of their diagnosis and treatment and 55.5% of patients used ER at some point. Outpatient services were spread among visits to primary care (used by 65.4% of patients), surgeons (40.1%), oncologists (32.6%), and hematologists (23.8%). The high degree of variation in use of each of these services was noted by the large standard deviations in the number of monthly visits. In addition to receiving ongoing oncology care, 38.4% of patients had at least one surgical procedure during their treatment. Compared with controls, patients with mCRC had more inpatient admissions (0.37 vs. 0.05), ER visits (0.18 vs. 0.03), physician office visits (1.42 vs. 0.34), and outpatient hospital visits (0.23 vs. 0.01) per month.
Table 2. Monthly healthcare resource utilization: mCRC cases and controls.
Healthcare expenditure
Cost difference between cases and controls
The overall monthly cost attributable to mCRC based on a comparison of total costs for cases and controls was $14,585 (). The drivers of the cost difference were inpatient admissions (51.7%, including 16.2% in surgical procedures), and outpatient including office visits, outpatient hospital services, infusions, and other (46.3%). Other outpatient costs included costs of laboratory tests, radiology, X-rays, home healthcare, durable medical equipment, nursing home/assisted living, etc. Cost of chemotherapy and biologics accounted for 8.7% and 8.8% of the costs attributable to mCRC, respectively, during the entire study period.
Table 3. Monthly healthcare costs: mCRC cases and controls.
mCRC specific treatment costs
Using claims with CRC or mCRC diagnoses only, mCRC-related costs amounted to $9,798 per month (). Of which, 52.2% was due to inpatient admissions (including 22.2% due to surgical resection) and 47.7% to outpatient services (office visits, outpatient hospital services, infusions, and other). Chemotherapy accounted for 10.6% and biologics accounted for 11.1% of the mCRC-related costs. The difference in attributable cost between the first method using cases and controls ($14,585) and this method which examines cancer specific claims ($9,798) was $4,787.
Costs by phase of disease
The mean duration of the diagnostic phase and the death phase was 2.8 months and 2.4 months, respectively. The treatment phase was the longest with 16.4 months. In this sample, 1,818 (27.2%) patients were noted as having died. The average expenditure per month was the highest during the death phase ($26,649), followed by $16,340 in the diagnostic phase, and the lowest during the treatment phase ($8,599).
Survival-based results
The difference in the estimated cumulative costs for cases and controls was analyzed based on the survival-based analysis. The Kaplan–Meier survival estimates for mCRC patients and their matched control cohort were plotted in . The Kaplan–Meier survival probability in a given month was multiplied by the average costs in that month, and then cumulative costs in the first 1–4 years were estimated. Compared with matched patients without cancer, the total incremental cost of care for a patient with mCRC was approximately $163,400 over a 4-year period, with the greatest proportion of costs incurred in the first year ($97,851 or 59.9%) and second year ($36,627 or 22.4%) following diagnosis with metastatic disease. The incremental costs were $19,761 in the third year and $9,161 in the fourth year ().
Figure 1. Kaplan–Meier survival estimates, by mCRC status.
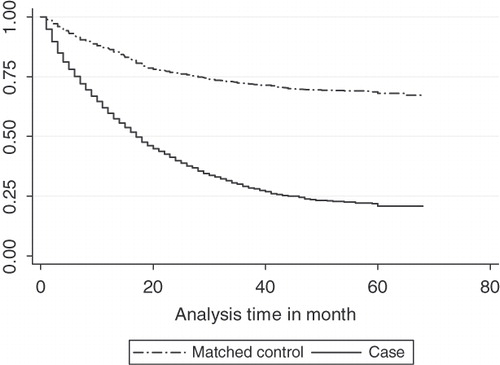
Table 4. Incremental costs estimated using survival-based method.
Trend of biologics and chemotherapy cost shares by year
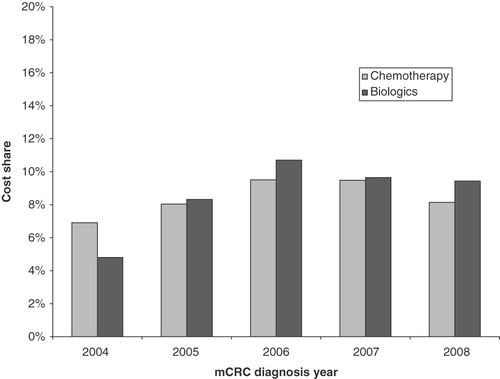
The cost of chemotherapy as a percentage of total cost went up from 6.9% for patients diagnosed in 2004 to 8.1% for patients diagnosed in 2008 (). The cost share of biologic therapy increased from 4.8% for patients diagnosed in 2004 to 9.4% for those diagnosed in 2008. Compared with patients diagnosed in 2004, mean monthly total costs increased from $14,828 to $15,740, while mean monthly costs of biologics and chemotherapy increased from $713 to $1,485 and from $1,024 to $1,282, respectively, for patients diagnosed in 2008.
Figure 2. Percentage of total costs that are due to chemotherapy and biologics.
Discussion
This study provides an updated estimate of costs of care for patients with mCRC using administrative claims data from January 2004 through July 2009, which captured the impact of the newer biologic agents, bevacizumab, cetuximab, and panitumumab on treatment costs. This study used two methods to estimate the treatment costs attributable to mCRC.
Overall, the study estimated the total incremental costs of mCRC treatment to be roughly $163,400 over 4 years following diagnosis with metastatic disease as compared to patients without cancer, with the greatest proportion of costs incurred in the first year ($97,851 or 59.9%) and second year ($36,627 or 22.4%). The key cost drivers of mean monthly costs are inpatient care (51.7%) and outpatient care (46.3%, including biologics and chemotherapy). Over the study period from 2004 to 2008, the cost share due to chemotherapy was relatively stable at around 10% while the total cost share due to biologic treatments has increased from 4.8% in 2004 to 9.4% in 2008, with mean monthly costs increasing from $713 to $1,485.
By comparing findings from the study that was carried out by Paramore et al. that used older data of April 1998 to January 2005, the total treatment costs have increased. The monthly costs reported here were higher than those reported in the Paramore et al. study in all three phases: $16,340 vs. $12,205 in the diagnostic phase, $8,599 vs. $ 4,722 in the treatment phase, and $26,649 vs. $12,328 in the death phase. While the costs in Paramore et al. were 2005 dollars and the costs in this study were 2008 dollars, it is also important to note that the average overall follow-up time has increased for patients included in this study as compared to those in the Paramore et al. study. Although the Paramore et al. study covered a longer study period than the current study (7 vs. 5.5 years), the mean duration of the treatment phase in this study was over 6 months longer than that reported in Paramore et al. (16.4 vs. 10.1 months), while the mean duration of diagnostic and death phase was similar in both studies. Potentially this might be due to the advances made in chemotherapies and the introduction of biologics.
This study used two methods to estimate treatment costs relating to mCRC. One is the matched cohort approach. Since mCRC patients and patients without cancer are well matched, this method provides a reasonable estimate of the incremental cost of treating a patient with mCRC relative to a person without cancer. The second method directly estimated mCRC-related costs, using only claims with a CRC or mCRC diagnosis or claims for treatments and procedures known to be used for mCRC. The two methods resulted in a difference of $4,787 in monthly healthcare costs for patients with mCRC. The mCRC claims-based method may produce lower estimates of the costs attributable to a particular condition because claims for care related to a condition may not always carry the relevant diagnosis code. For example, pre-existing non-mCRC medical conditions might become aggravated by mCRC, thereby resulting in increased use of primary care services for those conditions, but this greater resource utilization would not be included in the estimate of cancer-attributable costs. mCRC may also complicate or exacerbate the treatment of other non-cancer medical conditions and increased the treatment costs of those conditions, which could only be identified by matched cohort approach but not the mCRC claims method. Thus, direct estimation based on diagnoses and disease-specific procedures may underestimate the true cost of an illness.
In addition to the Paramore et al. study that examined total costs of mCRC treatment, several recent studies examined drug costs of new treatment options or cost per life-year gained in patients with mCRC. Using data on drug cost alone, Wong et al. estimated an incremental cost effectiveness (ICER) of $100,000 per discounted life-year with chemotherapy, and $171,000 per discounted life-year with monoclonal antibodiesCitation11. Similarly, Howard et al. found that new mCRC treatment, including cetuximab and bevacizumab, was associated with improvement in survival as well as increased drug costs, and cost per quality-adjusted life-year gained was estimated to be $99,100Citation12. A systematic review on cost effectiveness of adding biologics to standard chemotherapy care in mCRC patients found that costs per quality-adjusted life-years gained for bevacizumab and cetuximab were £62,857 and £30,000, respectivelyCitation13. In addition, variation in costs of different CRC treatment regimens is documentedCitation14.
This study estimates total cost of illness associated with mCRC. Comparing cost effectiveness of different treatment regimens is beyond the scope of this study. The current study offers some advantages over previous studies on total costs of illness for mCRC. The data used were from January 2004 to July 2009, which captures the impact of newer chemotherapy and biologic treatments. The matched cohort analysis approach takes care of potential influence by changes in general healthcare delivery system. Finally, this study uses the sophisticated statistical analysis to handle data censoring issues to generate robust cost estimate in the treatment of mCRC. In future studies, multivariate regressions can be used to control for remaining unbalances between the matched mCRC patients and their controls and also to account for the skewness of the cost distribution.
In addition to the commonly recognized constraints of administrative claims dataCitation15, several limitations specific to this study should be noted when interpreting the results. First, given the lack of a specific ICD-9 code that identifies mCRC, the authors followed the approach used by Paramore et al. and applied an algorithm that first identified patients with CRC and then identified the subset with indications of metastatic diseaseCitation5. The application of the algorithm identified 12.8% of the CRC patients as having metastatic disease, less than the SEER estimates of 19%Citation1, suggesting that the study population was not overestimated. To be conservative, patients with a metastasis diagnosis prior to the first CRC diagnosis were excluded from the study, which might have excluded mCRC patients who presented metastasis first and their primary tumor was discovered later. A second limitation is that, in the database used for this analysis, death could only be identified using hospital discharge status, and the death data were not available if patients died at home or in an outpatient setting. Thus, a proxy measure for identifying deaths was used, which has been employed in previous publicationsCitation5. The death proxy might have overestimated death, but only 27.2% of the study mCRC patients were flagged as dead – much lower than the 41.2% death rate in Paramore et al. Third, the length of follow-up was dependent on the year in which the patient was diagnosed, so patients diagnosed in later years during the study period might not have enough follow-up time to experience biologic treatment, which may influence the cost share of biologics. However, because biologics were likely to be used in earlier lines of therapy (only 2.9% of the total costs were due to biologics in the death phase), the impact would not be substantial. Fourth, this study examined only direct medical costs associated with mCRC, and indirect costs from lost productivity were not included. Finally, the study population consisted of patients with commercial insurance, thus the results may not be representative of all patients with mCRC, especially those uninsured or covered by Medicaid.
Conclusion
This study provides an up-to-date estimate of total costs of care associated with mCRC. Patients with mCRC incur substantially higher treatment costs than their matched non-cancer controls. Compared with findings from previously published literature based on outdated data, the treatment phase in this study was substantially longer. The costs associated with treating mCRC are substantial, with an incremental monthly cost of $14,585 compared with matched patients without cancer. Inpatient and outpatient care remained the key cost drivers. Cost share of biologics was low, but increased between 2004 and 2009.
Transparency
Declaration of funding
This study was funded by Amgen, Inc.
Declaration of financial/other relationships
Z.Z, B.B, and S.G. are Amgen employees and hold Amgen stocks. X.S., C.G., and Z.C. are employees of Thomson Reuters, which received funding for this study.
Acknowledgments
No assistance in the preparation of this article is to be declared.
Reference
- SEER Stat Fact Sheets. Accessible at http://seer.cancer.gov/statfacts/html/colorect.html. Accessed June 19, 2009
- Benson A. Epidemiology, disease progression and economic burden of colorectal cancer. J Manag Care Pharm 2007;1:S5-18
- Ramsey S, Berry K, Etzioni R. Lifetime cancer-attributable cost of care for long term survivors of colorectal cancer. Am J Gastroenterol 2002;97:440-445
- Etzioni R, Ramsey S, Berry K, et al. The impact of including future medical costs when estimating the costs attributable to a disease: a colorectal cancer case study. J Health Econ 2001;10:245-256
- Paramore C, Thomas S, Knopf K, et al. Estimating costs of care for patients with newly diagnosed metastatic colorectal cancer. Clin Colorectal Cancer 2006;6:52-58
- Deyo RA, Cherkin DC, Ciol MA. Adapting a clinical comorbidity index for use with ICD-9-Cm administrative databases. J Clin Epidemiol 1992;45:613-619
- Rao S, Kubisiak J, Gilden D. Cost of illness associated with metastatic breast cancer. Breast Cancer Res Treat 2004;83:25-32
- Joyce AT, Iacoviello JM, Nag S, et al. End-stage renal disease-associated managed care costs among patients with and without diabetes. Diabetes Care 2004;27:2829-2835
- Etzioni RD, Feuer EJ, Sullivan SD, et al. On the use of survival analysis techniques to estimate medical care costs. J Health Econ 1999;18:365-380
- Lin DY, Feuer EJ, Etzioni R, et al. Estimating medical costs from incomplete follow-up data. Biometrics 1997;53:419-434
- Wong Y, Meropol NJ, Speier W, et al. Cost implications of new treatments for advanced colorectal cancer. Cancer 2009;115:2081-2091
- Howard DH, Kauh J, Lipscomb J. The value of new chemotherapeutic agents for metastatic colorectal cancer. Arch Intern Med 2010;170:537-542
- Tappenden P, Jones R, Paisley S, et al. Systematic review and economic evaluation of bevacizumab and cetuximab for the treatment of metastatic colorectal cancer. Health Technol Assess 2007;11:1-128, iii-iv
- Ferro SA, Myer BS, Wolff DA, et al. Variation in the cost of medications for the treatment of colorectal cancer. Am J Manag Care 2008;14:717-725
- Birnbaum HG, Cremieux PY, Greenberg PE, et al. Using healthcare claims data for outcomes research and pharmacoeconomic analyses. Pharmacoeconomics 1999;16:1-8