Abstract
Objective:
This study evaluated the overall burden of illness of chemotherapy-induced nausea and vomiting (CINV) and associated all-cause costs from a hospital’s perspective (costs to the hospital) in patients with cancer treated with chemotherapy (CT) in the US hospital outpatient setting.
Methods:
Patients with a cancer diagnosis aged ≥18 years initiating CT in a hospital outpatient setting for the first time between April 1 2007 and March 31 2009 were extracted from the Premier Perspective Database. Patients were followed through eight CT cycles or 6 months post-index date, whichever occurred first. Within each CT cycle, the follow-up time for CINV event estimation was from day 1 (except rescue medication use that was identified from day 2) to cycle end. A multivariate regression model was developed to predict the CINV event rate per CT cycle in the study follow-up period. Associated total all-cause costs of managing CINV from a hospital’s perspective were analyzed descriptively. Event rate and associated costs were estimated in the entire hospital setting (outpatient, inpatient, and emergency room). All-cause costs included inpatient, hospital outpatient, and ER visit costs (identified through a primary or secondary diagnosis code for nausea, vomiting, and/or volume depletion) and pharmacy cost (rescue medications for CINV treatment). All physician costs and non CINV-related treatment (pharmacy) costs were excluded from the analyses.
Results:
Among 11,495 study patients, 8,806 patients (76.6%) received prophylaxis for all cycles in the follow-up period. The overall base population had an average age of 63.3 years, was 51.0% female, and 72.7% White. The distribution of emetogenicity for cycle 1 CT cycle was 26.0% HEC, 46.1% MEC, and 26.4% LEC/MinEC combined. In the follow-up period, a total of 47,988 CINV events with an associated total all-cause treatment cost of $89 million were observed. Average daily treatment cost for all care settings was $1854.7. The regression model predicted a 20% CINV event rate per CT cycle in the follow-up period. Study limitations include potential lack of generalizibility, absence of data on certain confounders including alcohol consumption and prior history of motion sickness, lack of a control analysis group to estimate incremental use of resource utilization and associated costs, and a potential for cost under-estimation.
Conclusion:
In the current study analysis, a 20% CINV event rate per CT cycle per patient was predicted with an associated all-cause average daily total cost of approximately $1850. Further studies on early and appropriate antiemetic prophylaxis on CINV rates and economic outcomes are warranted.
Introduction
Chemotherapy-induced nausea and vomiting (CINV) remains an important clinical problem and a common, distressing adverse event (AE) for patients undergoing chemotherapy (CT)Citation1–3.Certain patient characteristics known to increase the risk of a CINV event are age, gender, and emetogenic potential of the CT regimenCitation1. A total of 70–80% of patients receiving CT experience a CINV eventCitation4, with acute and delayed CINV symptoms occurring in 36% and 59% of patients, respectivelyCitation3. Poorly controlled CINV can significantly impact daily functioning and is associated with medical complications that may become life-threatening (e.g., weight loss, dehydration, electrolyte imbalance, anorexia), leading to re-hospitalization, increased medical costs, and morbidityCitation1,Citation5.
Antiemetic regimens for the prevention of acute and delayed CINV (≤24 hours and >24 hours up to 5 days, respectively) include serotonin (5-HT3) receptor antagonists, corticosteroids, neurokinin (NK1) receptor antagonists, benzamide analogs, phenothiazine derivatives, butyrophenones, benzodiazepines, and dopamine receptor antagonistsCitation6–8. The American Society of Clinical Oncology (ASCO) and National Comprehensive Cancer Network (NCCN) guidelines note that patients receiving CT should preferentially be treated with antiemetic regimens with the highest therapeutic index – 5-HT3 receptor antagonists, corticosteroids, and NK1 receptor antagonists – due to the high efficacy and safety profiles when used in the recommended dosesCitation6,Citation8.
Despite the advances in new and more advanced cancer treatments, CINV remains a serious complication and can also increase medical care costs and resource utilization. Few studies have evaluated the incidence and cost of CINV events for patients with cancer receiving CT in a hospital outpatient setting in the USCitation9–15.
This study evaluated the overall burden of illness related to the number of CINV events and the associated all-cause total cost from a hospital’s perspective in patients with a cancer diagnosis treated across all types of CT in a hospital outpatient setting. Even though study patients were identified from a hospital outpatient setting, CINV event rate and associated costs were evaluated in the other hospital settings including inpatient and emergency rooms (ER) as well. Factors contributing to the risk of CINV were also evaluated. Additionally, differences in resource utilization and associated costs between CT cycles that received antiemetic prophylaxis and cycles that did not receive antiemetic prophylaxis in the follow-up period were also estimated.
Patients and methods
Data source
In this retrospective, longitudinal, observational study, data were derived from Premier’s Perspective Database, a hospital-service database that includes detailed patient-level and cost data, associated with inpatient stays and visits to outpatient facilities for participating database hospitals. The Premier Perspective Database contains data from over 600 hospitals across the US that details information on patient demographics (age, sex, race, marital status), hospital characteristics, principal and secondary diagnoses, payor, cost of care, medication utilization (name, strength, quantity dispensed, day of administration), department cost and charge details, length of stay, and physician specialty (physician costs were not obtained in the database). A unique patient identification number allows linkage of visits within the same hospital outpatient facility for a given patient. Drugs are not linked to their specific indication for use within the database. The data are de-identified in accordance with the Health Insurance Portability and Accountability Act (HIPPA). This retrospective analysis did not involve patient intervention and used data with masked data identifiers.
Study patients and follow-up time
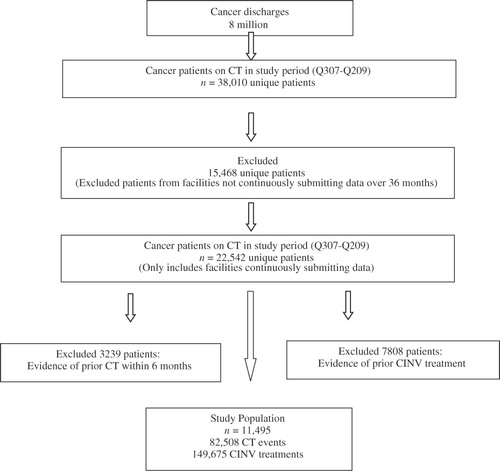
The study cohort consisted of patients aged 18 years or older with a cancer diagnosis initiating single or multi day CT for the first time (index date) between April 1, 2007 and March 31, 2009 at an outpatient hospital facility (). Patients might have received radiation therapy in addition to CT. Cancer diagnosis was defined using appropriate International Classification of Diseases, 9th Revision (ICD-9) codes and was recorded on an outpatient hospital claim 60 days before or after the index date and was classified as a primary cancer site. The primary cancer site was identified using a hierarchy of 18 anatomical cancer groupings based on the likelihood of each cancer grouping being a primary versus secondary tumorCitation16. Patients with more than one cancer site grouping were classified into a single primary cancer site using this hierarchy where lower ranked cancers were assumed to be primary tumors and higher ranked cancers were assumed to be secondary tumors. Additional inclusion criteria were patients with no evidence of nausea and vomiting (identified through appropriate ICD-9 Clinical Modification (CM) codes) or a hospital charge for a CT agent or antiemetic medication in the 6-month pre-index period, and 36 consecutive months of hospital submission data (). Patients were followed through eight CT cycles or 6 months post-index date, whichever occurred first. Within each CT cycle, the follow-up time was from day 1 (except use of rescue medications that was identified from day 2) to end of cycle. Chemotherapy was categorized as highly emetogenic (HEC), moderately emetogenic (MEC), low emetogenic (LEC), or minimal emetogenic (MinEC) per NCCN guidelinesCitation8. In case of multiple CT agents, the CT with the highest emetogenic potential per NCCN guidelines was used to classify the emetogenic risk for each CT cycle. The unit of analysis was a patient CT cycle. A cycle length was defined as 7 days or less (i.e., if there was a gap of more than 7 days between any two CT administrations, the second CT administration was considered day 1 of cycle 2).
Figure 1. Hospital outpatient patient identification flow chart. Q, quarter; n, total number of patients; CT, chemotherapy; CINV, chemotherapy induced nausea and vomiting.
Since the Premier Perspective Database did not contain information on body surface area (BSA) or patient height and weight required to calculate BSA, values of 1.6 m2 for adult women and 1.9 m2 for adult men were assumed for the calculation. Antiemetic prophylaxis was defined as any of the following drug classes: 5-HT3 receptor antagonists, corticosteroids, benzodiazepines, antihistamines, NK1 receptor antagonists, butyrophenones, phenothiazines, and cannabinoids. An antiemetic medication was considered to be for prophylaxis use rather than for treatment if the medication was given on the day of CT. If a patient received more than one emetogenic risk category CT agent (i.e., a HEC and a MEC), then the patient was considered as prophylaxed if he or she received an antiemetic prophylaxis medication for all the highest emetogenic risk CT administration days within each CT cycle.
Identification of CINV events and associated healthcare resource utilization and costs
The primary study outcome, a CINV event in the study follow-up period at a CT cycle level, was defined as one of the following: any hospital visit [inpatient, hospital outpatient, or emergency room (ER)] associated with a primary or secondary ICD-9 code of 787.0 (nausea and vomiting), 787.01 (nausea with vomiting), 787.02 (nausea alone), 787.03 (vomiting alone), 276.5 (volume depletion), 276.50 (volume depletion, unspecified) from each CT administration day 1 (index date) until the end of the CT cycle, or use of a rescue medication a day after each CT administration (day 2 until the end of the CT cycle). The CINV events per CT cycle were summed to get the total number of CINV events across all cycles in the follow-up period. The codes for volume depletion included 276.50 (volume depletion, unspecified), 276.51 (dehydration), and 276.52 (hypovolemia). The list of rescue medications identified through appropriate J-codes included 5-HT3 receptor antagonists, NK1 receptor antagonists, antihistamines, benzodiazepine, dexamethasone, butyrophenones, cannabinoids, phenothiazines, and other steroids (non-dexamethasone).
Total all-cause healthcare costs associated with CINV event management at a CT cycle level from a hospital’s perspective (costs to the hospital) comprising of medical resource utilization [inpatient, hospital outpatient, ER visits] (identified through a primary or secondary diagnosis code for nausea, vomiting, and/or volume depletion) and pharmacy cost (rescue medications for CINV treatment) were the hospital costs as reported in the database. All physician costs and non CINV-related treatment (pharmacy) costs were excluded from the analyses. Although patients with a cancer diagnosis initiating CT treatment in a hospital outpatient setting were identified and included in the study, all-cause resource use and associated costs of CINV management were estimated in the outpatient and other hospital settings including inpatient and ER. The costs per cycle were added to get the total all-cause costs across all cycles in the follow-up period. The dataset also provided the ability to further classify a hospital visit into three severity categories: emergent, urgent, or routine/elective inpatient/hospital outpatient admission (as coded in the database), except for maternity and neonatal admissions. The appropriate admission category depended on the clinical condition of the patient as assessed by the receiving physician. A routine/elective admission occurred when a patient was admitted as planned or as a follow-up and thus not considered as emergent or urgent. An urgent admission was defined as a type of emergency admission where the admission was delayed for hospital/patient reasons and the patient’s condition was such that he/she was not clinically compromised or disadvantaged by the short delay. An emergent admission occurred when, for clinical reasons, a patient was admitted at the earliest possible time after seeing a doctor.
Statistical analysis
Descriptive statistics were calculated for continuous and categorical variables at baseline for the study patients. For continuous variables, means (SDs) and medians were generated. For categorical variables, percentages were reported. For initial grouping purposes, study patients were classified into patients who received antiemetic prophylaxis for the entire follow-up period and those who did not. Demographic and clinical characteristics between these two groups were analyzed using t-test for means and chi-square test for frequencies. An a priori level of significance of 0.05 was set for all of the analyses. Patient demographics including age, gender, geographic region, payor type, and race were tabulated. Comorbidity burden was assessed using the Charlson Comorbidity Index (CCI) score, based on a review of medical claims occurring during the 6 months prior to index dateCitation17. The CCI score considers patient age and assigns a weight ranging from 0 to 6 corresponding to each comorbid condition, identified by ICD-9-CM codes found in medical claims. Weights are summed for a score between 0 and 29, with higher scores indicating greater comorbidity burden in the patient. For this analysis, all cancer codes and weights were removed from the CCI score to eliminate double counting.
Descriptive statistics were also used to summarize the total number of CINV events across all CT cycles in the study follow-up period without controlling for patient demographic and clinical variables. An average number of CINV events per CT cycle for the study period was also estimated. A generalized, linear multivariate regression model using a negative binomial distribution was developed after adjusting for several available demographic and clinical variables to estimate the CINV event rate per CT cycle per patient over the study follow-up period. The main dependent variable was any CINV event in the follow-up period. The independent variables in the model included age, CCI score, number of CT cycles, gender, race, primary payor, presence of a CINV event in the first CT cycle, primary cancer site, CT emetogenicity, average cycle length, cycles with antiemetic prophylaxis, and average number of CT days. Having tested for under- or overdispersion of the dependent variable (i.e., conditional variance is greater than the mean) and finding that the dependent variable does not have an excessive number of zeroes, negative binomial regression was used as an appropriate model for the study. The regression models the log of the expected count as a linear function of the predictor/independent variables. The interpretation is as follows: for a one unit change in the predictor variable, the difference in the logs of expected counts of the dependent variable is expected to change by the respective regression coefficient, given the other independent variables in the model are held constant. Multicollinearity diagnostics were performed via assessment of variance inflation factors for all model covariates. No significant collinearity existed between final reported model covariates. Healthcare resource utilization costs associated with CINV were estimated descriptively without adjusting from potential confounding demographic and clinical variables. All analyses were conducted using SAS software, Version 9.1 (SAS Institute, Cary, NC).
Results
Sample and treatment characteristics
summarizes attrition as inclusion and exclusion criteria were applied. Among 11,495 study patients, 8806 patients (76.6%) received antiemetic prophylaxis for the entire study follow-up period. The baseline demographic and clinical characteristics of all patient groups are summarized in . The mean age of patients was 63.3 years (SD: 13.4 years), 51.0% were female, and 72.7% were White. The most common tumor types were lung (19.8%), breast (15.9%), urinary tract (13.8%), and other/unknown (35.1%). The distribution of emetogenicity for cycle 1 CT cycle was 26.0% HEC, 46.1% MEC, and 26.4% LEC/MinEC combined. The majority of patient payor status had traditional Medicare (41.6%) and traditional non-capitated managed-care coverage (23.9%). The average Charlson Comorbidity Index (CCI) score was 0.2 (SD: 0.5). An average CT cycle duration was 22.5 days (SD: 40.1 days), with 1.6 (SD: 1.5) average CT days per cycle in the study follow-up period ().
Table 1. Baseline demographic and clinical characteristics.
Among patients who received antiemetic prophylaxis for the entire study follow-up period (n = 8806) versus those who did not (n = 2,689), the prophylaxis group patients were significantly younger versus the non-prophylaxis group patients [62.7 (SD: 13.1) vs. 66.1 (SD: 14.2) years; p < 0.001], comprised of less Whites (71.7 vs. 75.9%) and more African-Americans (12.5 vs. 10.3%); p < 0.0001, had a higher percent of HEC (30.0 vs. 3.7%) and MEC administrations (38.8 vs. 9.8%); p < 0.0001 in the first CT cycle, and consisted of more patients with lung cancer (22.9 vs. 9.8%), gynecological cancer (7.8 vs. 3.1%), and less breast cancer (14.3 vs. 21.3%); p < 0.0001. The CCI score for the prophylaxis group was significantly lower versus the non-prophylaxis group: 0.1 (SD: 0.5) and 0.3 (SD: 0.7), respectively; p < 0.0001 ().
Unadjusted incidence of CINV events in the follow-up period
In 42,199 CT cycles, a total of 47,988 CINV events related to either the ICD-9-CM codes for nausea, vomiting, and/or volume depletion or related to rescue medications were observed in the follow-up period for the study population. This translated to approximately 1.1 events per CT cycle in the follow-up period. The most common antiemetic rescue therapies administered were 5-HT3 antagonists (51.2%) and dexamethasone (35.9%). Among patients who were admitted due to a CINV event, most of these patients were frequently admitted on a routine or elective basis (49.6%) and on an emergent basis (35.9%) (). In CT cycle 1, 86.2% of patients with a CINV event had a delayed event (an event that occurred after 24 hours of CT initiation) of which 80.3% were identified through use of rescue medication/s. This trend was consistent across all study cycles. For cycle 8, the split up was 86.4% of patients with a delayed CINV event of which 78.5% were identified through use of rescue medication/s.
Table 2. Overall CINV event rate during follow-up period.
Among CT cycles where antiemetic prophylaxis was provided versus those cycles where antiemetic prophylaxis was not provided, the prophylaxis cycles showed a higher percent of CINV events identified through ICD-9 codes (10.7 vs. 9.1%; p < 0.0001), while showing a lower percent of events identified through antiemetic rescue medication use (90.3 vs. 91.7%; p < 0.0001) (). Prophylaxis cycles (n = 37,010; 42,899 events) had a lower percent of events classified as emergent (35.5 vs. 39.6%) and urgent (14.2 vs. 15.8%), while a higher percent of events were classified as routine/elective (50.3 vs. 44.5%) versus non-prophylaxis cycles (n = 5,189; 5,089 events; p < 0.0001) ().
Multivariate regression general linear model results: adjusted risk of CINV
The regression model predicted a 20% CINV event rate per CT cycle per patient (converted parameter estimate of the intercept: 1.20) in the follow-up from the index date after adjusting for baseline variable differences. In comparison to patients aged ≤65 years, patients older than 65 years of age were at a lower risk for CINV events (1.02; p = 0.0002) (). Female patients were also shown to have a higher risk versus male patients (1.33; p = 0.0028). Patients of African-American and Hispanic descent were at a greater risk for CINV events (1.36; p = 0.0056 and 1.39; p = 0.0379) versus White patients (). A CINV event in CT cycle 1 (versus no CINV event in cycle 1) and number of CT cycles in the follow-up period were found to be significantly associated with CINV event risk (4.41; p < 0.0001 and 1.42; p < 0.0001, respectively). Patients receiving lower emetogenic CT (LEC/MinEC combined) during cycle 1 had a lower CINV event risk versus patients receiving HEC in cycle 1 (1.03; p = 0.0001), while patients receiving MEC in cycle 1 showed a slightly higher risk, though statistically non-significant (1.22; p = 0.6403) (). This may be due to the fact that patients initiating treatment on MEC in cycle 1 might have potentially changed to a HEC regimen in subsequent cycles. In comparison to patients with lung cancer, patients who were diagnosed with non-colon gastrointestinal cancers (1.48; p = 0.0013) had a significantly higher risk for a CINV event, while urinary tract (0.46; p < 0.0001), gynecological cancers (0.91; p < 0.0001), and breast cancer (0.86; p < 0.0001) had a significantly lower risk. Other risk factors included change in CT emetogenicity in the study follow-up period (1.39; p = 0.0008) and average cycle length (1.21; p < 0.0001). CT cycles with antiemetic prophylaxis were found to have a higher risk of a CINV event versus cycles with no prophylaxis (1.40; p < 0.0001) (). This might be potentially due to the fact that a higher percent of events among the prophylaxis cycles were classified as routine/elective and having more regular follow-up visits to the hospital than visits for serious events that necessitate a longer inpatient stay as seen in .
Table 3. Multivariate regression model: predicting the CINV event rate.
CINV-associated resource utilization and associated all-cause cost
In the follow-up period, a total of 47,988 CINV events with an associated total all-cause treatment cost of $89,000,996.4 (average cost per day: $1854.7) was observed (). The number of CINV events treated in an inpatient setting totaled 13,225 with an associated total cost of $32,027,987.1 (average cost per day: $2421.8), while the number of patients treated in the ER setting totaled 15,306 with an associated total cost of $30,415,735.0 (average cost per day: $1987.2). A higher number of CINV events (19,457) were observed in the hospital outpatient setting, with an associated total treatment cost of $26,557,274.3 (average cost per day: $1364.9). Average daily treatment cost for all care settings was $1854.7 ()
Table 4. Total direct costs associated with CINV events*.
Among CT cycles with antiemetic prophylaxis period versus cycles with no antiemetic prophylaxis, the prophylaxis cycles showed 11,468 events in the inpatient setting with an associated total cost of $27,238,706.1 (averaging approximately 9.3 days in the inpatient setting) as compared to 1757 events amounting to $4,789,281.0 (averaging approximately 9.7 days in the inpatient setting) for the non-prophylaxis cycles. The average cost per day for the prophylaxis cycles was significantly lower versus that of the non-prophylaxis cycles ($2375.2 vs. 2725.8; p = 0.0003) (). Similarly, the prophylaxis cycles showed 17,872 events in the outpatient setting with an associated total cost of $23,997,795.3 compared with 1,585 events amounting to $2,559,479.0 for the non-prophylaxis cycles. The average cost per day for the prophylaxis cycles was also significantly lower versus that of the non-prophylaxis cycles ($1342.8 vs. 1614.8; p = 0.0001) (). Additionally, the prophylaxis cycles showed 13,559 events in the ER setting with an associated total cost of $26,581,974.2 compared with 1747 events amounting to $3,833,760.8 for the non-prophylaxis cycles. There was no statistically significant difference in the average cost per day for the prophylaxis cycles versus that of the non-prophylaxis cycles ($1960.5 vs. 2194.5; p = 0.2383) ().
Discussion
In this retrospective, longitudinal, hospital outpatient study, CINV was found to be a significant clinical and economic burden among patients with cancer initiating CT in a hospital outpatient setting. There was a predicted CINV rate of 20% in the study follow-up period from the index date with an associated total all-cause treatment cost of $89,000,996.4 (average cost per day: $1854.7). Despite the fact that approximately 75% of the study patients received some form of antiemetic prophylaxis on the day of CT, the study findings can be attributed to two factors: (1) a high percent of patients who did not receive antiemetic prophylaxis for the entire study follow-up period and (2) the potential for inappropriate/suboptimal antiemetic prophylaxis among the patients who received prophylaxis. The most significant observation from this study was the high percent (23.4%) of study patients who were not provided antiemetic prophylaxis for the entire follow-up period. Even though CINV is considered to be the most undesirable adverse event among CT treated patients, a considerable percent of patients in the present study did not get any form of antiemetic prophylaxis. Additionally, patients who receive some form of prophylaxis might not be receiving the appropriate medications per national guidelines. Even though the present study did not determine the appropriateness of antiemetic prophylaxis among patients who received prophylaxis, it seems that an undesirably high percent of patients get no prophylaxis that might be considered sub-optimal. In a study determining the prevalence of sub-standard antiemetic therapy among published trials involving patients receiving some form of emetogenic CT (from January2000 to July 2004), it was estimated that the percent of patients receiving sub-standard antiemetic prophylaxis was 30.0% for acute CINV and 33.0% for delayed CINVCitation18. It seems that inappropriate antiemetic prophylaxis would occur more in patients receiving LEC or MinEC, as observed in an Italian studyCitation19. In this study, it was estimated that patients with cancer receiving low or minimal emetogenic CT receive over treatment with antiemetics (89.1% for preventing acute emesis and 15.4% for prevent delayed emesis). According to Aapro M, there is a prevalent underuse of 5-HT3 receptor antagonists in patients receiving both radiotherapy and CT and some commonly used doses might be considered sub-optimalCitation20. Considering the fact that providing no antiemetic prophylaxis especially to patients receiving higher emetogenic CT can be assumed to be inappropriate or sub-standard, the present study findings almost mirror the findings by Holdsworth MTCitation18.
Less attention has been given to the total cost of CINV events and the administration of antiemetic prophylaxis in a hospital outpatient setting. Some of the published data are international studies examining indirect and direct costs associated with CINV; however, it is difficult to compare these data for the healthcare systems in these countries are different than the US healthcare systemCitation10–12,Citation14,Citation15. Burke and associates (2010) performed a retrospective cohort study of 19,139 patients who received their first HEC or MEC and at least one antiemetic agent from 2003 to 2007 at US hospital-based outpatient facilities. They found that CINV visits are frequent and costly, with mean cost of outpatient visits at $1494 per day. In this study CINV-related costs for ER visits were $576 more than outpatient visits and CINV-associated costs for inpatient visits were $5955 more than outpatient hospital visitsCitation9. Additionally, Tina Shih and colleagues (2007) performed a retrospective database study of indirect and direct costs due to CINV in US patients who were treated from 1997 to 2002 on HEC or MECCitation13. They found that the total costs of patients with uncontrolled CINV, defined as at least one office visit, ER visit, inpatient visit with ICD-9 codes for nausea and/or vomiting or dehydration, were on average $1383 higher per month than patients with controlled CINV. The costs associated with managing an uncontrolled CINV event was however much higher, $10,720 per month. This incremental cost was obtained after excluding CT related costs and other CT adverse event-related costs including neutropenia and use of granulocyte colony stimulating factorCitation13. The present study presents a higher average cost estimate per day ($1854.7) because all CINV related costs upon admission were included in the analysis. Another study by Haiderali and associates (2010) reported total costs due to CINV were approximately $780 on average per patient from the day of CT administration through 5 days following the first CT cycleCitation5. In the present study, outpatient visits related to a CINV event were the most frequent type of visit and the least costly. Inpatient and ER costs were $1056.9 and $622.3 more per day than outpatient visits ($1364.9). Chemotherapy cycles with no prophylaxis in the entire study follow-up period had a higher rate of emergent and urgent visits combined than cycles with prophylaxis (55.4 vs. 49.7%; p < 0.0001). The regression model () predicts an increased CINV event rate per CT cycle among CT cycles that received prophylaxis in the study follow-up period versus cycles that did not. However, this increased CINV rate was found to be for routine/elective hospital visits that are for regular follow-up visits rather than for the more expensive emergent/urgent visits that potentially require an inpatient stay and thus incur more resource spending. The differences in visits may be attributed to the severity of the event, hence, needing re-hospitalization among non-prophylaxis patients. This is reflected in the present study findings that show the increase in CINV event rate for the prophylaxis group did not reflect in a higher average cost per day ($1814.0 vs. $2197.4), highlighting the fact that the incremental CINV events were of less severity and thus were less expensive to manage. The increased number of emergent/urgent visits in the non-prophylaxis group may be also reflective of the absence of antiemetic prophylaxis throughout the follow-up period.
Apart from other key risk factors for CINV including age, gender, and CT emetogenicity, the present study also established the associations between occurrence of a CINV event in the first CT cycle (4.41; p < 0.0001), number of CT cycles (1.42; p < 0.0001), patients of African American and Hispanic descent (versus White patients) (1.36; p = 0.0056 and 1.39; p = 0.0379), and patients who were diagnosed with non-colon gastrointestinal cancers (versus patients with lung cancer) (1.48; p = 0.0013) and CINV risk. Many of these factors are supportive of the findings from the literatureCitation2,Citation3,Citation21,Citation22. Most patients receiving CT experience a CINV event during the first cycle of CT treatment. The NCCN Antiemesis Panel established that the goal of antiemetic therapy is to prevent CINV throughout the entire period of emetic riskCitation8. Another suggested treatment goal is the prevention of CINV following the first cycle of CT, hence, lessening the risk of CINV events during additional CT cyclesCitation23–25. In the present study, of the 11,495 study patients, 84.6% (n = 9725) received some sort of antiemetic prophylaxis during CT cycle 1. Despite the fact that a high percent of patients received antiemetic prophylaxis in CT cycle 1, the present study findings suggest that CINV still remains a serious problem for patients with cancer who receive CT, confirming results from other prospective observational studiesCitation2,Citation3,Citation5,Citation14,Citation21. Preventing a CINV event in the first CT cycle by providing the best antiemetic prophylaxis would be potentially beneficial in reducing the risk of subsequent events as has been observed in other studiesCitation3,Citation24–26. The current data also suggest that patients of African-American and Hispanic descent experience an increased CINV event rate (relative to baseline) in comparison to White patients. A higher percent of African Americans received antiemetic prophylaxis for the entire study duration versus those who did not (12.5 vs. 10.3%). Less Hispanic patients, however, received prophylaxis for the entire study period (4.4 vs. 5.2%) versus those who did not. Although not much data exist in the literature showing racial differences in the incidence of CINV events, there are many studies that have shown differences in outcomes among various types of cancer patients with African-Americans at a higher risk for certain cancers including breast, prostate, colorectal, and lungCitation22,Citation27–29. More research on the associations of antiemetic prophylaxis and CINV risk among these subpopulations with cancer risk should be conducted to provide stronger conclusions.
Considering that preventing a CINV event in the first CT cycle has been shown to prevent subsequent CINV events, it would be meaningful to initiate antiemetic prophylaxis with the most efficacious drugs available per CT emetogenic risk. It is well known that 5-HT3 antagonists have shown to be safe and effective for the prevention of CINV. Most 5-HT3 antagonists (ondansetron, dolasetron, granisetron) are indicated for the prevention of acute CINVCitation30–32; however, one of the newer 5-HT3 antagonists, palonosetron is also approved for the prevention of delayed CINVCitation33. A recent study by Yeh and associates (2010) reported the occurrence of CINV-related hospital readmissions, emergency department visits, and outpatient visits within 7 days after cisplatin administration and administration of ondansetron and palonosetron for the control of CINV events. After limiting to CINV-related events, the researchers found no statistically significant difference in CINV-related hospitalizations (though numerically higher) with ondansetron versus palonosetron (5.1 vs. 0%; p = 0.09)Citation34. Another study used electronic medical record database and billing records to retrospectively compare patients on CT initiating palonosetron versus ondansetron on the incidence of severe CINV events and the impact of these events on community practice costsCitation35. The authors found that the incidence of severe CINV events among patients initiating palonosetron was 76% lower in MEC patients and 54% lower in HEC patients versus those initiating ondansetron, thereby resulting with an estimated reduction in staff management time of approximately 4 work monthsCitation35. An earlier study using the same definitions of severe or extreme CINV events as in the Feinberg study (2009) showed similar cost reductions in terms of community practice resource useCitation36. More concrete conclusions might be drawn after further research related to healthcare resource use and associated cost in patients administered various types of CT and antiemetic prophylaxis.
This study has certain limitations worth noting. First, although multivariate analyses were used to adjust for differences in demographic and clinical characteristics, no data were available on certain important variables including use of alcohol that may have altered our estimates. Also, the CINV costs were estimated on a descriptive basis without controlling for baseline differences in potential confounders. Physician costs were also excluded from the study analysis, thus the study estimates can be considered conservative. Additionally, as hospital costs were considered for the analysis, the economic burden of CINV estimated could be considered conservative as costs (paid by the payer) are generally lower than hospital charges. Second, although the database used in the present analysis contained a nationally representative sample, caution should be exercised in generalizing the results to individuals in other populations or geographic regions, as potentially confounding differences in treatment patterns may have been unobserved or missed. The dataset used (Premier Perspective Database) restricted resource use to hospitals within the Premier system, and thus, could have led to an underestimation of the incidence of CINV events and associated costs. Also, this dataset might capture a possibly higher rate of hospitalizations/ER visits related to CINV events as compared to other datasets that capture all the office-based events, thereby introducing a bias. In addition, the study did not capture the costs of prescriptions filled at non-hospital pharmacies including orally administered drugs that could have led to an underestimation of the overall direct costs. Third, there was no appropriate control group identified and analyzed in the present study. The overall objective was to estimate the clinical and economic burden of CINV among patients with cancer receiving CT treatment initiated in a hospital outpatient setting. However, the overall population in terms of patients who received prophylaxis throughout the study follow-up period was analyzed versus those who did not. The present study demonstrates the economic burden of managing CINV events and also provides incremental cost estimates of patients not receiving antiemetic prophylaxis in all cycles in the follow-up period. Providing appropriate antiemetic prophylaxis to patients receiving CT must be given priority. Antiemetic medications were classified as prophylaxis (if given of day of CT) or rescue medications if provided after 24 hours post CT initiation till end of cycle. This might have potentially misclassified these medications as rescue medications even though they might have been prescribed as multi-day prophylaxis for multi-day CT. Fourth, clinical and economic consequences of CINV were estimated on a cycle level in the present study. The end of one CT cycle in the present study was until a day before the start of next CT administration (if the gap was >7 days). As with clinical studies, the follow-up time for identifying CINV events and associated costs within a cycle was not limited to the first 5 days following CT administration, similar to the reality that patients can experience CINV for a longer time after CT administration. (Molassiotis A. 2008) Finally, the present study findings pertain to observations from real-world practice rather than from a clinical trial. Although the retrospective nature of the study limits the ability to draw conclusions regarding cause and effect, the study findings draw attention to important relationships whose causal and intermediary factors warrant further exploration. There may be some selection bias as a result of the observational nature of the study.
Conclusions
The clinical and economic burden of CINV is substantial. In this retrospective hospital database analysis, a 20% predicted rate of CINV events per CT cycle across the follow-up period was observed after controlling for various demographic and clinical confounders including CT emetogenicity, and with an associated total all-cause treatment cost of approximately US $89 million (with an average cost per day of $1854.7). The study findings demonstrate the need for appropriate and efficient prophylactic CINV management thereby having the potential of reducing the use of costly healthcare resources and more importantly improving the quality of life of the patient on CT treatment. Apart from other known risk factors, preventing or controlling the onset of CINV in the first CT cycle appeared to lead to fewer events in subsequent cycles. Further research on the impact of early and appropriate CINV prophylaxis on clinical and economic outcomes and impact on CT adherence and overall mortality is warranted.
Transparency
Declaration of financial/other relationships
C.C. is an employee of Premier, Inc, which received funding to conduct the study.
J.G. is an employee of Premier, Inc, which received funding to conduct the study.
S.B. is an employee of the Health Outcomes Department at Eisai, Inc.
D.B. is an employee of the Health Outcomes Department at Eisai, Inc.
This study was funded by a grant from Eisai, Inc.
Acknowledgments
Editorial support for the preparation of this manuscript was provided by Michelle A. Adams of Write All, Inc.
This article was previously presented as: Balu S, Craver C, Gayle J, Buchner D. Clinical and economic burden of chemotherapy induced nausea and vomiting among patients with cancer in a hospital outpatient setting in the United States at the 2010 American Society of Health-System Pharmacists (ASHP) Mid-Year Clinical Meeting; December 5–9, 2010; Anaheim, CA, USA
References
- National Cancer Institute: US Institutes of Health. Myelodysplastic Syndromes Treatment (PDQ®): General Information about myelodysplastic syndromes. Available at: http://www.cancer.gov/cancertopics/pdq/supportivecare/nausea/HealthProfessional/allpages/ [Accessed August 16, 2010]
- Molassiotis A, Saunders MP, Valle J, A prospective observational study of chemotherapy-related nausea and vomiting in routine practice in a UK cancer centre. Support Care Cancer 2008;16:201-208
- Cohen L, de Moor CA, Eisenberg P, et al. Chemotherapy-induced nausea and vomiting: incidence and impact on patient quality of life at community oncology settings. Support Care Cancer 2007;15:497-503
- Berger AM, Clark-Snow, RA. Nausea and vomiting. In: De Vita VT, Hellman S, Rosenberg RA, eds. Cancer: Principles and Practice in Oncology, 6th edn. Philadelphia, PA: Lippincott Williams & Wilkins, 2001:2869-2880
- Haiderali A, Menditto L, Good M, et al. Impact on daily functioning and indirect/direct costs associated with chemotherapy-induced nausea and vomiting (CINV) in a US population. Support Care Cancer 2010. [Epub ahead of print]
- Kris MG, Hesketh PJ, Somerfield MR, et al. American Society of Clinical Oncology Guideline for Antiemetics in Oncology: Update 2006. J Clin Oncol 2006;24:2932-2947
- Gralla RJ, Roila F, Tonato M, Herstedt J; Antiemetic Subcommittee of the Multinational Association of Supportive Care in Cancer. MASCC/ESMO Antiemetic Guideline 2010. Available at: www.mascc.org [Accessed August 16, 2010]
- National Comprehensive Cancer Network (NCCN) Clinical Practice Guidelines in Oncology™: Antiemesis. Version 2.2010. http://www.nccn.org/professionals/physician_gls/f_guidelines.asp [Accessed August 16, 2010]
- Burke TA, Wisniewski T, Ernst FR. Resource utilization and costs associated with chemotherapy-induced nausea and vomiting (CINV) following highly or moderately emetogenic chemotherapy administered in the US outpatient hospital setting. Support Care Cancer 2010. doi: 10.1007/s00520-009-0797-x
- Ihbe-Heffinger A, Ehlken B, Bernard R, et al. The impact of delayed chemotherapy-induced nausea and vomiting on patients, health resource utilization and costs in German cancer centers. Ann Oncol 2004;15:526-536
- Annemans L, Strens D, Lox E, et al. Cost-effectiveness analysis of aprepitant in the prevention of chemotherapy-induced nausea and vomiting in Belgium. Support Care Cancer 2008;16:905-915
- Ballatori E, Roila F, Ruggeri B, et al. The cost of chemotherapy-induced nausea and vomiting in Italy. Support Care Cancer 2007;15:31-38
- Tina Shih YC, Xu Y, Elting LS. Costs of uncontrolled chemotherapy-induced nausea and vomiting among working-age cancer patients receiving highly or moderately emetogenic chemotherapy. Cancer 2007;110:678-685
- Lachaine J, Yelle L, Kaizer L, et al. Chemotherapy-induced emesis: quality of life and economic impact in the context of current practice in Canada. Support Cancer Ther 2005;2:181-187
- Stewart DJ, Dahrouge S, Coyle D, et al. Costs of treating and preventing nausea and vomiting in patients receiving chemotherapy. J Clin Oncol 1999;17:344-351
- Weiner MG, Livshits A, Carozzoni C, et al. Derivation of malignancy status from ICD-9 codes. American Medical Informatics Association 2003 Symposium Proceedings: 1050
- Charlson ME, Pompei P, Ales KL, et al. A new method of classifying prognostic comorbidity in longitudinal studies: development and validation. J Chronic Dis 1987;40:373-383
- Holdsworth MT. Employment of substandard antiemetic prophylaxis in recent trials of chemotherapy-induced nausea and vomiting. Ann Pharmacother 2005;39:1903-10
- Italian Group for Antiemetic Research. Transferability of clinical practice of the clinical results of controlled clinical trials: the case of antiemetic prophylactic treatment for cancer chemotherapy-induced nausea and vomiting. Ann Oncol 1998;9:759-765
- Aapro M. Optimising antiemetic therapy: what are the problems and how can they be overcome? Curr Med Res Opin 2005;21:885-897
- Booth CM, Clemons M, Dranitsaris G, et al. Chemotherapy-induced nausea and vomiting in breast cancer patients: a prospective observational study. J Support Oncol 2007;5:374-380
- Ghafoor A, Jemal A, Ward E, et al. Trends in breast cancer by race and ethnicity. CA Cancer J Clin 2003;53:342-355
- Kris M. Why do we need another antiemetic? Just ask. J Clin Oncol 2003;21:4077-4080
- Feinberg B, Gilmore J, Haislip S, et al. Likelihood of a subsequent chemotherapy induced nausea and vomiting (CINV) event in patients receiving low emetogenic chemotherapy (LEC). Presented at the 2010 International Cancer Education Conference, October 25-27, 2010; San Diego, CA
- Feinberg B, Gilmore J, Haislip S, et al. Likelihood of a subsequent chemotherapy induced nausea and vomiting (CINV) event in patients receiving moderately or highly emetogenic chemotherapy (MEC/HEC).Presented at the 2010 ISPOR European Congress, November 6-9, 2010; Prague, Czech Republic
- Petrella T, Clemons M, Joy A, et al. Identifying patients at high risk for nausea and vomiting after chemotherapy: the development of a practical validated prediction tool. J Support Oncol 2009;7:W9-16
- Peters N, Armstrong K. Racial differences in prostate cancer treatment outcomes: a systematic review. Cancer Nurs 2005;28:108-118
- Marcella S, Miller JE. Racial differences in colorectal cancer mortality. The importance of stage and socioeconomic status. J Clin Epidemiol 2001;54:359-366
- Gadgeel SM, Kalemkerian GP. Racial differences in lung cancer. Cancer Metastasis Rev 2003;22:39-46
- Zofran® Injection (ondansetron hydrochloride) [prescribing information]. Research Triangle Park, NC: GlaxoSmithKline; May 2010
- Anzemet® Tablets (dolasetron mesylate) [prescribing information]. Bridgewater, NJ: Sanofi-Aventis US LLC; October 2009
- Kytril® Injection (granisetron hydrochloride) [prescribing information]. Nutley, NJ: Roche Laboratories Inc; October 2009
- Aloxi® Injection (palonosetron hydrochloride) [prescribing information]. Bloomington, MN: MGI Pharma Inc; August 2007
- Yeh YC, McDonnell A, Klinger E, et al. Comparison of healthcare resource use between patients receiving ondansetron or palonosetron as prophylaxis for chemotherapy-induced nausea and vomiting. J Oncol Pharm Pract 2010. doi: 10.1177/1078155210366491
- Feinberg BA, Gilmore J, Haislip S, et al. Data-driven medical decision-making in managing chemotherapy-induced nausea and vomiting. Commun Oncol 2009;6:62-67
- Vanscoy GJ, Fortner B, Smith R, et al. Preventing chemotherapy-induced nausea and vomiting: the economic implications of choosing antiemetics. Community Oncol 2005;2:127-132