Abstract
Objective:
To determine how patient-rated osteoarthritis (OA) severity correlates with other patient-reported and clinical outcomes in the European clinical setting.
Methods:
We used the Adelphi Arthritis VII (2008) Disease Specific Program (DSP). OA severity was patient-rated using the question ‘How bad would you say your arthritis is now?’ with responses of ‘mild,’ ‘moderate,’ and ‘severe.’ Patient-reported outcomes included a 0–100 mm pain visual analogue scale (VAS); questions on daily functioning; Work Productivity and Activity Impairment (WPAI) scale; and EuroQoL (EQ-5D). Regression models and chi-square analyses evaluated relationships between self-rated OA severity and other outcomes.
Results:
Patient-reported data were available from 1739 individuals (63.1% female, mean age 64.4 [standard deviation 11.9] years) from France, Germany, Italy, Spain, and the UK. With increasing OA severity; mild (24.5%), moderate (56.3%), severe (19.2%), statistically significant differences (p < 0.05) were observed with higher pain VAS scores (28.3, 49.9, 69.2, respectively), reduced function, and greater overall work impairment due to OA (24.3%, 38.5%, 68.6%, respectively). Significant associations of patient-reported OA severity with function and health status were indicated, including the EQ-5D health state index; 0.77 (mild), 0.62 (moderate), 0.30 (severe) (p < 0.0001). Physicians tended to overestimate patients who rated their OA as mild, and underrate patients who rated their OA as severe.
Conclusions:
In five European countries, patient-rated OA severity was associated with other patient-reported outcomes, and may be of benefit in the clinical setting when choosing treatment options aimed at improving pain, function and productivity, providing an accurate and tangible assessment of patient’s perceptions of their disease.
Introduction
Pain, stiffness, fatigue, and functional impairment are primary complaints of patients with osteoarthritis (OA), and result in substantial disability and reduced quality of life (QOL)Citation1,Citation2. However, patients’ perceptions of these symptoms, and consequently patients’ therapeutic needs, may not necessarily correlate with clinicopathologic findings. As suggested in a study by Johnson et al.Citation3, self-reported changes in pain and function were not associated with clinical changes including range of motion, disease activity, and radiographic grade. While Bijsterbosch et al.Citation4 also observed a lack of relationship between clinical changes and radiographic progression, two other studies reported that joint space narrowing significantly correlated with symptom severityCitation5 and physical performanceCitation6.
The above disparate results, including the apparent discrepancy between the patient’s perspective and the clinical pathology impede characterization of OA severity, which is important for making decisions regarding management strategies including pharmacotherapy. In the absence of a clearly defined etiology and disease-modifying drugs, recommendations for management of OA have consistently focused on reducing pain and improving functionCitation7–11. Pharmacologic therapies for managing OA-related pain include simple analgesics, nonsteroidal anti-inflammatory drugs (NSAIDs), oral corticosteroids, opioids, and injectables such as corticosteroids and viscosupplementation with hyaluronan. Although the data supporting the therapeutic use of glucosamine and/or chondroitin sulfate is heterogeneous, there is evidence that some benefits may be obtainedCitation12. While simple analgesics and NSAIDs are generally recommended as first-line pharmacologic therapyCitation7–11, in clinical practice, choosing among the various medications is often determined by disease severity.
Definitions of OA severity were suggested based on cut-points for patient-reported painCitation13,Citation14. However, in real-world settings, categorizing mild, moderate, or severe disease based solely on pain cut-points may be neither comprehensive nor relevant from the patient’s perspective. Other factors such as functional impairment and productivityCitation15,Citation16 likely contribute to a patient’s overall perception of their OA severity.
The ability to characterize OA severity and its associated manifestations from the patient’s perspective may provide a context within which management strategies may be determined and therapeutic outcomes evaluated. Nevertheless, there have been limited attempts to characterize OA severity using patient-reported measures, and while some have been specific to orthopedic proceduresCitation17–19, others lack the ability to measure patients’ expectations on a full complement of disabilitiesCitation20–22.
A simple approach to establishing OA severity with applicability to the real-world clinical setting is for patients to self-rate their severity. However, asking a single question on severity needs to be supported by ascertaining whether such assessment correlates with (or manifests via) other patient-reported outcomes that are interpretable, useful, and quantifiable. Support for this type of assessment was suggested by a study in the US showing patient-rated OA severity was significantly associated with patient-reported pain, function, and productivity, with the latter having a substantial impact on indirect costs; indirect costs increased at greater levels of patient-rated OA severityCitation23. The objective of this study was to determine whether associations between patient-rated OA severity (mild, moderate, and severe) and other self-reported outcomes relevant from the patient’s perspective, including lost productivity and associated indirect costs, can be corroborated in the European clinical setting. Additionally, physician-reported OA severity and clinical observations relevant to the underlying disease process (i.e., joint space narrowing and joint deformity) were evaluated in relation to patient-rated OA severity.
Methods
Dataset
The Adelphi Disease Specific Program (DSP) is a cross sectional, observational study of consulting patients including data from physicians and patients for specific chronic diseasesCitation24. Data are collected in clinical practice settings by physicians who provide relevant information on consecutively consulting patients for the disease of interest. Patients are invited to participate by completing questionnaires on symptoms, expectations, and QOL. The current analysis is based on the DSP Arthritis VII (2008), focusing on patients with a confirmed diagnosis of OA including data for subjects from France, Germany, Italy, Spain and the UK from physician practices in primary care (33%%), rheumatology (54%), and orthopedics (13%).
Measures of interest
OA severity was rated by patients based on the question ‘How bad would you say your arthritis is now?’ with responses of ‘mild,’ ‘moderate,’ and ‘severe.’ In addition to demographic characteristics, outcomes data were elicited through a series of questions and measures including a pain visual analogue scale (VAS; 0–100 mm with 0 = no pain and 100 = worst possible pain) to estimate OA-related pain during the past week, and questions on practical daily functioning that included items on ability to perform both basic and instrumental activities of daily living (ADL) during the past week. These questions were adapted from Lawton and BrodyCitation25 and scored on a 4-point Likert scale (1 = no difficulty, 2 = some difficulty, 3 = much difficulty, 4 = unable to do).
Also included was the EuroQoL (EQ-5D), a generic patient self-reported measure of health statusCitation26,Citation27. The EQ-5D has been applied to a wide range of health conditions and treatments, providing a simple descriptive profile and single index value for determining health status. With ‘today’ as the reference period, the EQ-5D consists of five dimensions (mobility, self-care, usual activities, pain/discomfort, anxiety/depression), each rated on a 3-point scale (1 = no problem, 2 = some problem, 3 = unable to perform/extreme problem) and a health-state thermometer based on a visual analogue scale (VAS) from 0 (worst imaginable) to 100 (best imaginable). Health state utility values (−0.109 to 1.0, 0.0 = death and 1.0 = perfect health)Citation28, were calculated based on published UK preferencesCitation29.
Productivity was captured using the Work Productivity and Activity Impairment scale (WPAI)Citation30. The first question is on employment status, and the remaining five, referenced to the past 7 days, pertain to hours worked; hours missed from work because of OA; impact of OA on productivity (rating scale from 0 = no effect to 10 = completely prevented from working); and degree OA affected regular activities (rating scale 0 = no effect to 10 = completely prevented daily activities). Responses to the questions were used to calculate absenteeism (percent work time missed due to OA), presenteeism (percent impairment on the job due to OA), percent overall work impairment due to OA; and percent activity impairment due to OA. These percentages were then used to estimate the annual costs of lost productivity in US dollars based on average annual wages estimated by the World Bank for the year 2008Citation31.
Physician-reported data included a rating of patient’s OA severity (1 = mild, 2 = moderate, 3 = severe). Physician and patient ratings of OA were obtained independently. Other physician-reported data included the status of radiologic changes such as loss of joint space, based on the physician’s clinical opinion and recorded on a 4-point scale (improving, stable, slowly deteriorating, and rapidly deteriorating) and level of joint deformity for knees or hips judged by the physician on a 3-point scale (1 = mild, 2 = moderate, 3 = severe). Overall OA disease was dichotomized as stable or improving versus unstable or deteriorating.
Statistical analysis
Descriptive analyses using means, counts, and proportions were conducted on demographic and clinical variables. Multiple linear regression models (controlled for age, gender, and country) with patient-reported severity of OA as the predictor were fit to obtain mean values separately for each of several outcomes taken as continuous responses (aspects of functional ability, productivity, EQ-5D, and physician-reported severity of OA). From these models, pair-wise comparisons on mean differences in outcome (tested with a t-test for the difference in adjusted least square means) were obtained between each of the three pairs of categories on patient-reported OA severity levels.
Pearson chi-square tests were performed on contingency tables to evaluate the relationships between self-reported OA severity and other self-reported outcomes in order to quantify and construe their association with OA severity levels. Moreover, kappa and weighted kappa statistics were reported to obtain the level of agreement (beyond chance) between patient-reported severity of OA and physician-reported severity of OA. Ninety-five percent confidence intervals for means and kappa were reported. All analyses were pre-specified and performed using SAS version 9.2 (SAS Institute Inc., Cary, NC, USA). Evidence for statistical significance was based on a p-value less than 0.05.
Results
Of 1812 subjects in the database, patient-reported data were available from 1739 individuals (96.0%): France (n = 267), Germany (n = 517), Italy (n = 262), Spain (n = 509), and the UK (n = 257). As shown in , which presents the demographic characteristics of the population, individuals were predominantly female (63.1%), mean age was 64.4 (standard deviation [SD] 11.9) years. Only 25.9% of subjects reported they were currently employed; 51.2% were retired. Mean time since first OA diagnosis was 5.0 (SD 5.6) years.
Table 1. Demographic characteristics of the population evaluated in the European osteoarthritis Disease Specific Program (N = 1739).
The proportion of patients who rated their OA severity as mild, moderate and severe was 24.5% (n = 426), 56.4% (n = 980), and 19.2% (n = 333), respectively. After adjusting for age, gender and country, there was a clear and significant association observed between patient-rated and physician-rated severity of OA (p < 0.001). However, when analyzed using a 3-by-3 contingency table (), ratings showed discrepancies in agreement (kappa = 0.50, 95% confidence interval [CI] = 0.46–0.54; weighted kappa = 0.61, 95% CI = 0.57–0.64) with physicians overestimating mild severity and underestimating severe OA compared with patient-ratings.
Table 2. Physician-reported versus patient-reported osteoarthritis severity; 1 = mild, 2 = moderate, 3 = severe (weighted kappa coefficient = 0.61; 95% confidence interval = 0.57–0.64).
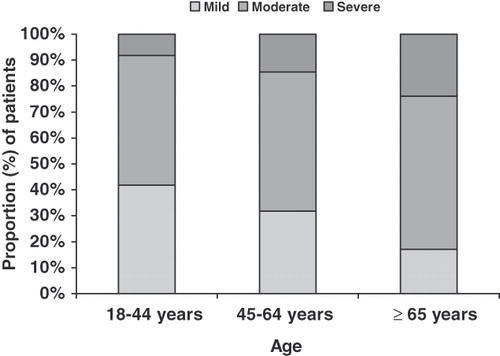
With increasing age, higher proportions of patients reported OA of greater severity (). Pain severity was significantly associated with patient-rated OA severity after adjusting for age, gender and country; as OA severity increased, pain severity increased, from 28.3 (95% CI 26.5–30.1) for mild OA, to 49.9 (95% CI 48.7–51.1) for moderate OA and 69.2 (95% CI 67.0–71.1) for severe OA (p < 0.0001 for each pair-wise comparison).
Figure 1. Relationship between self-reported osteoarthritis severity and age.
Functional impairment increased with increasing patient-reported OA severity, as indicated by greater difficulty in performing activities of daily living (). After adjustment for age, gender and country, the difficulty score remained >1 at each OA severity level for all functional ability items (lower bounds of 95% CI were >1), with the greatest difficulty observed among patients who reported severe OA. Pair-wise comparisons between each pair of patient-reported OA severity levels (mild vs. moderate, mild vs. severe, moderate vs. severe) showed that differences in functional abilities were statistically significant (p < 0.05).
Table 3. Relationship between self-reported osteoarthritis (OA) severity and functional ability to perform activities of daily living.
Significantly fewer patients reported being employed with increasing levels of OA severity; 40.1%, 22.9%, and 9.9% for mild, moderate, and severe, respectively (p < 0.0001). Higher proportions of unemployed patients reported moderate (57.5%) and severe (23.2%) OA relative to those employed (52.2% and 7.8%, respectively).
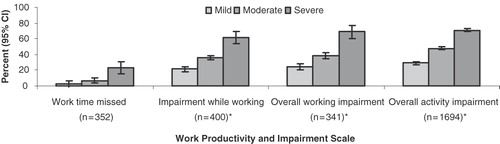
Among employed patients, the percent of OA-related impairment of work and activity increased at greater OA severity levels (). All pair-wise comparisons, adjusted for age, gender and country, showed significant differences (p < 0.05) in work impairment between OA severity levels except for percent work time missed due to OA between mild and moderate OA (p = 0.07). Work impairment resulted in overall lost productivity costs of $13,149 per patient per year. Adjusting for age, gender and country, lost productivity costs were significantly higher with increasing levels of patient-reported OA severity; $9220 for mild, $14,861 for moderate, and $27,208 for severe OA (p < 0.0001 for all pair-wise comparisons).
Figure 2. Relationship between patient-rated osteoarthritis severity and patient-reported productivity. Evaluation of productivity based on the Work Productivity and Activity Impairment (WPAI) questionnaireCitation30. CI, confidence interval. Values of means of percent impairment were adjusted for age, gender and country. *p < 0.05 for pair-wise comparisons between severity levels.
Patient-reported increases in OA severity were associated with increasing problems on all five dimensions of the EQ-5D (after adjustment for age, gender and country) (). Differences between all three pair-wise comparisons on patient-reported OA severity (mild vs. moderate, mild vs. severe, moderate vs. severe) were statistically significant (p < 0.0001). Patient-reported health status decreased with increasing OA severity was observed on the EQ-5D health state thermometer (), as were significant decreases in EQ-5D health state utilities (). For both the VAS thermometer and utility values, all pair-wise comparisons on OA severity were statistically significant (p < 0.0001).
Figure 3. Relationship between patient-reported osteoarthritis (OA) severity and components of the EQ-5D including (A) the five dimensions of the EQ-5D; (B) the EQ-5D current health state thermometer (0–100 visual analogue scale [VAS]; and (C) the EQ-5D index based on the UK value set. Values are means, adjusted for age, gender and country, with 95% confidence intervals. All pair-wise comparisons on OA severity were statistically significant (p < 0.0001).
![Figure 3. Relationship between patient-reported osteoarthritis (OA) severity and components of the EQ-5D including (A) the five dimensions of the EQ-5D; (B) the EQ-5D current health state thermometer (0–100 visual analogue scale [VAS]; and (C) the EQ-5D index based on the UK value set. Values are means, adjusted for age, gender and country, with 95% confidence intervals. All pair-wise comparisons on OA severity were statistically significant (p < 0.0001).](/cms/asset/89973156-cf07-4388-8859-acfe15f6f45d/ijme_a_583703_f0003_b.jpg)
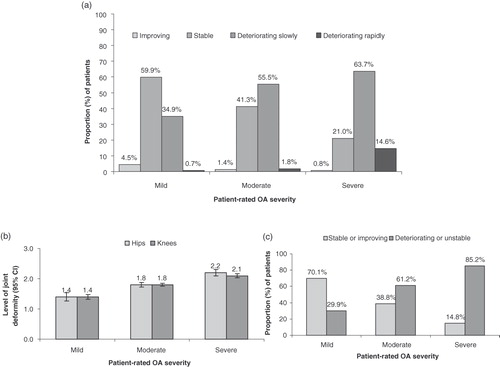
Patient-reported OA severity was significantly associated with clinical observations (), including deterioration in joint space with increased OA severity (p < 0.001), with rapid joint deterioration predominantly observed among patients who rated their OA severe (). Similarly, increased deformity in knees and hips was observed at greater OA severity levels () (p < 0.05 for all pair-wise comparisons), and disease progression was more pronounced in patients who reported greater OA severity () (p < 0.001 for overall association); 85% of severe OA patients were rated by their physician as having unstable or deteriorating OA compared with 30% of mild patients.
Figure 4. Relationship between patient-reported osteoarthritis (OA) severity and physician-reported clinical parameters of (A) radiologic deterioration in joint space (p < 0.001 for overall association) (B) joint deformity (mean levels; 1 = mild, 2 = moderate, 3 = severe; p < 0.05 for all pair-wise comparisons between severity levels, adjusted for age, gender and country) and (C) disease progression (p < 0.001 for overall association).
Discussion
The concept of defining disease severity from the patient’s perspective may be appropriate for daily clinical management of patients with OA by providing an assessment based on patients' needs and therapeutic goals. However, it’s important that this definition of disease severity correlate with other relevant outcomes from both the patient and clinical perspectives. Using the patient’s perspective, the results of this analysis showed that patient-rated OA severity correlated with other patient-reported outcomes in five European countries. These clinically relevant outcomes included pain, function, and health status, and demonstrated the economic impact on work productivity, with substantial productivity losses contributing to the economic burden of OACitation32–35.
At each level of OA severity, the corresponding magnitude of each outcome including pain, functional impairment, and productivity impairment, was significantly different from that reported for the other severity levels, with the greatest impact reported by patients who rated their OA as severe. The associations between OA severity and all aspects of the EQ-5D further suggest that greater OA severity is associated with increased health impairment and worsening function and QOL. Importantly, the difference between each pair of health index scores on the EQ-5D for patients with mild, moderate, and severe OA, exceeded the estimated clinically important difference of 0.05Citation29, suggesting clinical importance among severity levels.
These results are consistent in direction, magnitude, and significance with those in a US studyCitation23, supporting the basic premise of the clinical utility of patient-rated assessment of OA severity. While consistency is desirable, it should not be inferred that these results represent validation of a new measure. Taken together, these studies increase our ability to characterize OA and relate patient’s perceptions of severity to other measures of interest. It should be noted that the cross-sectional nature of DSPs precludes causation. Since no cause and effect imputation can be made, the observed relationships should be considered associative rather than causal.
Pain and function are core symptomatic outcomes of OA that are frequently targeted as part of pharmacologic therapy, and thus their observed associations with patient perceptions of OA severity are not unexpected. However, it is of particular interest to note that lost productivity was also associated with OA severity in a manner similar to the other outcomes. Such associations among pain, function, and economic productivity in patients with OA have previously been suggestedCitation16. Additionally, in a European pain burden of illness, study, the general observation was made that moderate and severe pain has a dominant, independent and negative association with employment status and productivity, including both absenteeism and presenteeismCitation36. In the current study, effects on productivity paralleled those on pain and function, and pair-wise comparisons between patient-rated OA severity levels demonstrated statistical significance for most items on the WPAI.
Another important finding is that our data not only support lost productivity as an important contributory factor to the economic burden of OACitation23,Citation32–35,Citation37, but also provide an estimate of costs. Although mean annual indirect costs related to lost productivity due to OA were estimated at $13,148, these costs were significantly higher at greater OA severity; the annual cost for a patient with severe was OA approximately three times that of a patient with mild OA. These costs are substantially higher than those reported in a US studyCitation23, and likely reflect differences in pay scales and disability compensation. These results suggest that patients’ perceptions of OA severity may facilitate assessment of economic outcomes.
Interestingly, not only was absenteeism associated with OA severity, but presenteeism accounted for a greater loss of productive time than absenteeism as indicated by a higher percent of impairment while working relative to work time missed.
In contrast to other commonly used clinical measures of OA such as the Western Ontario and McMaster Universities (WOMAC) Index of OsteoarthritisCitation38 and the Lequesne IndexCitation20, patients were asked to characterize their OA severity based on a single question, and their responses were then evaluated relative to other patient-reported measures. This is a semi-quantitative approach providing a patient-based perspective that demonstrates significant associations with other relevant patient-reported outcomes.
Although there was some agreement between patient- and physician-rated OA severity (weighted kappa = 0.61), there was a substantial disparity in rating, which included approximately half of the patients who rated themselves as severe being rated by the physicians as mild or moderate. This result is consistent with the general finding in other conditions that clinicians often report fewer problems than patients, underestimating the severity of problems, and/or overestimating QOLCitation39–44. Such an effect, where physicians underestimate the severity of a patient’s condition, can conceivably result in a proportion of patients not receiving appropriate treatment.
This disparity has several clinical implications, including factors contributing to severity may be differentially emphasized between patients and physicians, and there is a substantial proportion of patients who will not be appropriately managed; using patient ratings as the standard, physicians misclassified OA severity in 29% of patients. This discrepancy strongly argues for the importance of the patient’s perspective, and suggests that physicians need to work closely with patients to gain a comprehensive assessment.
Interpretation and extrapolation of these results are subject to study limitations. These limitations include participation based on agreement by physicians and patients. It is therefore possible that individuals who participated may have characteristics and perceptions different from those who refused to participate, thereby introducing selection bias and reducing generalizability. Recall bias when completing a questionnaire is another potential limitation, which was minimized using a maximum recall period of the past 7 days.
That the type of employment was not captured in the questionnaire may also be considered a limitation since it is likely to affect the absolute magnitude of productivity loss. While clinical observations reported here are restricted to knees and hips, the two most common sites of OA, the primary joint diagnosed with OA in these patients was not captured in the questionnaire and represents another limitation, since the OA site is likely to affect different activities of daily living and outcomes. These omissions warrant further evaluation in future studies, although the consistency of results between this study and the US study suggests the overall robustness of the findings in the OA population.
Another limitation is that we did not control for potential effects of comorbid conditions on the patient’s perception of OA disease severity. However, the consistency of results, including the narrow range of variance, suggests that these effects, when present, were likely comparable across patients and outcomes. With regard to the diagnosis of OA for inclusion, this diagnosis is dependent on the diagnostic skill of the treating physician, and it is therefore possible that misdiagnosis may have occurred in a small proportion of the sample population. While radiographic observations were included, it should be noted that the practicality of radiographic assessment for making clinical treatment decisions such as for knee replacement is unreliable and may be better determined by functional status and patient preferencesCitation45. Nevertheless, the associations between patient-rated severity and clinical observations were significant and help confirm the value of using patient-reported assessment.
While relationships accounted for the effects of age, gender and country, we did not examine the extent that relationship may have differed for the different European countries, different ages, and males versus females. Such an undertaking is beyond the scope of the current report and would be worthwhile in future research.
The lack of validation of the patient reported and physician-reported outcomes with other standard measures such as WOMAC may also limit the interpretation and generalizability of this study.
Despite these limitations, we suggest that the approach described here enables a rapid assessment of OA severity that may be of value in the clinical setting for providing an accurate, appropriate, and quantifiable measurement of the patient’s perceived disease, especially with respect to symptoms. This metric provides a practical comparison, utilizable across practice specialties (family practice, rheumatology, orthopedics, etc.), for providing a better understanding of how patients should perceive changes in their disease status. A more rigorous evaluation of this technique will also help integrate the patient’s perspective into an overall definition of OA severity.
Conclusions
The significant associations between self-reported OA severity and other patient-reported outcomes appear to indicate that asking patients to rate their OA is clinically relevant and provides a simple and direct approach for determining disease severity. This practical solution may be of potential benefit to health care providers when deciding among different management strategies to alleviate pain, improve patient function, and maintain or increase productivity. Further analyses of the observed relationships between patient-rated OA severity and other clinically relevant criteria are warranted to confirm the utility of this method for characterizing OA severity in clinical practice.
Declaration of interest
G.T.-S. and J.S. are employees of Adelphi, which was financially compensated for undertaking this analysis. A.S., J.C., A.B., D.C., and T.G., are employees of Pfizer, Inc. P.E. was involved in all stages of the project but was not financially compensated for his collaboration.
Transparency
Declaration of funding
This study was funded by Pfizer Inc.
Acknowledgments
Editorial support was provided by E. Jay Bienen, who was funded by Pfizer Inc.
References
- Salaffi F, Carotti M, Stancati A, et al. Health-related quality of life in older adults with symptomatic hip and knee osteoarthritis: a comparison with matched healthy controls. Aging Clin Exp Res 2005;17:255-263
- Jakobsson U, Hallberg IR. Quality of life among older adults with osteoarthritis: an explorative study. J Gerontol Nurs 2006;32:51-60
- Johnson SR, Archibald A, Davis AM, et al. Is self-reported improvement in osteoarthritis pain and disability reflected in objective measures? J Rheumatol 2007;34:159-64
- Bijsterbosch J, Watt I, Meulenbelt I, et al. Clinical and radiographic disease course of hand osteoarthritis and determinants of outcome after 6 years. Ann Rheum Dis 2011;70:68-73
- Fukui N, Yamane S, Ishida S, et al. Relationship between radiographic changes and symptoms or physical examination findings in subjects with symptomatic medial knee osteoarthritis: a three-year prospective study. BMC Musculoskelet Disord 2010;11:269
- McDaniel G, Renner JB, Sloane R, et al. Association of knee and ankle osteoarthritis with physical performance. Osteoarthritis Cartilage 2011;Feb 19 [Epub ahead of print]
- Zhang W, Moskowitz RW, Nuki G, et al. OARSI recommendations for the management of hip and knee osteoarthritis, Part II: OARSI evidence-based, expert consensus guidelines. Osteoarthritis Cartilage 2008;16:137-62
- Zhang W, Doherty M, Arden N, et al. EULAR evidence based recommendations for the management of hip osteoarthritis: report of a task force of the EULAR Standing Committee for International Clinical Studies Including Therapeutics (ESCISIT). Ann Rheum Dis 2005;64:669-81
- Jordan KM, Arden NK, Doherty M, et al. EULAR Recommendations 2003: an evidence based approach to the management of knee osteoarthritis: Report of a Task Force of the Standing Committee for International Clinical Studies Including Therapeutic Trials (ESCISIT). Ann Rheum Dis 2003;62:1145-55
- American College of Rheumatology. Recommendations for the medical management of osteoarthritis of the hip and knee: 2000 update. American College of Rheumatology Subcommittee on Osteoarthritis Guidelines. Arthritis Rheum 2000;43:1905-15
- American College of Rheumatology Ad Hoc Group on Use of Selective and Nonselective Nonsteroidal Antiinflammatory Drugs. Recommendations for use of selective and nonselective nonsteroidal antiinflammatory drugs: an American College of Rheumatology white paper. Arthritis Rheum 2008;59:1058-73. Erratum in: Arthritis Rheum. 2008;58:1686. Dosage error in article text
- Zhang W, Nuki G, Moskowitz RW, et al. OARSI recommendations for the management of hip and knee osteoarthritis: part III: changes in evidence following systematic cumulative update of research published through January 2009. Osteoarthritis Cartilage 2010;18:476-99
- Kapstad H, Hanestad BR, Langeland N, et al. Cutpoints for mild, moderate and severe pain in patients with osteoarthritis of the hip or knee ready for joint replacement surgery. BMC Musculoskelet Disord 2008;9:55
- Zelman DC, Hoffman DL, Seifeldin R, et al. Development of a metric for a day of manageable pain control: derivation of pain severity cut-points for low back pain and osteoarthritis. Pain 2003;106:35-42
- Ricci JA, Stewart WF, Chee E, et al. Pain exacerbation as a major source of lost productive time in US workers with arthritis. Arthritis Rheum 2005;53:673-81
- Hutchings A, Calloway M, Choy E, et al. The Longitudinal Examination of Arthritis Pain (LEAP) study: relationships between weekly fluctuations in patient-rated joint pain and other health outcomes. J Rheumatol 2007;34:2291-2300
- Diduch DR, Insall JN, Scott WN, et al. Total knee replacement in young, active patients. Long-term follow-up and functional outcome. J Bone Joint Surg Am 1997;79:575-82
- Liow RY, Walker K, Wajid MA, et al. The reliability of the American Knee Society Score. Acta Orthop Scand 2000;71:603-8
- Coleman B, McChesney S, Twaddle B. Does the priority scoring system for joint replacement really identify those in most need? N Z Med J 2005;118:U1463
- Lequesne MG, Mery C, Samson M, et al. Indexes of severity for osteoarthritis of the hip and knee. Validation – value in comparison with other assessment tests. Scand J Rheumatol Suppl 1987;65:85-9
- Lequesne M. The algofunctional indices for hip and knee osteoarthritis. J Rheumatol 1997;24:779-81
- Clark JA, Spiro A, 3rd, Fincke G, et al. Symptom severity of osteoarthritis of the knee: a patient-based measure developed in the veterans health study. J Gerontol A Biol Sci Med Sci 1998;53:M351-60
- Sadosky A, Bushmakin A, Cappelleri JC, et al. Relationship between patient-reported disease severity in osteoarthritis and self-reported pain, function, and work productivity. Arthritis Res Ther 2010;12:R162
- Anderson P, Benford M, Harris N, et al. Real-world physician and patient behaviour across countries: disease-specific programmes – a means to understand. Curr Med Res Opin 2008;24:3063-72
- Lawton MP, Brody EM. Assessment of older people: self-maintaining and instrumental activities of daily living. Gerontologist 1969;9:179-86
- The EuroQoL Group. EuroQoL – a new facility for the measurement of health-related quality of life. The EuroQoL Group. Health Policy 1990;16:199-208
- Brooks R. EuroQoL: the current state of play. Health Policy 1996;37:53-72
- Agency for Healthcare Research and Quality. Calculating the U.S. Population-based EQ-5D Index Score. Available at: http://www.ahrq.gov/rice/EQ5Dscore.htm. Accessed April 19, 2010
- Dolan P. Modeling valuations for EuroQoL health states. Med Care 1997;35:1095-108
- Reilly, Margaret C., Zbrozek, Arthur S., Dukes, Ellen M. The validity and reproducibility of a work productivity and activity impairment instrument. Pharmacoeconomics 1993;4:353-65
- The World Bank. Gross National Income per capita, Atlas method and PPP. World Development Indicators Database, World Bank, 15 September 2009
- Gabriel SE, Crowson CS, Campion ME, et al. Indirect and nonmedical costs among people with rheumatoid arthritis and osteoarthritis compared with nonarthritic controls. J Rheumatol 1997;24:43-8
- Rabenda V, Manette C, Lemmens R, et al. Direct and indirect costs attributable to osteoarthritis in active subjects. J Rheumatol 2006;33:1152-8
- Gupta S, Hawker GA, Laporte A, et al. The economic burden of disabling hip and knee osteoarthritis (OA) from the perspective of individuals living with this condition. Rheumatology (Oxford) 2005;44:1531-7
- White AG, Birnbaum HG, Janagap CC, et al. Direct and indirect costs of pain therapy for osteoarthritis in an insured population in the United States. J Occup Environ Med 2008;50:998-1005
- Langley P, Muller-Schwefe G, Nicolaou A, et al. The impact of pain on labor force participation, absenteeism and presenteeism in the European Union. J Med Econ 2010;13:662-72
- Maetzel A, Li LC, Pencharz J, et al. The economic burden associated with osteoarthritis, rheumatoid arthritis, and hypertension: a comparative study. Ann Rheum Dis 2004;63:395-401
- Bellamy N, Buchanan WW, Goldsmith CH, et al. Validation study of WOMAC: a health status instrument for measuring clinically important patient relevant outcomes to antirheumatic drug therapy in patients with osteoarthritis of the hip or knee. J Rheumatol 1988;15:1833-40
- Suarez-Almazor ME, Conner-Spady B, Kendall CJ, et al. Lack of congruence in the ratings of patients' health status by patients and their physicians. Med Decis Making 2001;21:113-21
- Mantyselka P, Kumpusalo E, Ahonen R, et al. Patients’ versus general practitioners' assessments of pain intensity in primary care patients with non-cancer pain. Br J Gen Pract 2001;51:995-7
- Petersen MA, Larsen H, Pedersen L, et al. Assessing health-related quality of life in palliative care: comparing patient and physician assessments. Eur J Cancer 2006;42:1159-66
- Yalcin I, Viktrup L. Comparison of physician and patient assessments of incontinence severity and improvement. Int Urogynecol J Pelvic Floor Dysfunct 2007;18:1291-5
- Srikrishna S, Robinson D, Cardozo L, et al. Is there a discrepancy between patient and physician quality of life assessment? Neurourol Urodyn 2009;28:179-82
- Leong KP, Chong EY, Kong KO, et al. Discordant assessment of lupus activity between patients and their physicians: the Singapore experience. Lupus 2010;19:100-6
- Katz JN. Total joint replacement in osteoarthritis. Best Pract Res Clin Rheumatol 2006;20:145-53