Abstract
Objectives:
Losartan will shortly become generic, and this may encourage switching to the generic drug. However, valsartan was shown in a meta-analysis to be statistically superior in lowering blood pressure (BP) to losartan. This paper examines the costs of treatment with these two drugs and the potential consequences of switching established valsartan patients to generic losartan.
Methods:
A US payer cost-effectiveness model was developed incorporating the risk of cardiovascular disease (CVD) events related to systolic blood pressure (SBP) control comparing valsartan to continual losartan and switching from valsartan to generic losartan. The model, based upon a meta-analysis by Nixon et al. and Framingham equations, included first CVD event costs calculated from US administrative data sets and utility values from published sources. The modeled outcomes were number of CVD events, costs and incremental cost per quality-adjusted life-year (QALY) and life-year (LY).
Results:
Fewer patients had fatal and non-fatal CVD events with valsartan therapy compared with continual losartan and with patients switched from valsartan to generic losartan. The base-case model results indicated that continued treatment with valsartan had an incremental cost-effectiveness ratio of $27,268 and $25,460 per life year gained, and $32,313 and $30,170 per QALY gained, relative to continual losartan and switching treatments, respectively. Sensitivity analyses found that patient discontinuation post-switching was a sensitive parameter. Including efficacy offsets with lowered adherence or discontinuation resulted in more favorable ratios for valsartan compared to switching therapy.
Limitations:
The model does not evaluate post-primary CVD events and considers change in SBP from baseline level as the sole predictor of CVD risk.
Conclusions:
Valsartan appears to be cost-effective compared to switching to generic losartan and switching to the generic drug does not support a cost offset argument over the longer term. Physicians should continue to consider the needs of individual patient and not cost offsets.
Introduction
Demonstrating differences in efficacy or effectiveness within a single drug class has been a challenge to many pharmaceutical products. The 160 mg dose level of valsartan has recently been highlighted in a meta-analysis of the angiotensin receptor blocker (ARB) class of anti-hypertensives as being clinically superior in the reduction of systolic blood pressure (SBP) over losartan 100 mg and irbesartan 150 mg, while performing comparably with other ARB drugsCitation1. These findings have an important clinical impact in the control of SBP in patients with essential hypertension, especially among those considering switching ARBs. A retrospective claims database study examining patients who switched from valsartan to another ARB vs patients who maintained treatment on valsartan found that switchers were more likely to discontinue medication, experience significantly more frequent all-cause and hypertension-related outpatient visits, hypertension-related inpatient visits, and incur higher ($748/patient) total medical costs over a 6-month periodCitation2.
When simvastatin became a generic product it led to a number of patients being switched from branded atorvastatin to generic simvastatin for economic, rather than medical, reasons. Subsequent research has suggested that this switch has had a detrimental effect on patients’ healthCitation3,Citation4. Losartan is the first approved generic ARB. Some patients whose blood pressure (BP) is effectively controlled by existing branded anti-hypertensives may be encouraged to switch ARBs for economic reasonsCitation2. There are apparent differences in effectiveness, safety, tolerability, salt forms of active pharmaceutical ingredients and pharmacodynamic properties (e.g., different half-lives) between valsartan and losartanCitation2,Citation5. These discrepancies may lead to reduced compliance, episodes of uncontrolled hypertension, further risks of developing cardiovascular disease (CVD) events and increased healthcare expenditures among the ARB switchers. In view of the concerns surrounding non-medical ARB switching, the present study examines the long-term costs and outcomes of patients who initiate hypertension treatment on valsartan and then switch to generic losartan, in addition to comparing the costs and outcomes of continual treatment of valsartan vs losartan.
The ongoing Framingham Heart Study (FHS) has investigated a large number of patients over decades of follow-up to detect the patterns and incidence of CVD and other related events. Over the history of FHS, several studies have been published detailing the patient characteristics associated with increased risk of CVD events, including multiple re-evaluations of follow-up data for the original patient group, and the Framingham Offspring Study cohort. Among these publications, a number of regression analysis-based risk equations were reported quantifying the impact of a multitude of risk factors on the overall risk of experiencing a CVD event. One of the most recent of these equations is the work done by Wilson et al.Citation6, which is used in the present study to investigate the impact of SBP control on long-term CVD risk.
To evaluate the long-term impact of improved SBP control between valsartan, losartan and switching from branded valsartan to generic losartan treatment, a Markov simulation model was developed to apply the meta-analysis findings of Nixon et al.Citation1 on the risk prediction equations of Wilson et al.Citation6 The model considers estimates of event costs, medical follow-up, and drug costs in its analysis of economic difference and cost-effectiveness between the anti-hypertensive treatments.
Modeling methods
Model structure
The economic model employed a US third party payer perspective, and followed adult patients with hypertension in annual Markov cycles. The basic model consisted of three health states designed to reflect course and history of CVD events in a typical patient with hypertension (): CVD event-free survival with treated hypertension (continual treatment), post-CVD event survival with treated hypertension (continual treatment), and an absorbing state, death. Transition from the event-free state to post-event survival was determined by the average probability of having a first CVD event as predicted from the risk equations of Wilson et al.Citation6 The model was restricted to evaluating only the costs and incidence of primary CVD events but applies an increased follow-up cost to reflect the intense care associated with the prevention of secondary events among patients moving to the post-event state.
Figure 1. Hypertension and switching treatment Markov state diagram.
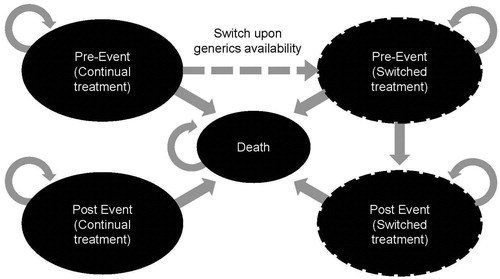
Transition from the event-free state to the death state was the result of a fatal CVD event as predicted by Wilson et al.Citation6, risk equations, or due to mortality from non-CVD causes as derived from the National Vital Statistics ReportCitation7. Transition from the post-event state to the death state was calculated using the background (non-CVD causes) mortality estimate, with an increased risk of death applied to patients in the post-event state compared to those remaining in the pre-event state.
In the modeled switching analysis, hypertension-treated patients were routed from the event-free state to receive alternate treatment when the second drug becomes generically available (). In this scenario, there were two additional health states: one that characterized pre-CVD event patients who recently switched from their initial anti-hypertensive to the generic formulation and the other for those with a CVD event after the change in treatment. Transition of switchers from the new pre-CVD event-free state to the new post-CVD event survival state was determined by the average probabilities calculated from the risk prediction equations of Wilson et al.Citation6 based on the alternative treatment arm. Transitions to death were the same as described for the continual treatment arms.
Two comparative analyses were conducted: (1) continual valsartan vs continual losartan and (2) continual valsartan vs valsartan switching to generic losartan once it is available. The model time horizon was 20 years and future costs and health outcomes were discounted 3%.
Inputs
Population characteristics
Estimates for each of the risk factors identified in the Framingham equationsCitation6 used to predict CVD risk in the present study were gathered from an analysis of the National Health and Nutrition Examination Survey (NHANES) datasetCitation8. The model followed the classification of hypertension in the sixth report of the Joint National Committee (JNC-6) on Prevention, Detection, Evaluation, and Treatment of High Blood PressureCitation9, where the BP cut-offs were found to match the severity levels for patients recruited in the study selections of Nixon et al.Citation1 meta-analysis. (Compared to the more recently published JNC-7, JNC-6 reported a more detailed classification of hypertension by BP levels and thus was chosen as the clinical guideline for defining the hypertension cohort in the model.) Mild and moderate hypertension cohorts in the model were defined as Stage 1 (SBP 140–159; DBP 90–99) hypertension, respectively. Two age groups were established among hypertension patients identified from the NHANES dataset: age 18 and over, and age 65 and over, for model analyses. A patient population with moderate hypertension (Stage 2; SBP 160–179; DBP 100–109) and aged 18 and over was selected for this analysis.
Treatment efficacy
Reduction in SBP was the key model efficacy measure. Treatment-specific inputs for SBP reduction were derived from the meta-analysis findings of studies covering treatment groups that received one of the ARB anti-hypertensive drugsCitation1. The SBP values were then used to calculate the average risk of first CVD event. The values for the other risk factors considered in the risk prediction equations remained unchanged from baseline over the course of model analysis. The model assumes that patients take 80% or more of their medication to obtain the full effect of therapy and no difference between therapies was assumed and in the base case 76% of patients in both arms were assumed to be adherentCitation10. Based upon Signorovitch et al.Citation2, 8% of switched patients discontinued (for any reason, not specifically due to the drug switch) and those patients were assumed to take 50% of their anti-hypertensive drug (resulting in lower drug cost), but no related impact on average SBP reduction was conservatively assumed due to lack of data. This assumed lack of impact was varied in sensitivity analyses.
Mortality and CVD event risk
Mortality risks in the model were divided into non-CVD-related and CVD-related. Using the National Vital Statistics ReportCitation7 as source data, the non-CVD-related mortality risk was estimated by subtracting the annual probability of CVD-related mortalityCitation6 from the annual probability of all-cause death, in order to avoid double-counting.
Although secondary CVD events were not explicitly considered in the model, patients in the post-event state were subjected to an increased risk of death reflecting their disease state. Estimates of the relative risk of mortality following a CVD event were taken from a comprehensive CVD report assembled by the AHACitation11.
The occurrence of coronary heart disease (CHD) or cerebrovascular disease (CeVD) events was based on the level of several risk factors identified in the development of disease-specific equations including BMI, age, smoking status, SBP, diabetic status, gender, and cholesterol profile. To delineate the specific types of CHD or CeVD events experienced by the patients in the model, additional event distributions were appliedCitation11,Citation12. Relative frequencies of these specific CVD events were calculated using the risk profile for each treatment group, and this distribution was applied to the overall risk level predicted by the Wilson et al.Citation6 equations.
CVD event, medical follow-up, and drug costs
CVD event costs were derived from an analysis of inpatient hospital records from 2003 covering multiple public data sets (including admissions from Arizona, California, Florida, Maryland, Massachusetts, Texas, and Washington). The costs of ‘Other CHD’ events in the model were taken from the analyses of six state hospital databases (California, Florida, Massachusetts, Maryland, New Jersey, and Washington) that are a part of the Healthcare Cost and Utilization Project (HCUP) National Inpatient Sample (NIS) database, plus the mean Medicare payment per hospital stay. These six states were selected for analyses because they were considered representative to yield a national cost estimate due to their geographic distribution in the USCitation13–18. Costs were derived from the data applying the cost-to-charge ratio from HCUP references files.
Medical follow-up costs in the model are divided into two types: event-free follow-up cost and post-event follow-up cost. Event-free follow-up cost was based on an assumed annual physician visit for monitoring prior to a CVD event, with switchers incurring additional visitsCitation19. Post-event follow-up cost reflected more intense physician interaction and increased management related to secondary prevention, in addition to hypertension managementCitation20. The same resource use was applied, regardless of hypertension therapy.
Drug costs in the model were Average Wholesale Price (AWP) estimates taken from the Micromedex RedBookCitation21. The model incorporated both the available branded prices and estimates of generic prices over the time horizon of the model (). The model used an assumed step-wise decrease in price following generic availability to account for the expected change in price. This step down in price applied to the first 4 years after generic availability while the remaining years until the end of the model time horizon were assumed to be at a flat price. These prices were then applied in the model through the calculation of a weighted ‘generic price ratio’. The calculation considered the number of years at a level of final generic price and the step-wise reduction in price to estimate a weighted average adjustment to the branded price in order to derive the generic price to apply in model analyses. Finally, the branded and generic drugs were dependent on patient compliance to medication. In the base case analyses, the generic formulations of valsartan and losartan are assumed to become available after 2.75 years and 4 months in the model, respectively.
Table 1. Moderate hypertension model input values.
Utilities
Age-specific estimates of quality-of-life were assigned and adjusted using a decrement attributable to hypertension to account for the impact of the disease state in the modelCitation22. The short-term impact of CHD and CeVD events was applied as a utility decrement at the time of the event occurrence to represent the adjustment in quality-of-life following the event and also the immediate recovery periodCitation22,Citation23. The long-term impacts of CHD and CeVD were applied as an ongoing decrement for patients remaining in the post-event state and represented the long-term impact of the debilitating condition.
Analyses and outcomes
Primary outcomes of the model were frequency of primary CVD events in each treatment group, overall survival, event-free survival, and quality-adjusted survival. Costs were computed by component and included the respective costs of CVD events (MI, fatal MI, other CHD, stroke, fatal stroke, and TIA), medical follow-up (including event-free and post-event follow-up), and drug costs. Incremental results were displayed in terms of cost per life year gained and cost per quality-adjusted life year (QALY) gained for comparison of patients treated with valsartan, losartan, and branded valsartan switching to generic losartan. The model population was moderate hypertension patients aged 18 and older, treated with 160 mg QD valsartan, 100 mg QD losartan, or 160 mg QD valsartan substituted with 100 mg QD generic losartan, and with a 20-year time horizon.
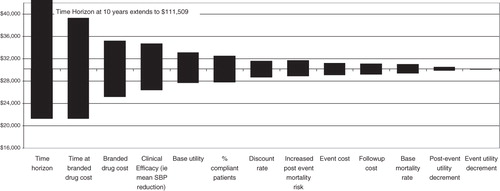
Scenario analyses examined incremental cost per QALY gained outcomes with a shorter time horizon of 10 years and varying the assumptions surrounding discontinuation and the impact of decreased drug efficacy related to taking 50% or less pills. The one-way sensitivity analysis varies each parameter by ±10% and presents the changes in model results in the format of a tornado diagram.
Results
The CVD event rates between the continual valsartan and losartan groups were nearly the same, although the valsartan-treated patients experienced fewer overall events (). Survival outcomes were also nearly identical for continual valsartan and losartan (QALYs: 8.02 vs 8.00; LYs: 10.65 vs 10.62). For the valsartan switchers, the CVD event rates and survival outcomes were the same as the continual losartan group, since the majority of time was spent on generic losartan treatment as the ARB became generic early in model analysis (0.33 years).
Table 2. Costs and outcomes of valsartan vs losartan and switching to losartan in moderate hypertension over 20 years.
Valsartan therapy was more expensive than losartan; however, some of the costs were recouped by the lower expenditures in treating CHD and CeVD events and medical follow-up. These cost-offsets resulted in an incremental cost of $714 for the valsartan vs losartan analysis. Assuming a ceiling ratio of $100,000, treatment of moderate hypertension patients was considered cost-effective with an incremental cost per life year gained and incremental cost per QALY gained of $27,268 and $32,313, respectively. The cost of treatment when switching from valsartan to generic losartan was less expensive than a continual valsartan treatment over a period of 20 years, resulting in incremental cost effectiveness ratios (ICERs) of $25,460 (incremental cost per life year gained) and $30,170 (incremental cost per QALY gained), respectively.
Scenario analyses
The model analyses conducted with shorter time horizons (e.g., 10 years) had higher cost/QALY due to smaller differences in quality-adjusted survival (). Further analysis of the time horizon parameter revealed that the frequency of events increased consistently while incremental cost-effectiveness outcomes declined rapidly with longer time horizons and level off after 20 years of model time (data not shown).
Table 3. Incremental scenario analyses of valsartan vs losartan and vs switching in moderate hypertension patients.
The impact of patient adherence (defined as taking 80% or more of medications) was explored by varying the proportion up and down from the base case of 76%. As expected, increased adherence increases the cost of therapy resulting in higher ICERs when the two drug regimens are compared. In the switching analysis, adherence remains the same but patients may discontinue (defined as 30 days without medication), which is modeled as having 50% of drug costs. Increasing the proportion of patients discontinuing in the year of switching has no impact on the ICER. In subsequent years decreasing discontinuation (costs become higher) results in a lower ICER for valsartan compared to the switchers. The base case model assumes no impact on SBP control related to changes in pill taking due to lack of data, however, it is reasonable to assume some decrease in efficacy could result with taking fewer doses. In a sensitivity analysis, a 5% offset in the SBP control in switched patients was taken in the 8% of patients discontinuing. The ICER decreases as the percentage SBP offset rises, reflecting the importance of maintaining the SBP decrease achieved by the ARBs ().
presents the tornado diagram ranking of valsartan vs switching inputs sensitive to incremental cost per QALY gained measure, as well as the range of variation generated by independent manipulation of each parameter (one-way sensitivity analyses). Time horizon was the most sensitive parameter to the ICER measure, especially at a smaller time horizon where its effect was most pronounced. After time horizon, the cost of treatment was the greatest driver, as were time on branded drug and clinical efficacy.
Figure 2. Tornado chart of incremental cost per QALY gained: Valsartan vs switching to losartan.
Discussion
The base case model results indicated that continual treatment with valsartan had ICERs of $32,313 and $30,170 per QALY gained ($27,268 and $25,460 per life year gained), relative to continual losartan and switching arm, respectively. These ratios compared favorably to other cost-effectiveness analyses for hypertension controlling medications ($35,600/QALY comparing amlodipine to chlorthalidone, for example)Citation24.
By comparing valsartan to the switching arm (valsartan switched to generic losartan), the model attempted to account for the patent lives of valsartan and losartan. The model assumed that valsartan would remain on patent for the first 2.75 years of the model time horizon and losartan would remain on patent for only 4 months, after which generic formulations would be available. The model results indicated only slight increases in the costs of treatment and cost-effectiveness ratios for valsartan compared to the switching arm. Based upon the improved SBP levels per meta analysisCitation1, which leads to better long-term clinical benefits associated with treatment on valsartan, the switch to generic losartan could be viewed as an economic decision. The clinical community has stated that treatment decisions should be based on strong clinical evidence and that drug substitution based solely on economic grounds cannot be in a patient’s best interestCitation25, and in any case may not deliver the expected economiesCitation26.
The economic model explored the effect of patient adherence and change in drug cost due to the availability of generic medication. In considering patient adherence, it was defined as those taking 80% or more of medication as directed. Fully-compliant patients were assigned the complete efficacy and drug cost for the given regimen, while non-adherent patients were assumed conservatively to suffer no loss in efficacy but received 50% of the drug cost in the model. Thus, non-adherent patients were not ‘penalized’ with worse outcomes but instead were ‘rewarded’ with lower costs. To date, limited literature exists on the association between adherence and BP control, however, a retrospective study conducted by Bramley et al.Citation27 among hypertension patients receiving monotherapy revealed that the proportion of patients achieving BP control per JNC-6 definition was higher (42.9%) among the high-adherence group vs patients in the medium- (33.9%) and low-adherence (32.6%) categories. Additionally, the highly adherent patients were 45% more likely to achieve target BP level than those with medium or low adherence after controlling for age, gender, and co-morbidities. Sensitivity analyses in the current study indicated that the ICER for continuous valsartan vs switching decreased with the assumption of decreased SBP control associated with lowered adherence. Further investigation into the relationship between patient adherence and change in SBP level, or the inclusion of patient adherence as a predictor in the risk equation, as well as detailed follow-up analysis of patient treatment behavior over time, would lead to more robust and meaningful analysis.
As with all models, the present economic analyses are subject to limitations. It tracks changes in SBP assuming all other factors are equal and only the first CVD event is specifically included. Once patients have experienced a CVD event, they transition to a post-event state, where they continue to accrue costs and life years while being subjected to a higher risk of death. This simplified model structure eliminates the need for secondary event inputs; however, it does not predict the clinical occurrence of post-primary CVD events. Inclusion of detailed secondary CVD events could result in a larger number of events, but it would not likely alter the conclusions presented. Second, the model only considers change in SBP from baseline level as the sole predictor of CVD risk. CVD is multifaceted and many factors contribute to health and cost outcomes of hypertension patients. Valsartan and losartan are prescribed to lower BP, but may have other effects on CVD risk factors that are not examined in the model. Although the Framingham equations used in this analysis have been extensively validated against historical data and serve as good predictors of outcomes, in lieu of treatment-specific long-term outcome data, the modeling of a clinical pathway among hypertension patients remained an active area of health economic research. Finally, the model uses a variety of data sources to estimate the impact of differences in SBP control across the cohorts. This is a common occurrence in economic modeling where empirical data are not available to answer questions of importance.
The model demonstrates the importance of better understanding patient behavior when drugs are switched, particularly their adherence. Patient adherence with medication was a sensitive parameter in this model, as was the inclusion of decreased efficacy due to taking 50% or less of the hypertension medication. More information on the potential long-term consequences of ARB substitution should be gathered to better understand the costs and benefits of switching from valsartan to generic losartan.
Conclusion
The economic analyses indicated that treatment with valsartan is cost-effective compared to switching treatment to generic losartan. Despite the model limitations it provided an important illustration of the impact of improved control of a single CVD risk factor, the SBP level. Switching from valsartan to generic losartan does not support a cost off-set argument over the longer term.
Transparency
Declaration of funding
This model and analysis was supported by a grant from Novartis Pharma AG.
Declaration of financial/other relationships
None
Acknowledgments
The authors are grateful to Sean Stern (UBC) for his model review and Jess Barnett for manuscript support.
References
- Nixon RM, Muller E, Lowy A, et al. Valsartan vs. other angiotensin II receptor blockers in the treatment of hypertension: a meta-analytical approach. Int J Clin Pract 2009;63:766-75
- Signorovitch J, Zhang J, Wu EQ, et al. Economic impact of switching from valsartan to other angiotensin receptor blockers in patients with hypertension. Curr Med Res Opin 2010;26:849-60
- Aronow HD, Hess G, Hill J, et al. Switching from atorvastatin to simvastatin in patients at high cardiovascular risk: effects on low-density lipoprotein cholesterol. Am J Ther 2010;17:167-75
- Asara JM, Schweitzer MH, Freimark LM, et al. Protein sequences from mastodon and Tyrannosaurus rex revealed by mass spectrometry. Science 2007;316:280-5
- Verbeeck RK, Kanfer I, Walker RB. Generic substitution: the use of medicinal products containing different salts and implications for safety and efficacy. Eur J Pharm Sci 2006;28:1-6
- Wilson PW, Bozeman SR, Burton TM, et al. Prediction of first events of coronary heart disease and stroke with consideration of adiposity. Circulation 2008;118:124-30
- Arias E. United States life tables, 2004. Natl Vital Stat Rep 2007;56:1-39
- Centers for Disease Control and Prevention (CDC). National Center for Health Statistics (NCHS). National Health and Nutrition Examination Survey Data (NHANES). Hyattsville, MD: U.S. Department of Health and Human Services, Centers for Disease Control and Prevention, 2005–2006, 2006. http://www.cdc.gov/nchs/nhanes/nhanes2005-2006/nhanes05_06.htm. Accessed January 15, 2009
- National Institutes of Health (NIH), National Heart L, and Blood Institute. The Sixth Report of the Joint National Committee (JNC-6) on prevention, detection, evaluation, and treatment of high blood pressure. No. 98–4080. NIH. 1997, Bethesda, MD.
- Cramer JA. Consequences of intermittent treatment for hypertension: the case for medication compliance and persistence. Am J Manag Care 1998;4:1563-8
- Lloyd-Jones D, Adams R, Carnethon M, et al. Heart disease and stroke statistics–2009 update: a report from the American Heart Association Statistics Committee and Stroke Statistics Subcommittee. Circulation 2009;119:e21-181
- Anderson KM, Odell PM, Wilson PW, et al. Cardiovascular disease risk profiles. Am Heart J 1991;121:293-8
- Agency for Healthcare Research and Quality, Maryland. The HCUP State Inpatient Database (SID). New Jersey: Agency for Healthcare Research and Quality, 2008
- Massachusetts Division of Health Care Finance and Policy. Massachusetts Fiscal Year 2008 acute hospital case mix data base, level III. Massachusetts: Division of Health Care Finance and Policy, 2008
- Office of Statewide Health Planning and Development. Inpatient 2008. Discharge Data (Version A). California: Office of Statewide Health Planning and Development, 2008
- St. Paul Computer Center Inc. Inpatient research use file. Baltimore, MD: St. Paul Computer Center Inc., 2008
- State of Florida, Agency for Health Care Administration, State Center for Health Statistics. Hospital patient data file. Florida: Agency for Health Care Administration, State Center for Health Statistics, 2008
- Washington State Department of Health, Office of Hospital and Patient Data. CHARS (Comprehensive Hospital Abstract Reporting System) Public Data File. Washington: Washington State Department of Health, Office of Hospital and Patient Data, 2008
- Lindgren-Furmaga EM, Schuna AA, Wolff NL, et al. Cost of switching hypertensive patients from enalapril maleate to lisinopril. Am J Hosp Pharm 1991;48:276-9
- Russell MW, Huse DM, Drowns S, et al. Direct medical costs of coronary artery disease in the United States. Am J Cardiol 1998;81:1110-5
- Thomson PDR. Micromedex Red Book for Windows. Version 61127, 2010
- Sullivan PW, Ghushchyan V. Preference-Based EQ-5D index scores for chronic conditions in the United States. Med Decis Making 2006;26:410-20
- Currie CJ, McEwan P, Peters JR, et al. The routine collation of health outcomes data from hospital treated subjects in the Health Outcomes Data Repository (HODaR): descriptive analysis from the first 20,000 subjects. Value Health 2005;8:581-90
- Heidenreich PA, Davis BR, Cutler JA, et al. Cost-effectiveness of chlorthalidone, amlodipine, and lisinopril as first-step treatment for patients with hypertension: an analysis of the Antihypertensive and Lipid-Lowering Treatment to Prevent Heart Attack Trial (ALLHAT). J Gen Intern Med 2008;23:509-16
- Johnston A. Challenges of therapeutic substitution of drugs for economic reasons: focus on CVD prevention. Curr Med Res Opin 2010;26:871-8
- Johnston A, Stafylas P, Stergiou GS. Effectiveness, safety and cost of drug substitution in hypertension. Br J Clin Pharmacol 2010;70:320-34
- Bramley TJ, Gerbino PP, Nightengale BS, et al. Relationship of blood pressure control to adherence with antihypertensive monotherapy in 13 managed care organizations. J Manag Care Pharm 2006;12:239-45