Abstract
Background:
This research addresses the need for population-based studies on the burden of chronic low back pain (CLBP) by examining healthcare service use and costs for patients with and without neuropathic components in the US population.
Methods:
Data were analyzed from PharMetrics IMS LifeLink™ US Claims Database (2006–2008). Patients (≥18 years) with 36 months continuous enrollment, ICD-9 code for low back pain, and claims in 3 out of 4 consecutive months in the 12-month prospective period were included and classified with CLBP. Patients were further classified with a neuropathic component (wNP) and without a neuropathic component (woNP) based on ICD-9 codes. Healthcare resources, physical therapy, prescription medication use, and associated costs were assessed for the period January 1–December 31, 2008.
Results:
A number of patients (39,425) were identified with CLBP (90.4% wNP). Patients wNP included more women, were older and more likely to have clinically diagnosed depression, and made significantly greater use of any prescription medication at index event, opioids (particularly schedule II), and healthcare resources. Total direct costs of CLBP-related resource use were ∼US$96 million over a 12-month follow-up. CLBP wNP accounted for 96% of total costs and mean annual cost of care/patient was ∼160% higher than CLBP patients woNP (US$ 2577 vs US$ 1007, p < 0.0001).
Limitations:
This study was descriptive and was not designed to demonstrate causality between diagnosis, treatment, and outcomes. Resource use and costs for reasons other than LBP were not included. Patients with neuropathic pain are more likely to seek treatment; therefore CLBP patients with a non-neuropathic component may be under-represented.
Conclusions:
The disproportionately high share of interventional resource use in CLBP wNP suggests greater need for new treatment options that more comprehensively manage the range of pain symptoms and signaling mechanisms involved, to help improve patient outcomes and reduce the burden on healthcare systems.
Introduction
Chronic low back pain (CLBP) is traditionally identified by the length of time a patient has low back pain (LBP), the location of the pain, and the etiology of the symptomsCitation1. Many cases of LBP are acute and resolve within a few days to a few weeks; however, for some patients, the LBP persists longer than 3 months. Using a criterion of 30 pain days in the previous 3 months as a pre-requisite, Schmidt et al.Citation2 estimated that almost one-fifth of the general German population had persistent back pain.
The pathophysiology of back pain is complex and both nociceptive and neuropathic pain-generating mechanisms are thought to be involved. Estimates of the proportion of CLBP patients with a neuropathic component (wNP) range from 17–54% and vary according to the method of classification usedCitation2–7. However, given that as many as 28% of patients had an uncertain diagnosisCitation3, the neuropathic component in chronic back pain may yet be under-estimated.
Back pain is one of the single most costly disorders in many industrialized nationsCitation8. Estimates of the total national expenditure (US) for the care of LBP range from US$ 20–50 billion in 1998Citation9 and growing concerns about the high cost of CLBP care has increased interest in the factors associated with CLBP and healthcare service use. Previous studies have found in addition to analgesic use in patients with LBPCitation10, physical and mental health comorbiditiesCitation11, back pain diagnosis (disc disorder/sciatica, arthritis vs other), chronic pain grade, pain persistence, depressive symptomatology, and back pain-related disability compensation are associated with higher healthcare utilization and costsCitation12. Higher costs are also associated with surgery, particularly in those patients who do not respond to therapy. However, there is limited evidence on the burden, particularly the costs, associated with CLBP wNP. In a cross-sectional observational survey in six European countriesCitation13 patients wNP were found to visit their physician frequently and report substantial pain that interferes with daily functioning, despite receiving treatment; however, cost estimates were not assessed. Similarly, a recent meta-analysis confirmed the view that patients with neuropathic pain experience low utilities and therefore low health-related quality-of-life (HRQoL) compared with the general population. There was a significant relationship between increasing neuropathic pain severity and a reduction in utility; however, the analysis was not specific to LBP and costs were not assessedCitation14. A more recent study modeled the prevalence and cost of patients experiencing persistent back pain (at least 30 days in the previous 3 months) wNP in the general population based on the results of a cross-sectional postal and personal digital assistant patient-based questionnaire in GermanyCitation2. Approximately 26.5% of the total costs associated with medium-to-long-term back pain were attributable to pain wNP, and were as much as 67% higher than patients with a nociceptive component only.
The current study aims to address a need for population-based studies to provide a direct assessment of CLBP wNP and its associated costs in the general populationCitation2. It examines patterns of healthcare service use and costs for CLBP patients wNP and without a neuropathic component (woNP), in a large US patient commercial insurance claims integrated database with regionally representative coverage.
Methods
Source data
Medical and pharmaceutical claims data were obtained from retrospective analysis of the PharMetrics IMS LifeLink™ Health Plan Claims Database (PharMetrics Inc., Watertown, MA) for the period January 1–December 31, 2008. The database is the largest non-payer-owned integrated claims database of commercial insurers in the US. This de-identified, integrated database includes medical and pharmacy claims for more than 55 million unique members from more than 90 health plans across the US. It includes inpatient and outpatient claims, diagnoses, and procedures, including physiotherapy (based on International Statistical Classification of Diseases, Ninth Revision (ICD-9) and Current Procedural Terminology (CPT-4) codes) as well as retail and mail order pharmacy claims. The database includes claims for medical equipment, however, over the counter medicines and productivity measures are not covered.
The database is representative of the national commercially insured population, and includes a variety of demographic measures, such as age, gender, and plan type. This longitudinal data has an average member enrollment period of 2 years. Hospitalization, emergency room (ER) visits, diagnostics, minimally invasive or major surgery, and prescription medication resource use and associated costs attributed to LBP were retrieved from the database along with the demographics for all patients included in the analysis. Utilization and the costs for all analgesic prescription medications were included and categorized by schedules II, III, and IV of the US Drug Enforcement Agency drug schedules, or by class: non-steroidal anti-inflammatory drugs (NSAIDs), anti-epileptic drugs (AEDs), and antidepressants (ADs). The costs (US$) cover the period January 1–December 31, 2008. Resource use and associated costs attributed to reasons other than LBP were not included in the analysis.
Patient classification
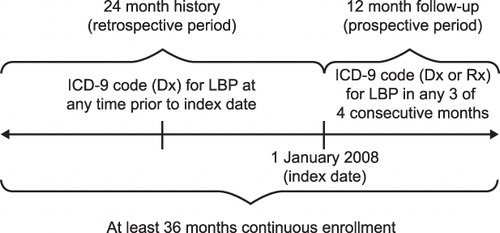
Inclusion criteria were devised to classify patients with CLBP (). Patients were included in the analysis if they satisfied all of the following criteria:
They were aged 18 years or over on January 1, 2008;
They had continuous enrollment in the database of 36 months; at least 12 months follow-up from the index event (January 1, 2008) and 24 months retrospective data;
They had an ICD-9 code for diagnosis or treatment of LBP (724.4) during the retrospective period; and
They had an ICD-9 code for diagnosis or treatment of LBP in at least 3 out of 4 consecutive months during the prospective period in order to establish CLBP.
CLBP patients wNP (ICD-9 codes primary or supplementary): 720.1, 720.8, 721.0, 721.1, 721.4, 721.8, 721.9, 722.0, 722.1, 722.2, 722.4, 722.5. 722.6, 722.7, 722.8, 722.9, 723.0, 723.1, 723.2, 723.4, 724.0, 724.1, 724.2, 724.3, 724.5, 724.6, 724.8, 724.9, 737.3, 738.5.
CLBP patients woNP (ICD-9 codes primary or supplementary): 307.89, 720.0, 720.2, 720.9, 721.2, 721.3, 721.5, 721.6, 721.7, 722.3, 722.32, 723.7, 723.8, 723.9, 724.7, 737.1, 738.4, 739.3, 739.4, 756.1, 756.11, 756.12, 846.0, 846.1, 847.2, 847.9, 805.4, 805.6, 805.8, 846.2, 846.3, 846.4, 846.5, 846.6, 846.7, 846.8, 846.9, 847.1, 847.3, 847.4.
Figure 1. Classification of CLBP patients. Dx, diagnosis; Rx, treatment; LBP, low back pain; ICD-9, International Statistical Classification of Diseases, Ninth Revision; CLBP, chronic low back pain.
Statistical analyses
The primary aims of the analyses were to compare the distribution of medical care and costs for CLBP patients wNP or woNP. All those meeting the patient classification were included in the analysis. The statistical analyses were performed using SAS 9.1 statistical software (SAS Institute Inc., Cary, NC). Chi-squared and t-tests were used to compare proportions and means between groups, respectively. Statistical significance was defined at the level of 5% (α = 0.05). PROC GLM (General Linear Model) was used to compare resource use between CLBP patients wNP or woNP. The model controlled for differences in gender, age, and prevalence of clinical depression based on ICD-9 diagnosis.
Results
Patient demographics
A number of patients (225,259) were identified in the PharMetrics database on January 1, 2008, based on the LBP ICD-9 diagnosis definition; 183,929 of these patients had complete enrollment during the following 12 month period; 136,861 patients had at least 24 months continuous enrollment up to and including December 31, 2008. The criteria for defining CLBP (3 out of 4 consecutive months with a diagnosis or treatment) were applied consistently to the entire cohort, identifying 85,038 patients; 59,084 of these patients received treatment for LBP during 2008; 39,425 of whom had an LBP diagnosis in 2008 as well as during the previous year.
The demographics of the patient cohort classified with CLBP are shown in . The majority of CLBP patients identified had neuropathic components (90.4%). A higher proportion of women (63%) than men were classified with CLBP. The proportion of male patients was slightly higher for CLBP patients woNP compared with those wNP (38.3% vs 36.0%, p = 0.02). The mean age of the CLBP woNP patient cohort was somewhat lower compared with the CLBP wNP patient cohort [50.3 years vs 51.0 years, (p < 0.0001)].
Table 1. Patient demographics of CLBP patients at the index event.
There was a higher level of prior exposure to opioids amongst CLBP patients wNP by comparison with those woNP (71.8% vs 56.3%, p < 0.0001). The incidence of a comorbid cancer diagnosis amongst CLBP patients was similar regardless of pain type. A higher proportion of CLBP patients wNP had a diagnosis of clinical depression according to ICD-9 code classification compared with CLBP patients woNP (8.1% vs 3.2%, p < 0.001). There was no difference between CLBP patients wNP or woNP in the prevalence of cancer diagnosis. A higher proportion of CLBP patients wNP were receiving prescription medication at the index event compared with CLBP patients woNP (75.2% vs 61.8%, p < 0.0001). A higher proportion of CLBP patients wNP who were receiving prescription medication were on schedules II, III, and IV drugs compared with those woNP (62.0% vs 47.0%). Amongst CLBP patients on schedules II, III, and IV drugs, those wNP were more likely to be receiving schedule II drugs (which comprises strong opioids) compared with those woNP (39.4% vs 27.4%). Of the CLBP patients woNP on prescription medication at baseline, a large proportion (42.0%) were receiving AD/AEDs; 11.0% were on NSAID monotherapy.
Resource use
Treatment exposure during the prospective 12-month follow-up period by CLBP patients according to pain type is shown in . A higher proportion of CLBP patients wNP were exposed to schedules II, III, and IV drugs (52.9%) compared with those woNP (41.9%). Results from the general linear model controlling for sex, age, and clinical depression (based on ICD-9 diagnosis), showed that the mean number of months of exposure to schedules II, III, and IV drugs among CLBP patients wNP was significantly higher than patients woNP. The model also showed that the mean number of months not on prescription medication was significantly higher in the group of CLBP patients woNP (5.5 vs 4.3, p < 0.0001). A higher proportion of CLBP patients woNP did not receive prescription medication compared with those wNP (21% vs 13.6%).
Table 2. Treatment exposure during 12-month follow-up period by CLBP patients according to pain type.
Medical resource utilization for CLBP patients with and without neuropathic components is shown in . A significantly higher proportion of CLBP patients wNP made use of healthcare resources, including diagnostic tests (24.3% vs 7.1%; p < 0.0001), ER visits (9.3% vs 4.9%; p < 0.0001), and hospital visits (5.1% vs 1.0%; p < 0.0001) compared with CLBP patients woNP. CLBP patients wNP made greater use of minimally invasive procedures (including the use of nerve blocks, spinal puncture, drainage of spinal abscess) (18.3% vs 6.1% [p < 0.0001]) and major procedures (such as artificial disc replacement, nerve repair, partial resection of vertebral components) (5.7% vs. 1.1% [p < 0.0001]) than CLBP patients woNP.
Table 3. Comparison of resource use for CLBP patients according to pain type during 12-month follow-up period.
Healthcare costs
The total direct medical costs of LBP-related resource use were ∼US$ 96 million over the 12-month follow-up period for all CLBP patients. CLBP wNP accounted for 90.4% of the total cohort and 96% of the total costs, indicating greater resource utilization. The mean annual cost of care for all CLBP patients was US$ 2426 per patient. The mean annual cost of care per patient for CLBP patients wNP was ∼160% higher than those woNP (US$ 2577 vs US$ 1007, p < 0.0001).
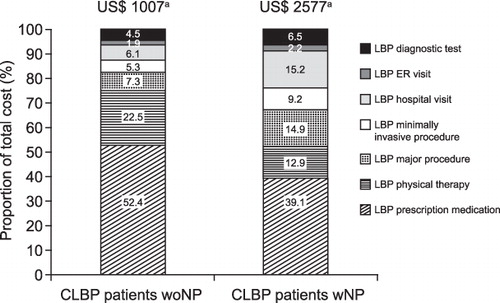
The distribution of cost by resource use according to pain type is shown in . CLBP patients wNP had a higher proportion of total costs attributed to diagnostic tests (6.5% vs 4.5%), ER visits (2.2% vs 1.9%), hospitalization (15.2% vs 6.1%), and minimally invasive (9.2% vs 5.3%) and major procedures (14.8% vs 7.3%) than CLBP patients woNP. LBP drug treatment and physiotherapy costs accounted for nearly 75% of total costs for CLBP patients woNP.
Figure 2. Comparison of proportions of average annual cost of resource use per patient for CLBP patients according to pain type during 12-month follow-up period. aAverage annual cost of resource use per patient (p < 0.0001, CLBP patients woNP vs CLBP patients wNP). CLBP, chronic low back pain; woNP, without a neuropathic component; wNP, with a neuropathic component; LBP, low back pain; ER, emergency room.
Discussion
A variety of methods have been used to explore the prevalence and burden of this condition; however, there is an absence of a standard or widely accepted method of diagnosis and characterization of CLBP of neuropathic origin. Estimates of the prevalence of CLBP wNP have been influenced by the particular method used in its classification. In contrast to most other analyses, which are based on patient questionnaires and therefore influenced by the accuracy of patients’ self-report, the present study relies on actual medical diagnoses (ICD-9 codes) to classify patients with LBP with or without a neuropathic component.
The majority of CLBP patients identified in this study had at least one of the ICD-9 codes (primary or supplementary) for neuropathic components (90.4%). Given the considerable differences in the methods of classification, direct comparison with the distribution of pain type reported in other studies is limited. The patients identified in this study were receiving treatment for CLBP. The data does not capture non-prescription or over-the-counter treatments and, since patients with neuropathic pain are more likely to seek treatment, CLBP patients with a non-neuropathic component may be under-represented in this cohort. However, the classification system of CLBP patients wNP used here may be considered more inclusive, since the patient cohort is defined based on claims for one or more ICD-9 codes for a neuropathic component. Consequently, it is not limited to CLBP patients wNP only, and may include patients where other pain components or mechanisms are involved. Freynhagen et al.Citation3 found that, in screening CLBP patients with neuropathic pain components attending orthopedic clinics for treatment, 33.5% of patients displayed a combination of any three or more of the listed signs and symptoms; however, this figure increased considerably (60.7%) when a less restrictive definition of two or more characteristic signs for neuropathic pain were considered.
Schmidt et al.Citation2 suggested that a neuropathic component is substantially more frequent in persons with severe back pain compared to persons with mild back pain. Using the painDETECT questionnaire, the proportion of persons classified as having neuropathic pain differed substantially between pain grades; amongst patients with the lowest pain grade fewer than 10% were assigned with neuropathic pain while nearly half of those in the highest grade pain were classified according to this typeCitation2. Therefore, the classification system of CLBP used here, requiring patients to experience chronic pain in 3 out of 4 continuous months with either a diagnosis code or treatment for LBP, is relatively stringent and more closely aligned with other clinical definitions of CLBPCitation15. By specifying this frequency and continuity of claims, uncertainty in diagnoses over time is minimized; however, this may have led to the inclusion of a patient population with more severe illness and, therefore, a greater proportion of CLBP patients wNP.
The CLBP patient cohort is also distinct from previous analyses in that it focuses only on those patients receiving, or actively seeking, treatment, rather than CLBP patients identified by physician assessment or patient questionnaire who are largely defined by their symptoms. The distribution of pain types amongst CLBP patients seeking treatment may differ from the CLBP populations assessed in other studies since patients wNP may be more likely to have severe pain and, therefore, seek and/or be receiving treatment than those woNP. Respondents with neuropathic pain type reported significantly higher levels of expressed need, based on the Level of Expressed Needs questionnaire, an instrument that is considered to correlate with disability and healthcare useCitation6. Moreover, patients reporting chronic pain of predominantly neuropathic origin (POPNO) in primary care had higher median pain severity scores than other chronic non-neuropathic pain sufferers, and were marginally more likely to receive pain-related medicationCitation7.
Notwithstanding the distinct method of classification, the demographics of the CLBP patient cohort in the current study were similar to the other analyses of this patient type. A relatively higher proportion of female patients with a CLBP diagnosis in the PharMetrics Database (63.8%) were also observed in the National Health Interview Survey (NHIS) (54.4%)Citation16. The mean age of the CLBP patient cohort in the NHIS of 52.7 years was comparable with that reported here (51.0 years). The level of clinical depression (defined by ICD-9 diagnosis code classification) reported for the total CLBP patient cohort was somewhat lower (7.7%) than one other study in which comorbidities in LBP patients were assessed (13.4%)Citation11. However, the latter study uses the RxRisk model, or Chronic Disease Score (a clinically validated algorithm that classifies patients into chronic disease categories based on prescription drug fills) to assess comorbiditiesCitation17, and may account for the comparatively higher level of clinical depression. The National Comorbidity SurveyCitation18 reports a mean 12-month prevalence estimate of major depressive disorder of 6.7% in the general population using the Composite International Diagnostic Interview based on DSM-IV criteria, of which ∼56.8% of patients seek treatment in any given yearCitation19. Given <60% of patients with depression seek treatment may explain the low prevalence of depression in our cohort. Nevertheless, there is a relatively higher proportion of CLBP patients wNP (8.1%) with depression compared with those woNP (3.2%).
CLBP patients wNP had a higher likelihood of receiving stronger analgesic prescription medication more often compared with CLBP patients woNP. Exposure to schedules III and IV drugs was similar for CLBP patients regardless of pain type; however, use of schedule II drugs was higher amongst CLBP patients wNP. This finding is similar to the medication and treatment use of patients in primary care reporting chronic painCitation7, where patients with chronic POPNO were more likely to receive multiple pain medications (37% vs 21% took ≥2 pain medications, p < 0.001) and stronger painkillers [e.g., opioids (12.9% vs 7.1%, odds ratio 1.94)] compared with those patients with chronic pain of non-neuropathic origin. Vogt et al.Citation10 established that opioid use amongst LBP patients was associated with high volume usage of LBP healthcare services.
While the resource use of patients with CLBP has been explored elsewhereCitation2,Citation20, information concerning the relative impact on LBP-related resource use of patients with and woNP is scarce. Except for physiotherapy, CLBP patients wNP made significantly greater use of all resources during the follow-up period than patients woNP. The extent of the resource use of this patient cohort suggests that, despite the widespread use of available medications (including schedule II drugs and nerve blocks), their condition appears to remain largely inadequately managed, as indicated by their comparatively heavier reliance on inpatient resources, including ER visits. The difference in resource use between CLBP patient cohorts is most marked in the case of major procedures (relevant to LBP) where an ∼5-fold greater proportion of CLBP patients wNP require these interventions compared to those woNP. Moreover, the invasiveness of these major procedures may contribute to the level of hospitalization experienced by the CLBP patients wNP.
The total mean annual cost per patient of US$ 2426 reported is consistent with other studies of the cost of CLBP-related care. The mean annualized costs, for 16,567 patients identified with LBP from a retrospective analysis of a health maintenance organization patient claims database, was US$ 2780 per patient in 1999Citation11. Based on a survey of patients with CLBP in primary care in Sweden, the total annual direct costs were estimated at US$ 2900 (€3100) per patient, in 2002 pricesCitation20. Average total back pain costs per patient, based on the direct costs from utilization of healthcare services and indirect costs due to back pain-related production losses, were estimated to be €1322 (US$ 1639) per year in Germany (at 2005 prices)Citation21. Schmidt et al.Citation2 calculated the average total back pain-related costs across all pain grades amounted to €2456 (US$ 3400) per patient. Among patients with persistent back pain, typical costs associated with a person suffering neuropathic back pain were as much as 67% higher than those of a patient with nociceptive back pain only.
While this study adds to earlier analyses of the cost of CLBP-related care, by analyzing the resource use that underlies these costs it reveals that CLBP patients wNP contribute a disproportionately high share, which stems from a level of inpatient resource use far in excess of CLBP patients woNP. This includes the use of diagnostic tests, which may reflect the challenge in diagnosing this condition precisely, as well as invasive and costly surgical procedures. Existing therapies appear to inadequately alleviate the range of pain symptoms experienced by this group of patients and there remains a considerable unmet need in terms of the management of their care. Moreover, the cost per patient is significantly greater for CLBP patients wNP compared with CLBP patients woNP in this study. Therefore, new treatment options are needed that more effectively treat CLBP, particularly where a neuropathic component is involved, to improve outcomes in these patients and hopefully reduce burdens on the resources and budget of healthcare systems.
Limitations
This study was descriptive in nature and was not designed to allow for the demonstration of causality between diagnosis, treatment, and outcomes.
Resource use and associated costs attributed to reasons other than LBP were not included in the analysis. This study captured data for only patients who were actively seeking and receiving medical treatment and, therefore, patients who have been managing their care independently through non-prescription over-the-counter medication may have been excluded. Patients with neuropathic pain are more likely to seek treatment, therefore CLBP patients with a non-neuropathic component may be under-represented in this study. Indirect costs due to lost productivity through sickness absence or early retirement of CLBP patients are not included. The database covers a commercially insured population who are primarily employed, thus CLBP patients who may be unemployed or who have lost employment may be excluded as a result. Similarly, CLBP patients aged over 65 years may be under-represented. Consequently, the overall patient burden reported in this study may under-estimate the full extent of the patient burden of CLBP patients.
The classification of CLBP patients wNP is largely based on ICD-9 codes and as such the results are dependent on the accuracy of the coding by healthcare providers; independent verification of the LBP diagnosis was not available in the insurance database. It was also not possible to define the severity of illness of CLBP patients in the database.
Conclusions
The disproportionately high share of interventional resource use in CLBP wNP suggests greater need for new treatment options that more comprehensively manage the range of pain symptoms and signaling mechanisms involved to help improve patient outcomes and reduce the economic burden on healthcare systems.
Transparency
Declaration of funding
This analysis was supported by Johnson & Johnson Pharmaceutical Services, LLC.
Declaration of financial/other relationships
At the time of conducting the study, all authors were employees of Johnson & Johnson Pharmaceutical Services, LLC.
Acknowledgments
Medical writing assistance was provided by Iain McDonald, PhD, ApotheCom ScopeMedical Ltd, Sevenoaks, UK, funded by Johnson & Johnson Pharmaceutical Services, LLC.
Previous presentation
The data has been previously presented at American Pain Society, May 19–21, 2011, Austin, Texas (Poster number 140).
References
- Parthan A, Evans CJ, Le K. Chronic low back pain: epidemiology, economic burden and patient-reported outcomes in the USA. Expert Rev Pharmacoecon Outcomes Res 2006;6:359-69
- Schmidt CO, Schweikert B, Wenig CM, et al. Modelling the prevalence and cost of back pain with neuropathic components in the general population. Eur J Pain 2009;13:1030-5
- Freynhagen R, Baron R, Gockel U, et al. painDETECT: a new screening questionnaire to identify neuropathic components in patients with back pain. Curr Med Res Opin 2006;22:1911-20
- Freynhagen R, Baron R. The evaluation of neuropathic components in low back pain. Curr Pain Headache Rep 2009;13:185-90
- Kaki AM, El-Yaski AZ, Youseif E. Identifying neuropathic pain among patients with chronic low-back pain: use of the Leeds Assessment of Neuropathic Symptoms and Signs pain scale. Reg Anesth Pain Med 2005;30:422-8
- Torrance N, Smith BH, Bennett MI, et al. The epidemiology of chronic pain of predominantly neuropathic origin. Results from a general population survey. J Pain 2006;7:281-9
- Torrance N, Smith BH, Watson MC, et al. Medication and treatment use in primary care patients with chronic pain of predominantly neuropathic origin. Fam Pract 2007;24:481-5
- Dagenais S, Caro J, Haldeman S. A systematic review of low back pain cost of illness studies in the United States and internationally. Spine J 2008;8:8-20
- Rhee Y, Taitel MS, Walker DR, et al. Narcotic drug use among patients with lower back pain in employer health plans: a retrospective analysis of risk factors and health care services. Clin Ther 2007;29(Suppl):2603-12
- Vogt MT, Kwoh CK, Cope DK, et al. Analgesic usage for low back pain: impact on health care costs and service use. Spine (Phila Pa 1976) 2005;30:1075-81
- Ritzwoller DP, Crounse L, Shetterly S, et al. The association of comorbidities, utilization and costs for patients identified with low back pain. BMC Musculoskelet Disord 2006;7:72
- Engel CC, von Korff M, Katon WJ. Back pain in primary care: predictors of high health-care costs. Pain 1996;65:197-204
- McDermott AM, Toelle TR, Rowbotham DJ, et al. The burden of neuropathic pain: results from a cross-sectional survey. Eur J Pain 2006;10:127-35
- Doth AH, Hansson PT, Jensen MP, et al. The burden of neuropathic pain: a systematic review and meta-analysis of health utilities. Pain 2010;149:338-44
- Costa Lda CM, Maher CG, McAuley JH, et al. Prognosis for patients with chronic low back pain: inception cohort study. BMJ 2009;339:b3829
- Centers for Disease Control and Prevention, National Center for Health Statistics. National Health Interview Survey. 2008 http://www.cdc.gov/nchs/nhis.htm. 2005. [Last accessed 9 September 2010]
- Fishman PA, Goodman MJ, Hornbrook MC, et al. Risk adjustment using automated ambulatory pharmacy data: the RxRisk model. Med Care 2003;41:84-99
- National Comorbidity Survey (NCS) and National Comorbidities Survey Replication (NCS-R); 2007. http://www.hcp.med.harvard.edu/ncs/. [Last accessed 10 January 2011]
- Wang PS, Lane M, Olfson M, et al. Twelve-month use of mental health services in the United States: results from the National Comorbidity Survey Replication. Arch Gen Psychiatry 2005;62:629-40
- Ekman M, Jonhagen S, Hunsche E, et al. Burden of illness of chronic low back pain in Sweden: a cross-sectional, retrospective study in primary care setting. Spine (Phila Pa 1976) 2005;30:1777-85
- Wenig CM, Schmidt CO, Kohlmann T, et al. Costs of back pain in Germany. Eur J Pain 2009;13:280-6