Abstract
Objective:
To determine whether Medicare’s decision to cover routine administration of erythropoietin stimulating agents (ESAs) to treat anemia of end-stage renal disease (ESRD) has been a cost-effective policy relative to standard of care at the time.
Methods:
The authors used summary statistics from the actual cohort of ESRD patients receiving ESAs between 1995 and 2004 to create a simulated patient cohort, which was compared with a comparable simulated cohort assumed to rely solely on blood transfusions. Outcomes modeled from the Medicare perspective included estimated treatment costs, life-years gained, and quality-adjusted life-years (QALYs). Incremental cost-effectiveness ratio (ICER) was calculated relative to the hypothetical reference case of no ESA use in the transfusion cohort. Sensitivity of the results to model assumptions was tested using one-way and probabilistic sensitivity analyses.
Results:
Estimated total costs incurred by the ESRD population were $155.47B for the cohort receiving ESAs and $155.22B for the cohort receiving routine blood transfusions. Estimated QALYs were 2.56M and 2.29M, respectively, for the two groups. The ICER of ESAs compared to routine blood transfusions was estimated as $873 per QALY gained. The model was sensitive to a number of parameters according to one-way and probabilistic sensitivity analyses.
Limitations:
This model was counter-factual as the actual comparison group, whose anemia was managed via transfusion and iron supplements, rapidly disappeared following introduction of ESAs. In addition, a large number of model parameters were obtained from observational studies due to the lack of randomized trial evidence in the literature.
Conclusions:
This study indicates that Medicare’s coverage of ESAs appears to have been cost effective based on commonly accepted levels of willingness-to-pay. The ESRD population achieved substantial clinical benefit at a reasonable cost to society.
Introduction
Prior to 1989, the therapies for treatment of anemia in patients with end-stage renal disease (ESRD) were not effective, and patients were managed primarily by routine blood transfusions. However, frequent blood transfusions carried considerable risks, including infections, development of alloimmunization, and iron overloadCitation1,Citation2. In addition, management of anemia with transfusions is only transiently effectiveCitation3, and often resulted in lower achieved hemoglobin levels, at <8 g/dLCitation4,Citation5.
In 1989, erythropoietin stimulating agents (ESAs) were licensed in the United States for treatment of anemia associated with chronic renal failure, including patients who required dialysis. ESAs corrected anemia associated with kidney failure for most patients. ESAs eliminated the need for routine blood transfusions and greatly reduced occurrence of iron overload. Use of ESAs in clinical practice diffused very rapidly and became standard practice within a few years. So dramatic were the benefits of ESAs that economic issues were never raised. In particular, the decision to establish Medicare coverage for routine ESA administration among dialysis patients did not include assessment of cost effectiveness.
Previous cost-effectiveness studies have concluded that, in general, the use of ESAs to target patients to the indicated hemoglobin range of 10–12 g/dL would be cost effective compared with targeting patients to higher targetsCitation6,Citation7. However, no evidence exists whether coverage for routine administration of ESAs to treat the anemia of ESRD as a part of Medicare’s ESRD program has been a cost-effective policy option.
The analysis presented in this study posed a different question from that posed by earlier cost-effectiveness analyses. The authors asked what would happen to the total expenditures and quality-adjusted life-years (QALYs) if the practice of routine blood transfusions, which was standard of care prior to 1990, had been substituted for the actual practice of widespread use of ESAs.
Therefore, the primary objective of this analysis was to determine whether coverage for routine administration of ESAs to treat the anemia of ESRD as a part of Medicare’s ESRD program has been a cost-effective policy relative to standard of care at the time (i.e., routine blood transfusions). Making inferences on the cost effectiveness of various treatment options with ESAs in current clinical practice is outside of the remit of this study. The analysis entailed a historical comparison of clinical and economic outcomes in simulated ESRD patients treated with ESAs between 1995 and 2004 relative to similar (counterfactual) patients receiving routine blood transfusions.
Patients and methods
Study design
A Markov cohort model was developed for the US ESRD population to examine the retrospective cost effectiveness of ESAs relative to routine blood transfusions for the management of anemia. Perspective of the historical economic evaluation was the third party payer (Medicare) and therefore, only direct health service costs were considered.
The authors used summary statistics from the actual cohort of ESRD patients receiving ESAs between 1995 and 2004 to create a simulated cohort based on the ESRD population on December 31, 1994 (see ; depicted as the ESA cohort) that was compared to a similar simulated cohort who was assumed to rely solely on blood transfusions (transfusion cohort). The period between 1995 and 2004 was the focus of the analysis given data availability from the US Renal Data System (USRDS).
Table 1. Model inputs.
The starting cohort consisted of point-prevalent patient population at the end of 1994 ()Citation8. Incident patients for each year of analysis were added to the pool of point-prevalent population when patients survived 1 year of analysis and moved onto the next.
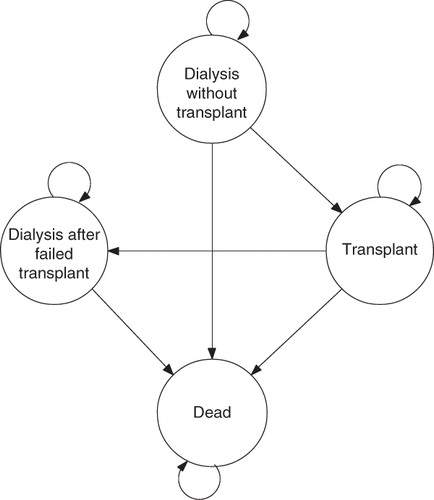
The model paralleled the natural course of ESRD, which requires patients to be maintained on life-long chronic dialysis until the patient dies or can be transplanted. While on chronic dialysis, greater than 90% of patients require treatment with an ESA, and remain on chronic treatment until transplant or deathCitation9. After transplantation, patients remain on transplant, die, or return to dialysis. The model structure captures the major health states that chronic dialysis patients can reside in, and also mimics historical economic model structures seen in the literatureCitation6,Citation7.
The model paralleled natural course of ESRD by cycling through four distinct states (). Patients could transition from initial state of ‘dialysis without a transplant’ to intermediate state of ‘renal transplant’ or final state of ‘death.’ Patients in intermediate state of renal transplant could also experience an acute graft failure, after which they transitioned to ‘dialysis with a failed transplant.’
Figure 1. Model schematic.
For the ESA cohort, rates of mortality, transplantation, and acute graft failure were obtained from USRDS for each year of analysis. Actual achieved population-level mean Hb concentrations were used to populate the ESA cohort. Rates were converted into state transition probabilities using standard conversion equationsCitation10. For the transfusion cohort, mortality, transplantation, and acute graft failure rates obtained from USRDS were adjusted based on the literature.
Evidence to populate the transfusion arm of the model was based on a systematic literature review on the relationship between Hb and clinical and resource-use outcomes. Model outcomes included life-years, quality-adjusted life-years (QALY), and treatment costs (total US payer costs in 2008 US$, unless otherwise stated). The incremental cost-effectiveness ratio (ICER) was relative to reference case of no ESA use in the transfusion cohort (Equation 1).
where CESA is average total costs in the ESA cohort, CTr is average total costs in the transfusion cohort, EESA is total effectiveness in the ESA cohort, and ETr is total effectiveness in the transfusion cohort.
Main modeling assumption
For the ESA cohort of the model, instead of relying on modeling assumptions, clinical and economic consequences of ESA therapy were based on summary statistics from the actual cohort of ESRD patients receiving ESAs between 1995 and 2004. Validity of this approach was evaluated by comparing the predicted number of clinical outcomes obtained from the model to the total numbers experienced by the US ESRD patient population. As the transfusion cohort was counterfactual by definition, the primary focus of the evidence review was to populate the model inputs for simulating the transfusion cohort of the model, which was assumed to rely solely on blood transfusions.
Systematic evidence review
A systematic review of the literature was performed to update the evidence review conducted by the National Institute for Health and Clinical Excellence (NICE) for the Health Technology Assessment of ESAs in the UK in 2006Citation11. The objective of this review was to identify any recent sources of evidence on the relationship between Hb and clinical as well as resource-use related outcomes. Literature searches were run in MEDLINE (using PubMed), EMBASE and Cochrane (Details of the literature review methodology and findings can be found in Appendix A).
The review identified 34 studies, which were conducted in patients with chronic kidney disease (both pre-dialysis and dialysis). The suitability of these studies for use in the economic evaluation model was assessed on the basis of broad-based inclusion criteria. In order of importance, studies had to meet the following conditions:
As the economic evaluation model assessed the retrospective cost effectiveness of ESAs in ESRD patients on dialysis, only studies that were conducted in dialysis patients were considered for inclusion (23 studies reported findings for patients on dialysis).
Eligible studies were those that reported findings by Hb ranges that corresponded to the mean population ranges considered in the model (nine studies reported findings by Hb ranges, none of which corresponded to those considered in the model).
Unfortunately, in terms of suitability for use in the model, none of the identified studies reported findings for dialysis patients by the Hb stratification required for the model. As a result, main sources of evidence closely paralleled the list of studies that were identified by the systematic review conducted by NICE in 2006Citation11.
Survival
Annual mortality rates for each of the three clinical states were obtained from USRDS (). To determine the annual mortality rate for patients who were not receiving ESAs, there is a notable absence of randomized trial information. In the absence of strong evidence to suggest otherwise, the risk of all-cause mortality comparing patients who were receiving ESAs versus those who were not was assumed to be equal among cohorts. This was supported by a recent meta-analysis conducted for a Canadian regulatory assessment of ESAs in chronic kidney disease (CKD), which showed that the relative risk of death was not statistically significantly different between the two patient groups (however the point estimate showed a 41% increase in the relative risk for patients who were not receiving ESAs [RR: 1.41 (95% CI: 0.81, 2.50)]) ()Citation12. In brief, the authors have taken a conservative approach for the base-case analysis, and have tested this in one-way and probabilistic sensitivity analyses.
Table 2. Model inputs: modeled event rates.
In the base-case analysis, risk of mortality associated with patients returning to dialysis following acute graft failure was 78% higher than for those who were wait-listed for a transplant on dialysis ()Citation13. The authors tested sensitivity of findings to this parameter in probabilistic analyses.
Quality of life
Quality of life is substantially reduced among people with ESRD compared to the general populationCitation14. An index measure of health-related quality of life such as health utility is a suitable measure to summarize overall effects of ESRD on patients. Utility measures preference of patients for states of health as a value ranging from 0 (dead) to 1 (best possible health). QALYs were calculated by multiplying the time spent by patients in each clinical state by utility value(s) associated with that state.
Different utility values were assigned to each of the three clinical states (). For patients on dialysis, utility values were estimated based on achieved hemoglobin levels of patients. Mean hemoglobin level for the US ESRD population increased from 10.3 g/dL in 1995 to 11.8 g/dL in 2004. Utility weights associated with these Hb ranges (<11 g/dL, and 11 to <12 g/dL) were calculated based on an observational study of health-related quality of life in chronic kidney disease patients. A recent study (in patients not on dialysis) examined the relationship between SF-36 subscales and hemoglobin levelsCitation15. Although 63 of the 229 patients with Hb levels <11 g/dL had levels <10 g/dL, the quality of life measures in the patients <10 g/dL were not significantly different, so the group was analyzed as one entity. The authors mapped the SF-36 subscales to the validated Beaver Dam conversionCitation16. The average utility score for patients with Hb <11 g/dL was 0.62 while it was 0.64 for patients with Hb between 11–12 g/dL.
Based on the results of the only randomized study that has evaluated quality of life in dialysis patients for the Hb ranges considered in the model, utility score for patients receiving transfusions was estimated to be 0.55Citation4. According to the study by Laupacis et al., utility associated with a functioning transplant was 0.77 whereas utility associated with a graft failure was 0.62Citation1Citation7.
Hospitalization
To date, no study has established a causal relationship between hemoglobin levels and the risk of hospitalization in dialysis patients. No randomized trial has investigated the relationship between risk of hospitalizations and hemoglobin levels in dialysis patients.
Observational data provided evidence that, even when controlling for the complex interactions of patient comorbidity and severity of disease, low hematocrit levels are associated with higher risk of hospitalization and length of hospital stay in dialysis patientsCitation18. However, evidence provided by these studies is based on cross-sectional data and is subject to potential bias as admitted by the authors.
Given the lack of randomized trial evidence, our base-case analysis assumed that the risk of hospitalization was similar for the ESA and transfusion arms of the model, thus taking a conservative approach to our base-case assumption.
In a sensitivity analysis, observational evidence was used to evaluate a scenario where lower Hb levels were associated with longer length of hospital stay in dialysis patients. In this analysis, mean number of annual hospital days was estimated based on the study by Xia et al.Citation19, which provided the number of hospital days by hematocrit levels and by diabetes diagnosis for hemodialysis patientsCitation19. Assuming that approximately 45% of dialysis patients had diabetes, we used an exponential function to estimate mean number of annual hospital days for hematocrit levels considered in this sensitivity analysis ().
Transplantation and acute graft failure
Transplantation and acute graft failure rates for the ESA cohort was available for each year of analysis from USRDS (). However, a different transplantation rate was applied to the transfusion cohort because a higher transfusion rate may be associated with a risk of becoming highly sensitized, which in turn may reduce likelihood of transplantation. In brief, there are adverse associations between blood transfusions and the development of high panel reactive antibody (PRA) levelsCitation8. Sensitized patients, with higher peak PRAs, may wait longer for a suitable kidney for transplantation compared to patients with lower PRAsCitation8. To account for the possibility that patients who are eligible to receive a transplant may be negatively affected by receiving a transfusionCitation20, the authors applied a 25% lower likelihood of transplantation for those treated without ESAs (). Sensitivity of these findings to this assumption, which paralleled a recent Canadian regulatory assessment, was evaluated in scenario and probabilistic analyses.
Transfusions and related adverse events
The model did not explicitly consider adverse events experienced in the ESA cohort because the costs and outcomes associated with these events accounted for in the survival and cost estimates obtained from USRDS.
Transfusion requirements for patients not receiving ESAs vary in the literature. The base-case analysis employed 0.50 units of transfused blood per month per patientCitation21 with 0.27Citation22 and 0.80 units per patient per monthCitation23 forming the lower and upper bounds of the scenario analyses around this parameter ().
Iron overload was a common complication in ESRD patients prior to the availability of ESAs. It was the result of hypo-proliferative erythroid marrow function coupled with need for transfusions to manage anemiaCitation24. In the base-case analysis, it was assumed that 10.4% of patients receiving transfusions experienced severe iron overload that required iron chelation therapy ()Citation25.
Current rates of viral and bacterial disease transmitted by blood transfusions are too low to measure. Additionally, the US does not have a surveillance mechanism documenting incidence and prevalence of transfusion-transmitted disease. The authors therefore relied on historical data from the literature to estimate the occurrence of bacterial and viral infections in addition to immunologic reactions associated with red cell transfusions. Given scarcity of the literature around these estimates, the base-case analysis excluded adverse events. In one scenario analysis, following mid-point risk estimates were assumed: one hepatitis B case per 250,000 units of transfused blood, one hepatitis C case per 150,000 units of transfused blood, and one case of delayed hemolytic reaction per 1000 units of bloodCitation26.
Resource use
USRDS provided per-patient-per-month costs for Medicare inpatient and outpatient services for all 10 years of analysis (). Costs were given for dialysis patients, patients with a transplant event within the year, patients with a functioning graft, and patients with a graft failure within the year. These costs were applied to the estimated number of patients within each clinical state to calculate total annual expenditures for the ESA cohort. Validity of this approach was evaluated by comparing the predicted cost estimate obtained from the model to the total Medicare inpatient and outpatient expenditures for US ESRD patient population.
The model did not explicitly consider different administration options for ESAs (subcutaneous versus intravenous) as the costs associated with these modes of administration were already accounted for in the cost estimates obtained from USRDS. To estimate costs associated with the transfusion cohort, same per-patient-per-month costs were used from USRDS but were adjusted to estimate costs for patients receiving transfusions. Cost adjustments involved removing the portion of total annual Medicare cost attributed to ESA use and replacing it by expenditures attributed to transfusion use during the same year (as explained below).
USRDS reported the portion of total annual Medicare inpatient and outpatient expenditures spent on ESAs and iron supplements. Percent of total inpatient and outpatient Medicare cost that was attributed to ESA units ranged from 6.6% in 1995 to 10.3% in 2004. Therefore, this portion of total cost was removed in the transfusion cohort because patients in this cohort did not receive any ESA units. Additionally, 50% of costs attributed to iron use were removed in the transfusion cohort since transfusion patients were assumed to be receiving approximately half the amount of iron as compared to patients receiving ESAs.
Mean number of hospital days was initially estimated based on hematocrit levels observed in the ESRD population. Similar to other cost adjustors, ESA-specific hospitalization expenditures were removed from the total annual figure in the transfusion cohort and replaced by expenditures associated with higher number of hospital days attributed to patients receiving transfusions and achieving lower levels of hematocrit (only in scenario analyses).
Further transfusion-specific expenditures were considered for the transfusion cohort. Transfusion-specific resource use items included red blood cell units, transfusion-related adverse events (only in scenario analyses), and iron chelation costs. Given large uncertainty around costs associated with administering red blood cell units from the provider perspective (e.g., surgical patients may require slightly different treatment with transfusion, specifically around preparation [acute vs. chronic], amount and monitoring than those patients on dialysis)Citation27, a conservative estimate was used and this parameter was subject to scenario and probabilistic analyses. All cost estimates are shown in . This model did not explicitly consider resource use implications of adverse events experienced in the ESA cohort under the assumption that these cost estimates were implicitly accounted for in estimates provided by USRDS.
Sensitivity analyses
Extensive sensitivity analyses were conducted to assess effect of varying baseline estimates within clinically plausible ranges. In particular, detailed scenario analyses were performed around the mortality and hospitalization estimate used in the base-case analysis. Additionally, frequency of iron overload in patients receiving transfusions, mean number of annual hospital days by hematocrit level, transplantation eligibility, and transfusion-related adverse events, as well as utility values, were evaluated in scenario analyses using ranges in . In one analysis, costs attributed to iron use were included for the transfusion.
Probabilistic sensitivity analyses were performed to test sensitivity of our findings to uncertainty inherent in the parameter inputs used. All parameters, except for those obtained from USRDS describing the actual ESRD patient population, were subject to probabilistic analyses. provides the distributions assigned to each variable considered in probabilistic analyses.
Results
Model validity
The Markov model was initialized with counts of the number of ESRD patients in each of the four modeled health states as of the end of 1994. Parameters derived from USRDS data were applied to the starting cohort for each annual cycle over a simulated 10-year period. The model predicted the point prevalent ESRD population in 2004 within 2% margin of error while total Medicare inpatient and outpatient expenditures for US ESRD patient population were predicted within 1% margin of error.
Costs
Between 1995 and 2004, total costs incurred by the ESRD patient population from the US Medicare perspective were estimated at $155.5 billion for the ESA cohort and $155.2 billion for the transfusion cohort.
Dialysis and transplant-related costs for the ESA cohort totaled $141.9 billion (, ). ESA units accounted for an additional $13.5 billion for the ESA cohort during the same period. Estimated dialysis and transplant-related costs for the transfusion cohort were $143.6 billion. Packed red blood cells accounted for an additional total of $6.3 billion for the transfusion cohort. Iron-overload treatment with iron chelation therapy was estimated to cost an additional $5.4 billion for this population.
Figure 2. Cost-effectiveness plane, showing the incremental costs and QALYs for ESAs vs. blood transfusions, each quadrant demonstrating the proportion of the probabilistic sensitivity analysis that would fall under the following categories: ESA therapy less costly and less effective (southwest quadrant), ESA therapy more expensive and less effective (southeast quadrant), ESA therapy more expensive and less effective (northwest quadrant), and ESA therapy more expensive and more effective (northeast quadrant).
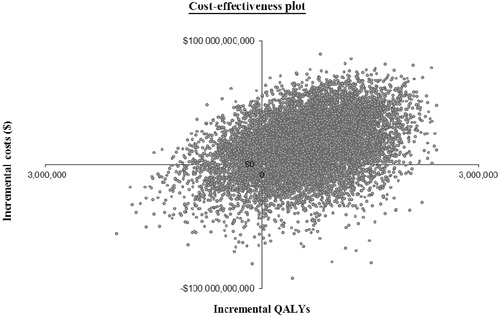
Table 3. Costs, effects, and cost effectiveness of ESAs as compared to blood transfusions*.
Outcomes
Estimated number of life-years recorded over 10 years was 3.74 million for the ESA cohort and 3.70 million for the transfusion cohort (, ). Predicted number of QALYs over the 10 years also differed between the two cohorts. While an estimated total of 2.56 million QALYs were tabulated in the ESA cohort, a total of 2.29 million QALYs were documented in the transfusion cohort.
Incremental analysis
Over the period between 1995 and 2004, patients in the ESA cohort incurred higher costs and gained substantially higher number of life-years and QALYs relative to the transfusion cohort (). ICER of ESAs as compared to transfusions was estimated to be $5139 per life-year gained and $873 per QALY gained.
Scenario analyses
shows sensitivity of the base-case ICER to different scenarios tested. The model was sensitive to the all-cause mortality estimate: when relative-risk of all-cause mortality was assumed to be higher for the transfusion cohort, the ESA cohort accrued higher QALYs and lower costs than the transfusion cohort between 1995 and 2004. Similarly, the model was sensitive to the hospitalization estimate used in the model. When the authors differentiated the length of hospital stay by Hb level for the transfusion arm of the model, patients in the ESA cohort incurred lower costs and gained substantially higher number of QALYs, resulting in estimated $50,840 savings per additional QALY gained.
Table 4. Results of one-way sensitivity analyses.
Transfusion-related adverse events
Including transfusion-related adverse events in the analysis resulted in estimated savings associated with ESAs treatment relative to transfusions of $50,045 per QALY gained.
Probabilistic sensitivity analyses
The probabilistic sensitivity analysis demonstrated the uncertainty in the findings. A total of 39% of 10,000 Monte Carlo probabilistic sensitivity analysis simulations resulted in decreased costs and increased QALYs for patients in the ESA cohort relative to the transfusion cohort (). In 28% of simulations, ESAs were less costly than transfusions while resulting in fewer QALYs. In only 6% of simulations, however, ESAs were more costly while yielding fewer QALYs. In 81% of simulations, use of ESAs was associated with an incremental cost-effectiveness ratio of less than $50,000 per additional QALY.
Figure 3. Cost-effectiveness acceptability curve.
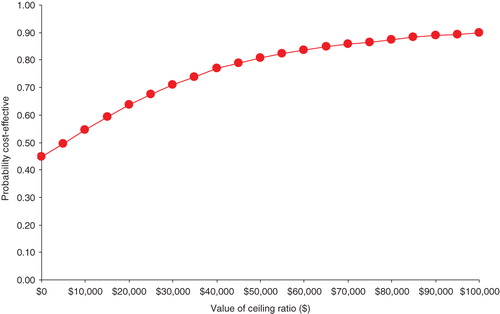
Figure 3 shows the cost-effectiveness acceptability curve indicating probability that the use of ESAs was cost effective compared with transfusions at different levels of a maximum acceptable threshold (ceiling ratio) for willingness-to-pay. At a willingness-to-pay threshold of $10,000 for each QALY gained, there is only about 50% probability that ESA arm of the model (ESA cohort) was cost effective as compared to its comparator (transfusion cohort). At $20,000 per QALY, probability that ESAs were cost effective relative to transfusions was estimated to be 0.64. Probability that ESAs were cost effective relative to transfusions increased to 0.81 at $50,000 per QALY.
Discussion
Since Medicare coverage of care for ESRD was implemented in 1973, dialysis treatments paid for by the federal government have extended the lives of hundreds of thousands of people. For the last two decades, an important benefit for ESRD patients covered by Medicare has been the administration of ESAs. However, as healthcare costs continue to increase, and federally funded healthcare sector comes under increasing pressure to contain costs, policymakers continue to question whether the rising level of investment in ESAs is an appropriate use of national resources.
In this analysis, the authors compared the historical clinical and economic consequences of ESRD-induced anemia management among patients receiving ESAs between 1995 and 2004 to a simulated cohort of patients receiving routine blood transfusions. The ESA cohort of patients incurred similar costs and achieved a substantially higher number of life-years and QALYs relative to the transfusion cohort. Accounting for the uncertainty in parameter estimates, probabilistic sensitivity analyses showed that the use of ESAs relative to transfusions was considered to be cost effective at a commonly used willingness-to-pay threshold of $50,000 or less for each additional QALY gained in the ESRD populationCitation28–30. This result suggests that introducing routine administration of ESAs to treat the anemia of ESRD as a part of Medicare’s ESRD program has been a cost-effective policy option for the US.
Main limitations in this study include the need to rely on observational studies due to the few randomized studies that have been conducted in the 20-year history of ESA therapy. Ironically, for a drug perceived as greatly enhancing quality of life, there are virtually no comprehensive studies examining this topic. The authors identified no single study that provided utility estimates for all health states considered in this analysis. Consequently, the model relied on combining evidence from a number of studies with different designs and, more importantly, from different time points. Given that population mean Hb levels increased substantially over the course of last two decades, utility values reported in the identified studies may well be a reflection of the underlying population Hb levels, instead of providing an accurate picture of the quality of life implications of ESRD-related health states. This analysis attempted to account for this potential inconsistency in the evidence base through scenario and probabilistic sensitivity analyses around all utility parameters.
This model was counter-factual in the sense that the actual comparison group, whose anemia was managed via transfusion and iron supplements, rapidly disappeared following introduction of ESAs. Had ESAs not been invented, it is reasonable to believe that the process and technology of care for the anemia of ESRD would have evolved over time. To address this issue, this study design took a conservative approach to assumptions concerning Hb levels for the transfusion cohort. According to the pivotal trials of ESAs from late 1980s, patients receiving transfusions achieved mean hemoglobin concentrations of only 7–8 g/dLCitation21. However, the authors assumed that transfusion patients would have achieved mean hemoglobin concentrations of 8–9 g/dL during the first half of the analysis (1995–1999) and 9–10 g/dL during the second half of the analysis (2000–2004). This was a conservative approach to intentionally favor the transfusion arm of the model by assigning the benefits associated with increased Hb levels while maintaining the same level of transfusions across years.
Patients who did not need to receive ESAs (which is less than 10%) due to lack of medical need were not separately considered in our modelCitation9. Consequently, the utility value assigned to the ‘no ESA’ state of the model may slightly underestimate the health state preferences of patients in the transfusion arm. Due to the lack of data availability on this subgroup of patients, the authors were not able to separate out these patients from the analysis; however, as reported by USRDS, this subgroup was included in the overall ESRD population statistics used in the aggregate-level model. Hence, the overall estimates on the costs and benefits of ESA therapy were based on the aggregate of ESRD patients who received dialysis during the analysis years.
Although recent randomized trials suggested an increased cardiovascular event and mortality risk associated with targeting high levels of Hb, these studies did not indicate that the FDA-approved label dosing regimens of ESAs resulted in increased mortality riskCitation31–33. At a population mean of 11.8 g/dL, the Hb ranges considered in this analysis were well within the guidelines of the Kidney Disease Outcomes Quality Initiative of the National Kidney FoundationCitation34.
Furthermore, the model did not explicitly consider the potential risk of cardiovascular events in high Hb levels because the costs and outcomes associated with these events accounted for in the survival and cost estimates obtained from USRDS.
This model evaluated the robustness of the main findings to extensive sensitivity analyses and found that the model was sensitive to the mortality estimate used in the base-case analysis. In the base case, relative risk of all-cause mortality was the same for both cohorts. This base-case estimate was consistent with randomized trial evidence in the literature. When relative risk of all-cause mortality was assumed to be higher for the transfusion cohort, however, the ESA cohort incurred lower costs and gained more QALYs than those in the transfusion cohort, unpredictably favoring the transfusion cohort in terms of the incremental cost-effectiveness ratio.
Anemia management is very complex, with almost 90% of patients with ESRD showing large fluctuations in their hemoglobin levels relative to target ranges over a 6-month periodCitation35. An estimated 40% of patients have large fluctuations in hemoglobin levels, which may represent hemoglobin variability, intercurrent morbidity events, or overcorrection of low hemoglobin levels. Treatment of patients that are extremely hyporesponsive to ESAs represents a particular challenge. In this group, it is recommended to not administer higher doses and to instead use the lowest dose that will maintain a hemoglobin level sufficient to avoid the need for recurrent transfusions. Hb levels should continue to be monitored, and if responsiveness improves, dose adjustments should be made according to recommended guidelines. Otherwise, ESAs should be discontinued if responsiveness does not improve and the patient needs recurrent transfusions. Further research is needed to investigate whether the judicious use of blood transfusions in this small and carefully targeted population may be beneficial to the patients, as well as being clinically and economically feasible.
Recent well-designed randomized controlled trials of pre-dialysis CKD patientsCitation32,Citation33 have indicated the need to balance trade-offs in clinical practice – namely the potential risk of cardiovascular events versus the improved quality of life in patients receiving ESAs. However, the findings of these pre-dialysis trials are not generalizable to the ESRD population because the Hb levels as described in this economic analysis have not been associated with safety concerns. Additionally, dosing strategies attempting to achieve unique rates of change, absolute levels of Hb, or both, would alleviate the potential risk of cardiovascular events, yet conserve benefits such as improvements in quality of lifeCitation36. From an economic perspective, it is valuable to follow labeled dosing recommendations, especially with the small population of hyporesponsive patients that may not attain an Hb level within the 10–12 g/dL range.
Conclusions
In many nations, cost-effectiveness analysis is an important element in decisions about the appropriate use of new medical technology. Rapid adoption of ESAs in the US was based solely on the clinical benefit relative to routine blood transfusions. The analysis presented here simulates a comparative effectiveness study of ESAs relative to the standard of care, although it is counter-factual in the sense that blood transfusion as a standard of care was rapidly supplanted by the superior technology. From these results, Medicare’s decision to cover ESAs appears to have been both medically appropriate, and also did not increase costs; the ESRD population achieved substantial clinical benefit at a very reasonable cost to society.
Transparency
Declaration of funding
This study was sponsored by Amgen, Inc.
Declaration of financial/other relationships
M.G. is a full-time employee of Amgen Inc. At the time of developing this manuscript, H.N. and G.deL. were full-time employees of the United BioSource Corporation who were paid consultants to Amgen Inc. for the development of the economic evaluation model and the manuscript. G.deL. and C.H. are visiting scientists of the United BioSource Corporation. B.C., W.M., and A.H. received honorariums from Amgen Inc. for the validation of the Excel model and analysis.
Acknowledgments
Dikran Toroser, PhD, (Amgen) provided editorial support.
References
- Goodnough LT, Brecher ME, Kanter MH, et al. Transfusion medicine. First of two parts – blood transfusion. N Engl J Med 1999;340:438-47
- Mossey RT, Sondheimer J. Listeriosis in patients with long-term hemodialysis and transfusional iron overload. Am J Med 1985;79:397-400
- Eschbach JW, Egrie JC, Downing MR, et al. Correction of the anemia of end-stage renal disease with recombinant human erythropoietin. Results of a combined phase I and II clinical trial. N Engl J Med 1987;316:73-8
- Canadian Erythropoietin Study Group. Association between recombinant human erythropoietin and quality of life and exercise capacity of patients receiving haemodialysis. BMJ 1990;300:573-8
- Churchill DN, Taylor DW, Cook RJ, et al. Canadian Hemodialysis Morbidity Study. Am J Kidney Dis 1992;19:214-34
- Clement FM, Klarenbach S, Tonelli M, et al. An economic evaluation of erythropoiesis-stimulating agents in CKD. Am J Kidney Dis 2010;56:1050-61
- Tonelli M, Winkelmayer WC, Jindal KK, et al. The cost-effectiveness of maintaining higher hemoglobin targets with erythropoietin in hemodialysis patients. Kidney Int 2003; 64:295-304
- USRDS. 2008 Annual Data Report; 2008 Contract No.: Document Number
- USRDS. 2005 Annual Data Report; 2005 Contract No.: Document Number
- Fleurence RL, Hollenbeak CS. Rates and probabilities in economic modelling: transformation, translation and appropriate application. Pharmacoeconomics 2007;25:3-6
- National Institute for Health and Clinical Excellence, CG39 Anaemia management in chronic kidney disease: full guideline, September 2006
- Tonelli MK, Wiebe N, Shrive F, et al. Erythropoiesis-Stimulating Agents for Anemia of Chronic Kidney Disease: Systematic Review and Economic Evaluation. Ottowa: Canadian Agency for Drugs and Technologies in Health; 2008 Contract No.: Document Number
- Rao PS, Schaubel DE, Jia X, et al. Survival on dialysis post-kidney transplant failure: results from the Scientific Registry of Transplant Recipients. Am J Kidney Dis 2007;49:294-300
- Evans RW, Manninen DL, Garrison LP, Jr et al. The quality of life of patients with end-stage renal disease. N Engl J Med 1985;312:553-9
- Finkelstein FO, Story K, Firanek C, et al. Health-related quality of life and hemoglobin levels in chronic kidney disease patients. Clin J Am Soc Nephrol 2009;4:33-8
- Fryback DG, Lawrence WF, Martin PA, et al. Predicting Quality of Well-being scores from the SF-36: results from the Beaver Dam Health Outcomes Study. Med Decis Making 1997;17:1-9
- Laupacis A, Keown P, Pus N, et al. A study of the quality of life and cost-utility of renal transplantation. Kidney Int 1996;50:235-42
- Collins AJ, Li S, St Peter W, et al. Death, hospitalization, and economic associations among incident hemodialysis patients with hematocrit values of 36 to 39%. J Am Soc Nephrol 2001;12:2465-73
- Xia H, Ebben J, Ma JZ, et al. Hematocrit levels and hospitalization risks in hemodialysis patients. J Am Soc Nephrol 1999;10:1309-16
- Karpinski M, Pochinco D, Dembinski I, et al. Leukocyte reduction of red blood cell transfusions does not decrease allosensitization rates in potential kidney transplant candidates. J Am Soc Nephrol 2004;15:818-24
- Eschbach JW, Abdulhadi MH, Browne JK, et al. Recombinant human erythropoietin in anemic patients with end-stage renal disease. Results of a phase III multicenter clinical trial. Ann Intern Med 1989;111:992-1000
- Nissenson AR, Korbet S, Faber M, et al. Multicenter trial of erythropoietin in patients on peritoneal dialysis. J Am Soc Nephrol 1995;5:1517-29
- Remak E, Hutton J, Jones M, et al. Changes in cost-effectiveness over time. The case of epoetin alfa for renal replacement therapy patients in the UK. Eur J Health Econ 2003;4:115-21
- Eschbach JW, Adamson JW. Iron overload in renal failure patients: changes since the introduction of erythropoietin therapy. Kidney Int Suppl 1999;69:S35-43
- Hakim RM, Stivelman JC, Schulman G, et al. Iron overload and mobilization in long-term hemodialysis patients. Am J Kidney Dis 1987;10:293-9
- Schreiber GB, Busch MP, Kleinman SH, et al. The risk of transfusion-transmitted viral infections. The Retrovirus Epidemiology Donor Study. N Engl J Med 1996; 334:1685-90
- Shander A, Hofmann A, Ozawa S, et al. Activity-based costs of blood transfusions in surgical patients at four hospitals. Transfusion 2010;50:753-65
- Lee CP, Chertow GM, Zenios SA. An emperic estimate of the value of life: updating the renal dialysis cost-effectiveness standard. Value Health 2009;12:80-7
- Shiroiwa T, Sung YK, Fukuda T, et al. International survey on willingness-to-pay (WTP) for one additional AQLY gained: what is the threshold of cost effectiveness? Health Econ 2010;19:422-37
- Menzin J, Lines LM, Weiner DE, et al. A review of the costs and cost effectiveness of interventions in chronic kidney disease: implications for policy. Pharmacoeconomics 2011;29:839-61
- Drueke TB, Locatelli F, Clyne N, et al. Normalization of hemoglobin level in patients with chronic kidney disease and anemia. N Engl J Med 2006;355:2071-84
- Pfeffer MA, Burdmann EA, Chen CY, et al. A trial of darbepoetin alfa in type 2 diabetes and chronic kidney disease. N Engl J Med 2009;361:2019-32
- Singh AK, Szczech L, Tang KL, et al. Correction of anemia with epoetin alfa in chronic kidney disease. N Engl J Med 2006;355:2085-98
- KDOQI Clinical Practice Guideline and Clinical Practice Recommendations for Anemia in Chronic Kidney Disease: 2007 Update of Hemoglobin Target. Available at: http://www.kidney.org/professionals/KDOQI/guidelines_anemiaUP/guide1.htm. Accessed on: November 9, 2011
- Ebben JP, Gilbertson DT, Foley RN, et al. Hemoglobin level variability: associations with comorbidity, intercurrent events, and hospitalizations. Clin J Am Soc Nephrol 2006;1:1205-10
- Marsden PA. Treatment of anemia in chronic kidney disease – strategies based on evidence. N Engl J Med 2009;361:2089-90
- Lee H, Manns B, Taub K, et al. Cost analysis of ongoing care of patients with end-stage renal disease: the impact of dialysis modality and dialysis access. Am J Kidney Dis 2002;40:611-22
- Cantor SB, Hudson DV, Jr., Lichtiger B, et al. Costs of blood transfusion: a process-flow analysis. J Clin Oncol 1998;16:2364-70
- Payne KA, Desrosiers MP, Caro JJ, et al. Clinical and economic burden of infused iron chelation therapy in the United States. Transfusion 2007;47:1820-9
- Coyle D, Lee KM, Fergusson DA, et al. Cost effectiveness of epoetin-alpha to augment preoperative autologous blood donation in elective cardiac surgery. Pharmacoeconomics 2000;18:161-71