Abstract
Objective:
To calculate annual cost per treated patient of tumor necrosis factor (TNF) inhibitors etanercept, adalimumab, and infliximab for common approved indications, based on actual TNF-inhibitor use in clinical practice.
Methods:
Adults with ≥1 claim for etanercept, adalimumab, or infliximab between January 2005 and March 2009 were identified from the IMS LifeLink™ Health Plan Claims Database. Patients new to therapy or continuing therapy (i.e., a prior claim for a TNF-inhibitor) were analyzed separately. Included patients had been enrolled from 180 days before the first TNF-inhibitor claim (index date) through 360 days after the index date and had a diagnosis during the pre-index period for rheumatoid arthritis, psoriasis, psoriatic arthritis, or ankylosing spondylitis. Patients with Crohn’s disease, ulcerative colitis, or juvenile idiopathic arthritis were excluded. Annual costs were calculated using wholesale acquisition costs for the TNF-inhibitor and Medicare Physician Fee Schedule for drug administration. Costs from restarting or switching TNF-inhibitor therapy during the first year were included.
Results:
A total of 27,704 patients (11,528 new, 16,176 continuing) had claims for etanercept, adalimumab, or infliximab, most commonly (65%) for treatment of rheumatoid arthritis. The most commonly used agent was etanercept (14,777 patients; 53%), followed by adalimumab (6862 patients; 25%) and infliximab (6065 patients; 22%). Annual cost per treated patient was etanercept $14,873, adalimumab $17,766, and infliximab $21,256 across all indications. Annual cost per treated patient by disease was (etanercept/adalimumab/infliximab): rheumatoid arthritis ($14,314/$17,700/$20,390), psoriasis ($17,182/$17,682/$23,935), psoriatic arthritis ($15,030/$18,483/$24,974), and ankylosing spondylitis ($14,254/$16,925/$23,056). New and continuing patients showed similar results, with etanercept having the lowest costs.
Limitations:
This analysis is limited to three TNF-inhibitors and a US managed-care population.
Conclusions:
Based on this analysis of real-world use of TNF-inhibitors among patients in nationwide clinical practice settings, the annual TNF-inhibitor cost per treated patient was lowest for etanercept across all indications.
Introduction
Autoimmune disorders, such as rheumatoid arthritis, psoriatic arthritis, and ankylosing spondylitis, are characterized by pain, joint swelling, and, in severe cases, progressive destruction of joint tissue. Plaque psoriasis is a chronic autoimmune disorder that is characterized by red, scaly patches on the skin. Tumor necrosis factor inhibitors (TNF-inhibitors) have been shown to effectively reduce the signs and symptoms of these inflammatory conditionsCitation1–8. The most commonly prescribed TNF-inhibitors in the US, in descending order, are etanercept (Enbrel, a registered trademark of Amgen, Inc. (Thousand Oaks, CA)), adalimumab (Humira, a registered trademark of Abbott Laboratories (North Chicago, IL)), and infliximab (Remicade, a registered trademark of Centocor Ortho Biotech Inc. (Malvern, PA)).
Treatment guidelines and systematic reviews have concluded that efficacy is similar between TNF-inhibitors for the management of rheumatoid arthritisCitation1–4, psoriasisCitation5,Citation6, psoriatic arthritisCitation7, and ankylosing spondylitisCitation8. However, a limitation of these analyses is that much of the evidence was derived from short-term studies (i.e., 3–6 months of treatment), whereas chronic TNF-inhibitor therapy is usually required for these diseases. Adalimumab and infliximab are monoclonal antibodies and patients have been shown to develop neutralizing antibodies to these agents over timeCitation9, leading to decreased efficacy and the need for dose escalationCitation10–14. Etanercept, which is not a monoclonal antibody, has not been shown to induce neutralizing antibodiesCitation9. In comparative studies, higher dose escalation rates were observed in patients with rheumatoid arthritis who were treated with infliximab or adalimumab compared with etanerceptCitation13–16. However, similar clinical change scores were seen for etanercept, adalimumab, and infliximab, despite differences in dose-escalation patterns, suggesting that dose escalation may not be associated with greater effectivenessCitation9,Citation17–20.
Etanercept, adalimumab, and infliximab differ in their recommended dosing. Adalimumab is administered at 40 mg once every 2 weeks except in patients with psoriasis, who receive a loading dose of 80 mg and begin 40 mg biweekly treatment 1 week later; the dose frequency is increased to once weekly as needed for incomplete response. Infliximab is administered at 3–5 mg/kg with doses at 0, 2, and 6 weeks, and then every 6–8 weeks, depending on the indication; the frequency can be increased to every 4 weeks or the dosage strength can be increased up to 10 mg/kg as needed for incomplete response. Etanercept is administered at 50 mg once weekly except in patients with psoriasis, who receive 50 mg treatment twice weekly for the first 3 months, then once weekly; dose escalation is not included in the recommended dosing for etanercept.
Cost estimates based on recommended dosing instead of actual dosing may under-estimate the total cost of adalimumab or infliximab due to their variability in dose and possible dose escalations; analyses of actual claims data among patients with rheumatoid arthritis have reported that dose escalations for adalimumab and infliximab increase their drug costs relative to etanerceptCitation14–16,Citation21. Etanercept, adalimumab, and infliximab also differ in mode of administration; etanercept and adalimumab can be self-administered subcutaneously, whereas infliximab is an intravenous infusion that has additional drug administration costs.
Therefore, to compare the actual costs of therapy between TNF-inhibitors, it is important to identify the indication, differentiate patients who are new to TNF-inhibitor therapy from those who are continuing TNF-inhibitor therapy (to account for initial loading doses and subsequent dose escalations), and make comparisons based on actual (i.e., real-world) drug utilization in a large population over a time period that is sufficient to account for changes in dose. Because there is no evidence that the TNF-inhibitors differ in efficacy or effectiveness for their shared indicationsCitation1–8, a cost-minimization approach is suitable for analysis of their relative costs.
The objective of this cost analysis was to estimate annual TNF-inhibitor treatment and administration costs per treated patient in a commercially insured population in the US and determine if changes in TNF-inhibitor utilization, such as those that result from dose escalation, have a substantial influence on costs.
Patients and methods
Data source
This cost analysis estimated the annual drug product and administration costs of etanercept, adalimumab, and infliximab across the four adult indications for which all three TNF-inhibitors are indicated in the US: rheumatoid arthritis, psoriasis, psoriatic arthritis, and ankylosing spondylitis.
Analyses were based on data from the IMS LifeLink™ Health Plan Claims Database, which is a commercial database that comprises fully adjudicated medical and pharmaceutical claims for more than 78 million unique patients from 104 health plans across the US (∼16 million covered lives per year). Across the indications that were analyzed, etanercept, adalimumab, and infliximab represented more than 95% of the market for TNF-inhibitors. Certolizumab and golimumab were not included in the analysis because potential cohorts were small for these products.
The database includes inpatient and outpatient diagnoses (in ICD-9-CM format) and procedures (in current procedural terminology [CPT-4] and Healthcare Common Procedure Coding System [HCPCS] formats) and both retail and mail order prescription records. Available data on prescription records include the National Drug Code (NDC) as well as the quantity of the medication dispensed. Additional data elements include dates of service, demographic variables (age, gender, geographic region), product type (e.g., health maintenance organization [HMO], preferred provider organization [PPO]), payer type (e.g., commercial, self-pay), and eligibility dates related to plan enrollment and participation. Consistent with Health Insurance Portability and Accountability Act (HIPAA) requirements, identifying information was removed from patient records to maintain confidentiality.
Cohort selection
Claims analyzed for this study included services from July 1, 2004 through March 31, 2010. The study identification period was from January 1, 2005 through March 31, 2009; the identification period for each indication started no earlier than the first month after all three TNF-inhibitors had received FDA approval for the indication (). Because all three TNF-inhibitors had been approved for rheumatoid arthritis prior to 2005, the identification period for rheumatoid arthritis began on January 1, 2005 to use more current data with a comparable timeline to the other indications.
Table 1. FDA approval dates for each TNF-inhibitor by disease and start dates of identification periods.
In any given year, a health plan has a combination of newly diagnosed patients initiating TNF-inhibitor therapy and those continuing treatment with TNF-inhibitors; this analysis reflects this mix of patients and the costs to a health plan in a given year. Because the incidences of rheumatoid arthritis and other indications for TNF-inhibitor therapy are each less than 1%, data from multiple years were included to ensure an adequate sample size for this analysis. Thus, the analysis was not based on a single calendar year; instead, annual costs were calculated as the total costs for each patient in the first year after their index date.
The index date for each patient was the date of the first TNF-inhibitor claim in the identification period for that indication. The cohort included patients in the IMS LifeLink database who were at least 18 years of age at index; had at least one claim for adalimumab, etanercept, or infliximab during the identification period; and had an ICD-9 code for rheumatoid arthritis (714.0), psoriasis (696.1), psoriatic arthritis (696.0), ankylosing spondylitis (720.0), or a combination of two or more of these diagnoses during 180-days prior to the index date (the pre-index period). Patients were excluded from the analysis if they had an ICD-9 code for Crohn’s disease (555.xx), ulcerative colitis (556.xx), or juvenile idiopathic arthritis (714.3x) during the pre-index period. They were also excluded if they had invalid demographic data (e.g., missing age or gender), were ≥65 years old and were not enrolled in a Medicare Advantage (Medicare Risk) plan (due to incomplete claims information), received more than one TNF-inhibitor on the index date, or had a claim for the TNF-inhibitor prior to its FDA market approval for the related indication.
Patients were required to be continuously enrolled in the health plan from 180 days before through 360 days after their index date. The 180-day pre-index period was used to confirm disease indication and differentiate new from continuing patients. Patients were considered new patients if they did not have a claim for any TNF-inhibitor during their pre-index period. Patients with a claim for a TNF-inhibitor during their pre-index period were classified as continuing patients.
Study measures
Each dose was assumed to last until the next claim for that TNF-inhibitor and the daily dose was calculated as the amount dispensed or infused divided by the number of days until the next claim. For the last claim, the amount dispensed was divided by the days supply (if indicated on the claim) or the expected duration of potential clinical benefit to determine the daily dose. The expected duration of potential clinical benefit for the TNF-inhibitor was based on the dosing schedules in the US prescribing information: for etanercept, 7 days per 50 mg; for adalimumab, 14 days per 40 mg; for infliximab, 8 weeks per infusion. The duration of therapy was the time from the index date to the patient’s last prescription claim, plus the days supply (if indicated on the last claim) or expected duration of potential clinical benefit. Patients were excluded from the analysis if their calculated dose exceeded twice the maximum recommended dose.
A patient was considered to have discontinued treatment if they switched to another TNF-inhibitor or had a ≥45-day gap in index therapy after the end of the expected duration of potential clinical benefit for the most recent dose. Patients were considered persistent in a given month if they received a dose of the TNF-inhibitor in that month or were within the expected duration of potential clinical benefit from the most recent dose.
Standardized expenditures were calculated based on the quantity of each TNF-inhibitor used (mg), the cost per milligram of each agent, and associated drug administration costs. The net cost for each TNF-inhibitor claim was calculated based on the wholesale acquisition cost ($452.44 for 50 mg of etanercept, $896.35 for 40 mg of adalimumab, and $710.12 for 100 mg of infliximab as of September 14, 2011, excluding discounts, rebates, and other price concessions), deducting the amount covered by an estimated patient copayment ($25), and adding an estimated dispensing fee ($2.50). Thus, the weekly costs at the minimum labeled doses for maintenance treatment, without administration costs, would be $429.94 for etanercept, $436.93 for adalimumab, and $257.86 for infliximab (for three vials administered every 8 weeks). Administration costs for etanercept, adalimumab, and infliximab were based on June 2011 Medicare fee schedules (which were unchanged as of September 2011) for subcutaneous injections and intravenous infusions. It was assumed that a provider administered the first subcutaneous injection ($23.10) and then patients self-administered subsequent subcutaneous treatment (no cost) for the remaining duration. Intravenous administration costs for infliximab were based on the assumption that all infusions were 2 h, which was validated against the distribution of administration times from CPT-4 codes in the LifeLink data. Thus, infusion fees for one initial hour ($146.44) and one subsequent hour ($31.26) were applied to each infusion.
The cost per treated patient for each TNF-inhibitor was calculated as the total expenditures divided by number of treated patients. Cost per treated patient was analyzed across all indications and within the following groups according to the eligible diagnoses that were reported in the 180-day pre-index period: (1) rheumatoid arthritis alone; (2) psoriasis alone; (3) psoriatic arthritis alone; (4) ankylosing spondylitis alone; (5) both rheumatoid arthritis and psoriatic arthritis; (6) psoriasis and rheumatoid arthritis and/or psoriatic arthritis; and (7) ankylosing spondylitis and any other indication (rheumatoid arthritis, psoriasis, and/or psoriatic arthritis).
Costs of medications other than the three TNF-inhibitors were not included in this analysis. The TNF-inhibitor treatment costs of restarting the index TNF-inhibitor or switching to a non-index TNF-inhibitor after discontinuation (secondary costs) were included in the total expenditures and cost estimates. Secondary TNF-inhibitor costs were accumulated between the date of discontinuation and the date of 1-year follow-up from the index date. The mean monthly dosing and percentage of patients who switched to another TNF-inhibitor or restarted the index TNF-inhibitor were estimated for each TNF-inhibitor within each diagnosis sub-cohort. Secondary TNF-inhibitor costs were added to the index TNF-inhibitor’s total cost.
Results
Patient demographics and treatment characteristics
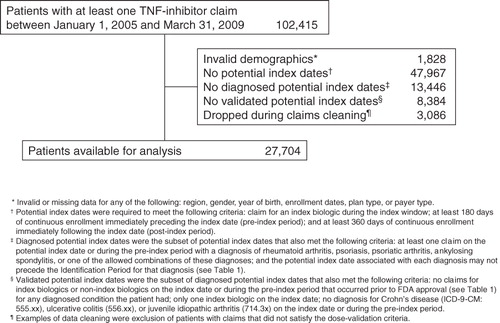
Of the 27,704 adult patients with a claim for a TNF-inhibitor within the identification periods in the LifeLink database (), the percentages of patients with diagnoses during the pre-index period were as follows: 65% rheumatoid arthritis; 11% psoriasis; 13% psoriatic arthritis; 5% ankylosing spondylitis; 1% rheumatoid arthritis and psoriatic arthritis; 2% psoriasis and rheumatoid arthritis and/or psoriatic arthritis; and 2% ankylosing spondylitis and any other indication.
Figure 1. Patient selection flowchart.
Patient demographics and treatment characteristics are summarized for all indications combined in , and by separate indications in the Appendix. The most commonly used agent across all indications was etanercept (14,777 patients; 53%), followed by adalimumab (6862 patients; 25%) and infliximab (6065 patients; 22%). Mean patient age for each treatment was between 43–52 years. Across all indications, 65% of patients were female; by indication, 76%, 42%, 45%, and 30% of patients with rheumatoid arthritis, psoriasis, psoriatic arthritis, and ankylosing spondylitis, respectively, were female. Most patients (86%) were commercially insured, and most of those patients were enrolled in a preferred provider organization (PPO; 59%) or a health maintenance organization (HMO; 22%). A total of 11,528 (42%) patients were new to TNF-inhibitor therapy and 16,176 (58%) were continuing TNF-inhibitor therapy.
Table 2. Patient demographics and treatment characteristics for patients receiving TNF-inhibitor therapy (all indications).
TNF-inhibitor costs: All patients
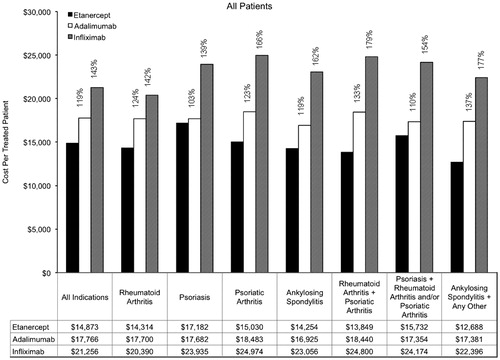
Annual costs per treated patient are provided overall and by indication in . Across the indications, the annual cost per treated patient was $14,873 for etanercept, $17,766 for adalimumab, and $21,256 for infliximab. Among patients with rheumatoid arthritis, the annual cost per treated patient was $14,314 for etanercept, $17,700 for adalimumab, and $20,390 for infliximab. Among patients with psoriasis, the annual cost per treated patient was $17,182 for etanercept, $17,682 for adalimumab, and $23,935 for infliximab. Annual costs of TNF-inhibitor treatment were lowest for etanercept for each of the other indications as well.
Table 3. Annual costs per treated patient by indication and treatment group for All Patients (New and Continuing TNF-Inhibitor Therapy).
Compared with etanercept, the annual cost per treated patient for infliximab was 43% greater (relative cost, 143%) and the annual cost per treated patient for adalimumab was 19% greater (relative cost, 119%) for all indications (). The range of relative costs per treated patient across individual indications and combinations of indications was from 103–137% for adalimumab relative to etanercept and from 139–179% for infliximab relative to etanercept.
Figure 2. Annual cost per treated patient by indication (all patients). Percentages are provided for the relative costs of adalimumab compared with etanercept, and for infliximab compared with etanercept.
By the end of the first year after the index date, 5221 of 11,528 new patients (45.3%) and 9463 of 16,176 continuing patients (58.5%) remained persistent on their index TNF-inhibitor therapy. Of the patients who discontinued their index TNF-inhibitor therapy for at least 45 days, we estimated that 53.4% restarted that therapy and 17.2% switched to another TNF-inhibitor within 360 days of discontinuation. Across all indications, secondary TNF-inhibitor cost in the first year accounted for $2621 (17.6%) of the etanercept cost per treated patient, $2380 (13.4%) of the adalimumab cost, and $1504 (7.1%) of the infliximab cost. Despite adding a more expensive secondary TNF-inhibitor (adalimumab or infliximab) to etanercept switchers, the cost per treated patient for etanercept was the lowest. Using only index TNF-inhibitor medication, etanercept had the lowest cost per treated patient; the cost per treated patient for adalimumab was 26% (9–59% within each indication) higher than etanercept and infliximab was 61% (54–124% within each indication) higher than etanercept across the indications.
TNF-inhibitor costs: New patients
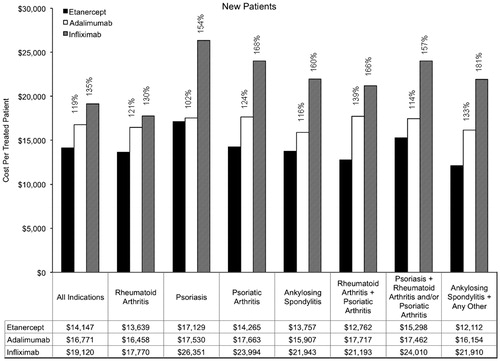
Annual costs among new patients are summarized in . Across the indications, the annual cost per treated patient for new patients was $14,147 for etanercept, $16,771 for adalimumab, and $19,120 for infliximab. Among new patients with rheumatoid arthritis, the annual cost per treated patient was $13,639 for etanercept, $16,458 for adalimumab, and $17,770 for infliximab. Among new patients with psoriasis, the annual cost per treated patient was $17,129 for etanercept, $17,530 for adalimumab, and $26,351 for infliximab. The relative costs within indications among new patients ranged from 102–139% for adalimumab compared with etanercept and from 130–181% for infliximab compared with etanercept.
Figure 3. Annual cost per treated patient by indication (new patients). Percentages are provided for the relative costs of adalimumab compared with etanercept, and for infliximab compared with etanercept.
TNF-inhibitor costs: Continuing patients
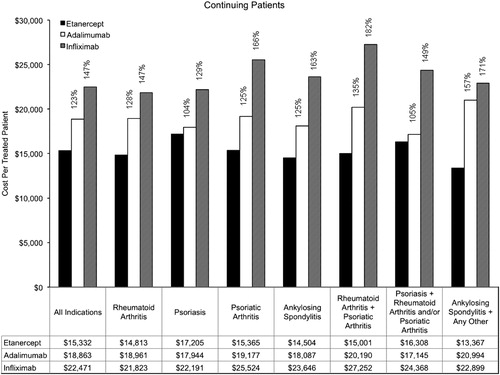
Annual costs among continuing patients are summarized in . Across the indications, the annual cost per treated patient for continuing patients was $15,332 for etanercept, $18,863 for adalimumab, and $22,471 for infliximab. Among continuing patients with rheumatoid arthritis, the annual cost per treated patient was $14,813 for etanercept, $18,961 for adalimumab, and $21,823 for infliximab. Among continuing patients with psoriasis, the annual cost per treated patient was $17,205 for etanercept, $17,944 for adalimumab, and $22,191 for infliximab. The relative costs within indications among continuing patients ranged from 104–157% for adalimumab compared with etanercept and from 129–182% for infliximab compared with etanercept.
Figure 4. Annual cost per treated patient by indication (continuing patients). Percentages are provided for the relative costs of adalimumab compared with etanercept, and for infliximab compared with etanercept.
Discussion
In this cost analysis that used real-world utilization data for TNF-inhibitors and accounted for the cost of restarting or switching treatment after discontinuation (total TNF-inhibitor costs), the annual cost per treated patient across all common adult indications was lower for etanercept ($14,873) than for adalimumab ($17,766) or infliximab ($21,256). Because each product was used most commonly in the treatment of rheumatoid arthritis (65% of patients), this indication had the largest contribution to the overall results. However, the rank order of etanercept <adalimumab <infliximab was maintained for the cost per treated patient within each indication studied: rheumatoid arthritis, psoriasis, psoriatic arthritis, ankylosing spondylitis, and combinations of these four diseases.
To our knowledge, this is the first cost analysis to use TNF-inhibitor utilization data from a nationwide population across the four approved disease indications that are shared by etanercept, adalimumab, and infliximab. This approach is likely to be valuable to payers, because they normally make formulary decisions for products across multiple indications. Several previous analyses that also used claims data to examine the relative costs or cost-effectiveness of TNF-inhibitor therapy were conducted only in patients with rheumatoid arthritisCitation15,Citation16,Citation21–23. In those studies, the costs of infliximab were up to 55% higher than the costs of etanercept and the costs of adalimumab were up to 12% higher than the costs of etanerceptCitation15,Citation16,Citation21–23. With the inclusion of multiple disease indications across a broad population in this analysis, the results (19% higher overall costs for adalimumab and 43% higher overall costs for infliximab relative to etanercept) were consistent with those of the previous studies.
In any given year, a health plan has a mix of new and continuing patients. New and continuing patients may have different utilization patterns and the ratio of new to continuing patients may influence the mean duration of prescriptions because continuing patients are more likely to have a longer days supply (i.e., 60 days instead of 30 days). In this analysis, the costs for new and continuing patients were analyzed separately. For all indications combined, new patients had 19% higher costs for adalimumab than etanercept and 35% higher costs for infliximab than etanercept; and continuing patients had 23% higher costs for adalimumab than etanercept and 47% higher costs for infliximab than etanercept. These findings were consistent with prior evidence that dose escalation of adalimumab (increased frequency) or infliximab (increased frequency or increased dosage strength) leads to greater increases in costs relative to etanercept with continued use of TNF-inhibitorsCitation13–16,Citation21. This suggests that a strategy of using etanercept first would be an effective way of managing costs for this class of medications.
Cost per treated patient reflects actual utilization patterns among treated patients and may provide different data than other cost metrics. A per-member per-year (or per-month) approach quantifies costs across the total member population, including untreated patients. Cost per prescription and cost per day (based on prescriptions) may differ from cost per treated patient because they do not include the number of prescriptions per person or refill gaps. In this analysis, total expenditures were higher for etanercept than for the other products across most indications because etanercept was used by more than twice as many patients (53%) compared with either adalimumab (25%) or infliximab (22%). Thus, it was important to account for these differences in utilization and calculate the cost per treated patient, which provides the most generalizable data to guide cost-minimization strategies.
A strength of this analysis was that dosing was based on real-world use patterns, and thus included the costs of higher doses that resulted from dose escalation over time. In clinical trial settings, dose and/or dose changes are pre-specified in the protocol. Use of claims data in this analysis permitted evaluation of actual doses and costs, which may differ substantially from recommended dosing regimens due to dose escalation, missed appointments, switching to other biologic therapies, or non-persistence with scheduled treatment. Each of these variations in dosing can substantially influence utilization and cost. Another strength of the analysis was the inclusion of post-discontinuation costs within the first year of the index date. Costs attributable to restarting the index therapy or switching to another TNF-inhibitor were added to the analysis to provide a more complete picture of the annual cost of TNF-inhibitor therapy, but did not significantly impact the magnitude or directionality of the overall cost estimates.
A potential limitation of the analysis was the inability to determine baseline disease severity from claims data, but it was assumed that, because of prior authorization criteria, the TNF-inhibitors were prescribed for patients with disease severity consistent with product labeling. The cost per treated patient included the drug use from restarting index therapy or switching to the other two TNF-inhibitors, but it did not include the cost of other medications or biologics. However, fewer than 5% of patients switched to other biologics in the first year after discontinuation of TNF-inhibitor therapy. The study was limited to a US-managed care population and may not be generalizable to other populations, such as non-US payers or patients at least 65 years of age who are not enrolled in a Medicare Risk plan. Estimates of drug acquisition costs did not include discounts, rebates, and other price concessions. Lastly, the absolute (and relative) costs of treatment may vary with changes to cost inputs. However, previous analyses that used other cost inputs derived similar relative costs of TNF-inhibitor treatmentCitation15,Citation16,Citation21–23.
Conclusions
In conclusion, the annual cost per treated patient for etanercept is lower than the annual cost per treated patient for adalimumab or infliximab across all common adult indications combined, within each disease (rheumatoid arthritis, psoriasis, psoriatic arthritis, or ankylosing spondylitis), and in patients with multiple indications when using real-world utilization from US claims data. This analysis of costs per treated patient from large claims databases may be useful to payers when they make formulary decisions about TNF-inhibitors.
Transparency
Declaration of funding
This study was supported by Amgen, Inc. USA.
Declaration of financial/other relationships
CW, SRG, and DJH have disclosed that they are employees of Amgen, Inc. and hold stock in Amgen, Inc. VS and SG have disclosed that they are employees of IMS Health, a company which received funding from Amgen to conduct the analysis. KMF has disclosed that she received consulting fees from Amgen, Inc.
Acknowledgments
Medical writing support was provided by Dikran Toroser and Larry Kovalick of Amgen, Inc. and by Jonathan Latham of PharmaScribe, LLC, on behalf of Amgen, Inc.
References
- Alonso-Ruiz A, Pijoan JI, Ansuategui E, et al. Tumor necrosis factor alpha drugs in rheumatoid arthritis: systematic review and metaanalysis of efficacy and safety. BMC Musculoskelet Disord 2008;9:52
- Donahue KE, Gartlehner G, Jonas DE, et al. Systematic review: comparative effectiveness and harms of disease-modifying medications for rheumatoid arthritis. Ann Intern Med 2008;148:124-34
- Kristensen LE, Christensen R, Bliddal H, et al. The number needed to treat for adalimumab, etanercept, and infliximab based on ACR50 response in three randomized controlled trials on established rheumatoid arthritis: a systematic literature review. Scand J Rheumatol 2007;36:411-7
- Singh JA, Christensen R, Wells GA, et al. A network meta-analysis of randomized controlled trials of biologics for rheumatoid arthritis: a Cochrane overview. CMAJ 2009;181:787-96
- Bansback N, Sizto S, Sun H, et al. Efficacy of systemic treatments for moderate to severe plaque psoriasis: systematic review and meta-analysis. Dermatology 2009;219:209-18
- Schmitt J, Zhang Z, Wozel G, et al. Efficacy and tolerability of biologic and nonbiologic systemic treatments for moderate-to-severe psoriasis: meta-analysis of randomized controlled trials. Br J Dermatol 2008;159:513-26
- Saad AA, Symmons DP, Noyce PR, et al. Risks and benefits of tumor necrosis factor-alpha inhibitors in the management of psoriatic arthritis: systematic review and metaanalysis of randomized controlled trials. J Rheumatol 2008;35:883-90
- McLeod C, Bagust A, Boland A, et al. Adalimumab, etanercept and infliximab for the treatment of ankylosing spondylitis: a systematic review and economic evaluation. Health Technol Assess 2007;11:1-158, iii–iv
- Moots RJ, Haraoui B, Matucci-Cerinic M, et al. Differences in biologic dose-escalation, non-biologic and steroid intensification among three anti-TNF agents: evidence from clinical practice. Clin Exp Rheumatol 2011;29:26-34
- Bartelds GM, Krieckaert CL, Nurmohamed MT, et al. Development of antidrug antibodies against adalimumab and association with disease activity and treatment failure during long-term follow-up. JAMA 2011;305:1460-8
- Agarwal SK, Maier AL, Chibnik LB, et al. Pattern of infliximab utilization in rheumatoid arthritis patients at an academic medical center. Arthritis Rheum 2005;53:872-8
- Berger A, Edelsberg J, Li TT, et al. Dose intensification with infliximab in patients with rheumatoid arthritis. Ann Pharmacother 2005;39:2021-5
- Wu E, Chen L, Birnbaum H, et al. Retrospective claims data analysis of dosage adjustment patterns of TNF antagonists among patients with rheumatoid arthritis. Curr Med Res Opin 2008;24:2229-40
- Etemad L, Yu EB, Wanke LA. Dose adjustment over time of etanercept and infliximab in patients with rheumatoid arthritis. Manag Care Interface 2005;18:21-7
- Gilbert TD Jr, Smith D, Ollendorf DA. Patterns of use, dosing, and economic impact of biologic agent use in patients with rheumatoid arthritis: a retrospective cohort study. BMC Musculoskelet Disord 2004;5:36
- Bullano MF, McNeeley BJ, Yu YF, et al. Comparison of costs associated with the use of etanercept, infliximab, and adalimumab for the treatment of rheumatoid arthritis. Manag Care Interface 2006;19:47-53
- Blom M, Kievit W, Kuper HH, et al. Frequency and effectiveness of dose increase of adalimumab, etanercept, and infliximab in daily clinical practice. Arthritis Care Res (Hoboken) 2010;62:1335-41
- Schabert VF, Bruce B, Ferrufino CF, et al. Disability outcomes and dose escalation in rheumatoid arthritis patients treated with tumor necrosis factor blockers: a comparative effectiveness analysis. Prague, Czech Republic: ISPOR European Congress, 2010
- Segal SD, Power DJ, Smith DB, et al. Comparative effectiveness analysis of TNF blockers in rheumatoid arthritis patients in US Community Practice. London: EULAR, 2011
- Bonafede RP, Chastek B, Becker L, et al. Comparative effectiveness analysis of TNF blockers in rheumatoid arthritis (RA) patients in a real-world setting. ISPOR 16th Annual International Meeting. Baltimore, MD: ISPOR 16th Annual International Meeting, 2011
- Ollendorf DA, Klingman D, Hazard E, et al. Differences in annual medication costs and rates of dosage increase between tumor necrosis factor-antagonist therapies for rheumatoid arthritis in a managed care population. Clin Ther 2009;31:825-35
- Wailoo AJ, Bansback N, Brennan A, et al. Biologic drugs for rheumatoid arthritis in the Medicare program: a cost-effectiveness analysis. Arthritis Rheum 2008;58:939-46
- Wu E, Chen L, Birnbaum H, et al. Cost of care for patients with rheumatoid arthritis receiving TNF-antagonist therapy using claims data. Curr Med Res Opin 2007;23:1749-59
Appendix
Tabla A1. Patient demographics and treatment characteristics by indication.