Abstract
Objectives:
The objective of this study was to obtain utilities, or preference-based quality-of-life values, from the Canadian general public, for potential health states experienced by immune thrombocytopenia (ITP) patients receiving either romiplostim (a new thrombopoietin mimetic agent) or ‘watch and rescue’ therapy. Utilities are needed to conduct a cost-utility analysis of romiplostim for formulary and reimbursement decisions.
Methods:
An electronic Time Trade-off (TTO) survey was developed and administered to a sample of the general public in Canada, with 12 distinct health states derived from two randomized clinical trials of romiplostim vs watch and rescue treatment. Two pilot tests assessed interpretability and respondent burden. In the final survey, each subject was administered the TTO for four randomly-selected health states. Descriptive statistics were computed for utility scores, and differences between health states were evaluated with an analysis of variance model.
Results:
Eight hundred and twenty-one adults completed the TTO survey. Mean age was 36.4 (SD = 15) years; 63% were female. Mean (SD) utility scores ranged from 0.476 (0.271) for the most severe health state (significant bleeding) to 0.633 (0.282) for the least severe health state depicting successful treatment with romiplostim. Statistical significance was found on the mean difference between the most severe health state and five other health states (p < 0.05). After adjusting utilities for matching Canadian demographic parameters, no substantial difference was found between original utility scores and adjusted scores.
Conclusions:
This study provides evidence of the Canadian general public’s preference for 12 ITP health states pertaining to romiplostim treatment or watch and rescue. This study had a number of limitations, the main ones being the lack of perfect match in demographics between this sample and the Canadian population, as well as the fact that the scenario descriptions were based on both published literature and expert opinion. Despite those limitations, the obtained utility scores may be used in cost-utility models of romiplostim as a treatment for ITP patients in Canada.
Introduction
Immune (Idiopathic) Thrombocytopenia (ITP) is an autoimmune disorder characterized by the production of anti-platelet antibodies resulting in low platelet count (thrombocytopenia) and an increased risk of bleedingCitation1–3. The annual incidence of ITP is estimated to range from 1.6–6.6 cases per 100,000 persons per year in the US and Europe, and is reported to be higher in women during the second and third decades of their lifeCitation4–8.
The clinical presentation of ITP is influenced by platelet counts. Patients with platelet counts above 50,000/µl are typically discovered incidentally; those with counts between 30,000–50,000/µl may experience easy bruising with minor trauma, while those with platelet counts of 10,000–30,000/µl may develop petechiae or ecchymoses, and those with counts <10,000/µl are at risk for excessive internal or mucocutaneous bleeding, including epistaxis, hematuria, gingival bleeding, and menorrhagiaCitation6,Citation9.
The Vincenza Consensus Conference recently developed standardized definitions for primary ITP (isolated thrombocytopenia with a peripheral blood platelet count <100,000/µL) and its phases (newly-diagnosed, persistent or chronic). Within 3 months of diagnosis, patients are considered newly-diagnosed. Persistent ITP lasts 3–12 months from diagnosis, and chronic ITP lasts more than 12 monthsCitation10. In adults, ITP is generally chronic, and the disease rarely resolves without any treatmentCitation2. The 5-year mortality rate for patients with severe ITP ranges from 2.2% for patients less than 40 years old to 47.8% for patients over 60 years of ageCitation11,Citation12. Patients with refractory ITP who don’t respond to these treatments have a 4.2-fold long-term increased risk of death (95% Confidence Interval 1.7–10.0)Citation13.
Treatment of patients with ITP is aimed at maintaining a safe platelet count level so that bleeding complications are avoidedCitation10,Citation14. Platelet counts below 30,000/µL are commonly accepted as the threshold for occurrence of major bleeding events among patients with ITPCitation12. Treatment includes oral corticosteroids (with prednisone as first line therapy for most patientsCitation2,Citation6), intravenous immunoglobulin (used in watch and rescue to achieve a rapid increase in platelet counts to avoid bleeding) and splenectomy (typically a second line therapy)Citation5.
A novel thrombopoiesis-stimulating protein, romiplostim, has been shown to significantly increase platelet counts in adults with chronic ITP before or after splenectomyCitation15. Clinical studies to date indicate that patients treated with romiplostim had fewer bleeding events than patients receiving placeboCitation15. For the majority of patients, romiplostim was well tolerated; most adverse events were mild-to-moderate in severity.
Economic evaluations of new treatments are often used as inputs to decision-making about resource allocation in healthcare. Furthermore, in many countries, including CanadaCitation16, evidence of cost-effectiveness is a requirement for inclusion of a new medication on a publicly-funded formulary. For reimbursement purposes to agencies such as the Canadian Agency for Drugs and Technologies in Health (CADTH), a cost utility analysis (CUA) is the most desirable form of analysis, especially in disease conditions that affect health-related quality-of-life (QoL)Citation17, as it is a type of cost effectiveness analysis which presents outcomes as quality-adjusted life-years (QALYs), taking into account the effects of morbidity (quality-of-life) and mortality. Utility scores are preference-based values of QoL that are required for the calculation of QALYs, as a QALY calculated for a year is determined by multiplying (utility for a certain state) by (time in that state) and accordingly utility scores are needed in the calculation of QALYs as they form half the equation.
Although ITP has been shown to affect health-related QoLCitation18,Citation19, direct measurement of utilities for ITP health states has been previously reported in only one other publication where members of the general public from the UK were surveyed. From a psychometric approach, both generic and disease-specific instruments have been used to document QoL in ITP. McMillan et al.Citation18 used the Short-Form 36 (SF-36) to assess the health status of adult patients with ITP in the US. The study reported that the health status of patients suffering from ITP was worse than that of the general US population, and worse than patients with hypertension, arthritis, or cancer. On the other hand, patients with ITP were better off than patients with congestive heart failure or those having a missing or paralyzed limbCitation18. Barnard et al.Citation20 developed disease-specific health-related QoL instruments for children with ITP and their parents. The child version includes 26 items related to five domains: disease, intervention, treatment side-effects, activity, and family. Mathias et al.Citation21 developed a disease-specific instrument for adults, the Immune Thrombocytopenic Purpura Patient Assessment Questionnaire (ITP-PAQ), which includes 44 items encompassing scales for physical health (symptoms, fatigue/sleep, bother, and activity scales), emotional health (psychological and fear), overall quality-of-life, social activity, women’s reproductive health, and work. Evidence of responsiveness, validity, and reliability for the ITP-PAQ has been documentedCitation22. A study using the ITP-PAQ reported that splenectomized patients had lower baseline QoL scores than non-splenectomized patients in seven of 10 scalesCitation23. Also, romiplostim-treated patients displayed statistically significant improvements on seven of 10 ITP-PAQ scales compared with placebo. Although these studies have documented QoL in ITP, they have not provided the health state utility values necessary for a CUA.
Two economic evaluations in ITP have applied utilities. In 2007, O’Brien et al.Citation24 published a study using a decision analytic model to evaluate the cost-utility of IVIg, anti-D, methylprednisolone, and prednisone in the treatment of acute childhood ITP. However, utilities were estimated with the Health and Activity Limitation Index, which was not specifically geared towards elicitation of utilities. The baseline utility for a child with ITP was estimated (0.9), and the disutility caused by hospitalization (0.2), medication side-effects (0.1), and intracranial hemorrhaging (0.32) was subtracted to characterize a patient’s final estimated utility value. Another study published by Kunz et al.Citation25 in 1996 also used a decision analytic model to evaluate the cost-utility of two ITP treatments, namely the protein A immunoadsorption column and splenectomy. This model was applied to an adult population of ITP patients. The utility value associated with being in an ITP state (0.88) was derived by pooling the results of a clinical study of ITP with the utility values of disease conditions believed to be similar to ITP, namely non-valvular atrial fibrillation and deep-vein thrombosis. Both of these studies have reported estimated utilities, but utilities were not directly measured in either study.
The objective of the present study was to measure health state utilities, as perceived by the general public in Canada, for potential health states experienced by ITP patients receiving either romiplostim or ‘watch and rescue’ therapy. The results will be used in future research to populate a CUA model for romiplostim.
Methods
Selection of utility source and measurement technique
According to CADTH, the Canadian Agency for Drugs and Technology in Health, the appropriate source of preferences for outcomes is the informed general publicCitation17. The rationale for eliciting utilities from the general public is based on the argument that since publicly funded healthcare is financed through the taxes collected from the general public, the preference of the taxpaying public should therefore be elicitedCitation26.
In order to determine respondent preferences from the general public, various given health states are described as scenarios, including their potential impact on a patient’s quality-of-lifeCitation27. Different approaches exist to measure utility scores for the given health states. These approaches can be categorized as either direct or indirect. Direct approaches, including the standard gamble and time trade-off (TTO), elicit utility scores by asking the respondents to answer preference-based questions. These measures are usually more sensitive than indirect instruments, such as the EQ-5D, which have been validated against these direct measures. Indirect measures are not appropriate when surveying the general population as they use questions on symptoms and activities specific to health states. When serving the general public, scenarios describing health states are created and presented to participants to measure their preferences, however those subjects cannot themselves describe symptoms and activities of the assumed health state. Among direct measures, the standard gamble is generally considered more difficult for respondents to comprehendCitation28,Citation29. Therefore, the TTO was selected for use in this study. In the TTO, the respondent is presented with two choices. The first is to live for a given length of time with the current condition, followed by immediate painless death. The other is to live a lesser number of years but in full health, followed by ‘instant painless death’. The duration of time in full health is adjusted until the person is indifferent between optionsCitation30.
Development of health states scenarios
To meet the need for constructing a pharmacoeconomic model that would be relevant for an economic evaluation of romiplostim vs watch and rescue, 12 health states were identified with the assistance of two clinical experts and one health economics expert. The health states were defined based on response to therapy, bleeding status, and presence of other adverse events. The 12 health states were ranked according to eight levels of severity, with consensus between the two clinical experts. This expert panel provided face validation for the content of the scenarios for all 12 health states, which was achieved through discussions.
Descriptors for the 12 health states were obtained from the ITP-PAQ instrument and from two randomized controlled clinical trials of romiplostim in which the ITP-PAQ was utilizedCitation23. The ITP-PAQ is a 44-item questionnaire, with some items only applicable for women and some items only for individuals that are employed. Each item uses a 5- or 7-point Likert-type response scale, yielding a potential of 87 items for use as descriptors for the text of the health states. Since it was cumbersome to use all 87 items in the description of the health states in the final questionnaire, we combined or eliminated descriptors according to clinician opinion, and by confirming that all selected descriptors had been measurably singled out as affecting patient quality-of-life for specific health states, by reviewing all the items with the clinicians in order to assess their potential importance in describing the effect of ITP, or its treatment, on the quality-of-life of patients with the condition. We also collapsed, in collaboration with the clinical experts, the response options used in the ITP-PAQ, which gauges the impact of a descriptor on patient quality-of-life, into three simplified categories: has an impact (all the time, most of the time), has no impact (never, rarely), and neutral (some of the time). This yielded nine descriptors and, with the help of the two clinical experts, the texts of the preamble (i.e. describing what ITP is and what it means to live with ITP) and the 12 health states were drafted and reviewed. The most frequently reported adverse events were joint pain, diarrhea, and nausea. In order to describe the impact of the nine retained items from the ITP-PAQ, the proportion of ITP patients responding to a specific descriptor was presented as based out of 100 people for ease of interpretation. For some items, the sample of respondents was small. Accordingly, when the frequency of participants was less than 6, the actual frequency was supplemented by ‘as many as’, since it was felt that the small sample size in these groups may have skewed the distribution of participants’ answers. This wording was added to reduce potential bias. The 12 health states and their relative ranking according to the clinical experts are presented in . Detailed description of the 12 health states are portrayed in , while presents the occurrence (out of 100 patients) of symptoms and feelings experienced by patients in each of the health states as reported with the ITP-PAQCitation22. Located in the Supplementary Appendix, Table A1 provides the exact transcription of the text used to describe the preamble and the 12 health states.
Table 1. Health states included in the study and associated ranking based on severity.
Table 2. Summary description by health states of treatment and percentage of subjects experiencing side-effects.
Table 3. Reporting by health state of percentage of subjects experiencing any feeling, difficulty, or interference of some sort due to their condition.
Time trade-off technique and its administration
Once health states were described in clear and succinct scenarios, the TTO instrument was administered to directly elicit utilities from members of the general public. Moreover, in order to facilitate the collection of data from the general public in a standard, yet efficient fashion while minimizing administrator bias, a computerized tool was developed to administer the TTO technique. That computerized tool was based on a proprietary software, hereafter referred to as the eQtool , developed for the purpose of eliciting health state utilities. The eQtool consisted of three sections; a first one beginning with a demographic questionnaire, a second describing the various health states, and a third one with condition-specific TTO questionnaires. The demographics section incorporated in the tool applied categories based on Statistics Canada parameters, where the time span offered was the difference between the age of the participant and life expectancy by gender for that age, retrieved from Statistics Canada. The TTO section consisted of the TTO questionnaire with a computerized ‘ping-pong’ type of interaction with the participant, where an individual was asked to choose between periods of either living for a given period of time in the health state of interest or a shorter period of time in full health (i.e., trade-off between quantity and quality-of-life). This back-and-forth, or ‘ping-pong’ interaction, was programmed for taking place on a computer screen and with the simple use of a mouse for pointing and clicking. The participant was presented the opportunity to choose between living in the given health state for a certain period or living in perfect health for half that period. Iif the participant accepted the short duration, a new duration, calculated as the mid-point between the minimum time and the previously offered time, was then offered. If the participant declined the offered duration, a new duration, calculated as the mid-point between the maximum time and the previously offered time, was in turn offered. The duration of the time in full health was adjusted, in a ‘ping-pong’ fashion to present the mid-points between the last duration offered and the previous one, until the person was indifferent between the two options. The TTO section consisted of the TTO questionnaire with a computerized ‘ping-pong’ type of interaction with the participant, where an individual was asked to choose between periods of either living for a given period of time in the health state of interest or a shorter period of time in full health (i.e., trade-off between quantity and quality-of-life). The eQtool, by fully computerizing the TTO, and incorporating a voice-over feature, also helps avoid intervention by an administrator, and hence may possibly reduce administrator bias by presenting the health state descriptor scenarios in a uniform fashion, and with the same tone. presents a screen shot of the TTO section of the eQTool while a screen shot of the first health state is included in .
Figure 1. Screenshot of the computerized time trade-off questionnaire: on the eQtool.
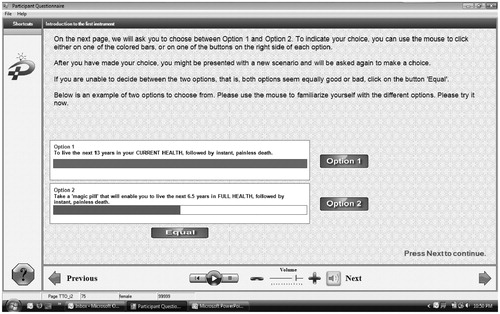
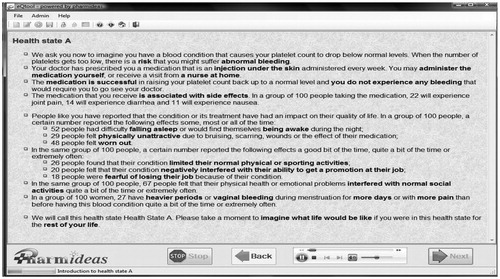
Figure 2. Screen shot of the eQTool® depicting Health State 1.
Since the description of the health states were developed based on the review of information and data from the romiplostim trials, with the help of expert clinicians and a health economics expert, we needed to assess their interpretability from members of the general public in order to avoid common pitfalls such as an inadequate reading level, the use of jargon, and ambiguity in the description of those health states. It was also expected that administering the eQtool with all 12 health states to every participant would likely result in unreliable results as the questionnaire would be too long and difficult to administer and participants would likely stop the interview before completion. Pilot testing was therefore done to test the ease of comprehension and administration of the computerized TTO questionnaire and to determine the maximum number of health states that was feasible to test in one sitting while still differentiating between health states. Based on the results of two pilot tests on a total sample of 126 participants from the general public, some modifications were made to the original presentation of the TTO survey. First, the appropriate number of health states to be evaluated in each survey was determined to be four out of the 12 health states randomly generated and inserted in the eQtool. Further, the survey was also reformatted so that each health state description would fit on a single screen. Finally, participants were presented the four health states they were randomly assigned and asked to rank them before starting the TTO survey.
Sample size calculation and recruitment of subjects
We expected differences in utility scores between two adjacent health states to be small, given that we had 12 health states, which did not cover the entire spectrum of possible health states and utility scores (i.e., [Full Heath = 1] and [Death = 0]). Hence, the sample size required to detect a reasonable difference between any two adjacent health states would be impractical. Accordingly, the study sample size was based on two requirements: first the achievement of high precision in the collection of the utility measures and second the ability to discriminate between at least two health states (e.g., extreme health states among the 12 included) using the non-parametric equivalent of the ANOVA test (the Kruskal-Wallis test).
For a sample size based on precision, we wished to be able to associate utilities with each health state with a precision of 1/8 of a standard deviation (SD), using the following formula:
where Z is the critical value of the normal distribution for α = 0.05, σ is the estimated SD (based on previous similar studies) and δ is the desired precision. This formula yields a required sample size of 246 usable answers for each health state or 271 answers if we consider a 10% rate for missing values. Four health states were selected randomly for each participant and based on a pre-defined algorithm in order to obtain an equal number of answers for each of the 12 health states. This facilitated the survey administration and helped safeguard the integrity of the collected information, but it led to an increase in the required sample size. All-in-all, a total of 813 participants were needed to be enrolled in this study as we needed 3 × 271 subjects, each subject being administered the equivalent of one-third of the scenarios. This sample size would provide an adequate power for the Kruskal-Wallis test for comparisons between health states.
Subjects were recruited through opportunistic sampling. Research associates went to community centers, universities, grocery stores, hair dresser’s salons, retirement homes, pharmacies, etc., and selected subjects who were asked to participate in a one-time, face-to-face interview performed in a quiet location. The subjects were recruited from the Greater Toronto Area (GTA), Ottawa and Hamilton. Subjects 18 years of age or older who were residents of Canada and able to understand English and provide written consent were considered for the interview. The purpose and procedures of the study were explained to the individuals who met the inclusion criteria. Those who were willing to participate were asked to provide their consent. The eQtool was administered by eight research associates, five in the Toronto-Hamilton corridor of Southern Ontario and three in the Ottawa area (Eastern Ontario). All eight research associates were trained on the administration of the tool, which included administering the tool to colleagues during supervised practice sessions. All information was presented to the subject on a laptop computer. Participants were assigned a unique study number. They were acquainted with the computer and the instrument, and instructed how to complete the questionnaires using the computer. For uniformity and clarity of presentation, a pre-recorded voice-over led the subjects through the eQtool. Once the health states were presented, the TTO based questions were administered. For each question, a set of possible answers was presented. Participants were able to terminate the interview at any point during the session. A central ethics review board reviewed and approved the protocol and the informed consent form.
Statistical analysis
Analyses were performed using SPSS 16.0 for windows and MS Excel®2003. Descriptive statistics, including measures of central tendency and dispersion (e.g., mean, median, variance, and standard deviation) were calculated to quantify health state utilities for each of the 12 health states. We analyzed ceiling and floor effects by assessing the number and proportion of responses falling above 0.9 or below 0.1. Due to a lack of normality of utility value distribution, we applied the non-parametric Kruskal-Wallis test to determine whether there was a statistical difference between any of the health state utility scores. One assumption for analyzing data with the Kruskal-Wallis test was that the samples were independent, and thus we needed answers from different participants for each of the health states. Since each participant would answer to four of the 12 health states, their answers could only be used for one of the four health states to comply with the independence of sample assumption of the Kruskal-Wallis test. Therefore, for each health state, a random sample of 65 answers was drawn, and the participants from whom the answers were drawn were removed from the pool of answers for the other health states. We then applied Dunn’s post-hoc test to identify which health states were statistically different. In order to investigate if demographic variables were predictive of the utility scores measured, multiple linear regression analyses were used, where utility scores from each health state were used as dependent variables in the regression equation, whereas potential confounding variables including age, education, employment status, and income level were used as independent variables. Direct standardization, using a method reported by SunCitation31, was applied in order to adjust utility values for cases where significant differences would be accounted in demographic characteristics in comparison to the general population. For each health state, percentages of utility values that fall in the 20 intervals of 0.05 in the range between 0–1 were calculated for each sub-category of the demographic characteristics. Those values were then multiplied by the Canadian census percentage associated with the same category and summed, generating a new percentage for each interval for the specific category. This new percentage was in turn multiplied by the mid-point of each interval and summed up in order to create the standardized health utility value. Furthermore, sensitivity analyses were conducted, after removing outliers from the dataset, in order to assess how the elicited utilities from a few participants, reporting extreme utility scores, influenced the results. Outliers were defined as utility scores greater than 0.95 or smaller than 0.05.
Results
A total of 821 participants were enrolled in this study, with ∼58.6% enrolled in the Greater Toronto Area (n = 481), 18.5% enrolled in the Hamilton area (n = 152), and 22.9% in the Ottawa area (n = 188). The ratio of female-to-male participants was 1.7:1. The average age was 36.4 years old (SD = 15 years), ranging from 22–80 years of age.
Compared to 2006 Statistics Canada Census estimates, our sample had significantly more females, a higher education level, higher employment rates, a lower rate of participants ‘not in the labor force’, younger age, fewer Whites, more Blacks, and more Asians than the national proportions. No significant differences were found for the proportion of the sample aged 35–44 years old, for the education category ‘Post-secondary degree, below baccalaureate’, nor for any income category ().
Table 4. Study demographics compared to Canadian national estimates.
Utility scores of the 12 health states, elicited using the eQtool applying the TTO technique, are presented in with their descriptive statistics. The mean utility scores for the 12 health states ranged from 0.476 to 0.633. graphically presents the mean utility scores for each of the 12 health states, along with their corresponding 95% confidence intervals. A ceiling effect, defined as a TTO score of at least 0.90 (on a scale from 0–1), was observed in utility scores (weighted average percentage of 16.3%, ranging from 9–23% for individual health states), as seen in . A floor effect, defined as a TTO score of at most 0.1 (on a scale from 0–1), was observed in a lesser proportion (6.7%, ranging from 4–10% for individual health states) of utility scores.
Figure 3. Mean utility scores elicited from the time-trade-off and their corresponding 95%CI. HS, health state; CI, confidence interval. For description of health states, please see .
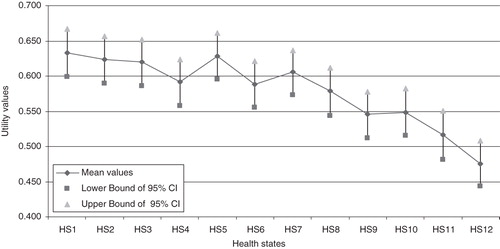
Table 5. Utility scores elicited from the time trade-off analysis.
Table 6. Utility scores: Floor and ceiling effects.
As there was no overlapping of the 95% confidence intervals (CI95) between some health states, there was an indication of significant statistical difference between those health states. The non-parametric Kruskal-Wallis test resulted in a χ2 value of 44.308 and a p-value < 0.001, Therefore, having confirmed a statistical difference between health states in terms of utility scores, we applied Dunn’s post-hoc test to identify the health states which were statistically different. Significant statistical differences were found at a level of significance of 0.05 between health state 12 (severe bleeding) and five other less severe health states (health states 1, 3, 5, 7, and 8).
A multiple linear regression test determined that employment was the only statistically significant predictor and for only one health state, HS6. No other significant coefficients were observed, indicating that the demographic variables analyzed did not predict the utility score for different health states and the results were not confounded by any demographic variable. However, since a statistically significant difference with demographic characteristics was found between our sample and the general population, direct standardization was applied for each demographic factor in order to adjust the results to both the Canadian population and selected urban areas where the study was conducted. Relative percentage differences between crude and adjusted utility values ranged from 0–6%, or 0–0.036 in absolute utility scores (mean overall absolute deviations from the Canadian population of 0.010 and 0.009 from the general population of urban areas surveyed, respectively). Results of standardized utilities are presented in .
Table 7. Adjusted utility scores to match general population using direct standardization.
A sensitivity analysis was performed to test the robustness and direction of the results when extreme utility scores were removed (utility scores greater than 0.95 and lesser than 0.05). Doing so resulted in the exclusion of 54 (20.38%) outliers from HS1, 46 (17.29%) from HS2, 43 (16.35%) from HS 3, 46 (17.49%) from HS4, 53 (19.85%) from HS5, 44 (16.42%) from HS6, 40 (14.87%) from HS7, 39 (15.06%) from HS8, 37 (13.55%) from HS9, 40 (15.15%) from HS 10, 39 (14.66%) from HS 11, and 33 (12.36%) from HS12. The ranking of the mean utility scores of health states within the sensitivity analysis (presented in ) yielded similar results to the ranking in mean utility scores reported in our initial analysis presented in , with one exception: mean utility value of health state 2 was greater than that of health state 1, as compared to the initial analysis where health state 1 was greater than health state 2. Furthermore, all mean utility scores were slightly lower, as upper bound outliers were more numerous than lower bound outliers. Standard deviations and 95% confidence intervals (in all health states) were reduced compared to base case results. The Kruskal-Wallis test was applied on the new dataset 2 after removing the outliers from the previous dataset. This new Kruskal-Wallis test displayed possible significance between some health states, but when Dunn’s post-hoc test was applied in order to identify which health states would yield significant differences, no significant difference was observed between any two health states.
Table 8. Sensitivity analysis: Outliers removed (values <0.05 and >0.95 are removed).
Discussion
This study is to our knowledge the second to elicit health state utilities in ITP using a direct measurement approach on members of the general public. A study in which the measure of utility values was undertaken in the UK had some similarities but many differences with the present study, mainly in the number and descriptions of health states and the study populationCitation32. Although each interview was limited to a random set of four health states from a total of 12 health states, a relatively large number of participants from the general public were enrolled, providing a set of health state utility scores for all 12 health states.
This study provides a set of utility scores to 12 different health states including health states incorporating the administration of romiplostim, as described in , which could be used in subsequent cost utility analyses, while Tables and provide utility data that could be used in sensitivity analyses. In contrast, the UK-based study, which also used the TTO, determined utilities for six health states, without specifically mentioning administration of romiplostim. That study reported utility scores with a wider range, from 0.038 for the worst health state (intracranial hemorrhage) to 0.863 for the best health state (sufficient platelets, no outpatient bleeding).
A certain pattern was observed with decreasing utility scores roughly associated with increasing severity of the health states that was mainly based on severity of bleeding. However, the decreasing trend was not straightforward, and statistically significant differences were reported only between some health states in terms of utility scores, mainly in comparison with the most severe health state. Sensitivity analyses yielded results that were generally similar to the base analyses, with the lowest utility scores almost identical while the highest utility scores differed from the base analyses by a relative difference of 3–6% (calculated as the difference in utility scores between base case and sensitivity analyses, divided by the base case utility score).
With regard to electronic administration of the TTO, the use of a computerized tool to assess QoL of subjects has been advocatedCitation33,Citation34. Electronic data captured can reduce the administration burden and can be more efficient compared to traditional ‘pen and paper’ methodsCitation35. In addition, in a study comparing computer-based and paper-based versions of a QoL questionnaire, Crawley et al.Citation36 reported that 66% of the subjects in their study would prefer to use the computer-based questionnaire over the paper-based one. Only 12% preferred using the traditional ‘pen and paper’ version, the rest being indifferent between the two methods. Respondents to the survey reported that, in their opinion, the computerized version was faster, more reliable, and more comfortable to use than the paper-based version. Study site coordinators were also interviewed and most of them preferred to use a computer-based tool.
Moreover, the use of a computerized tool, including a voice-over feature, may have possibly reduced administrator bias by presenting the health state descriptor scenarios in a uniform fashion, and by standardizing the administration of the TTO questionnaires. In case there was any such bias, the direction of bias was expected to be similar for all subjects, as the ‘administrator’ in this study was the software interface. Furthermore, randomizing the set of any four health states administered to subjects may have reduced any potential bias for any specific order of appearance of health states.
The least cumbersome process and easiest survey for subjects to understand would have only incorporated one health state per survey; however, that approach would have made enrolment difficult with a required sample size of ∼3200 participants. The most practical approach, in terms of reduced timelines and resource use for the study, would have included all 12 health states in each survey, but the burden on respondents would have been too great. Therefore, we tested in the pilot studies what would be an acceptable number of health states to administer to the participants, and, accordingly, incorporated four health states for each interview. Even with four health states, the required sample was fairly large, but feasible to recruit.
There are several limitations in our research. First, the participants enrolled in the study are not entirely representative of the general population of Canada. As observed in the demographics of the study sample, a perfect matching of Canadian demographics was not obtained. However, trying to attain a perfect match may be very onerous in time and money. Nonetheless, some of the demographics of our sample may be more representative of metropolitan centers rather than the entire Canadian population, especially with regards to ethnic background (fewer Whites than the national average) and possibly employment. In fact, when compared to the demographic descriptive reported by StatCan for Toronto, Hamilton, and Ottawa, less differences were found with our demographic results than when our results were compared to the general Canadian census including the entire population of the country. For instance, there was no longer a statistically significant difference in ethnicity (59.9% white subjects in our sample vs 64.2% for Toronto, Hamilton, and Ottawa combined), and there were less differences in age categories (especially the groups 25–34 years, 35–44 years, and 45–54 years were no longer significantly different). Furthermore, after adjusting utilities for demographic parameters we did not find any substantial difference between original utility scores and adjusted scores.
Another limitation is that the source of data for development of the 12 health states was restricted to information from the ITP-PAQ and two romiplostim Phase 3 clinical trials. The scenarios were developed in a structured fashion, based on the best available evidence, and are appropriate for an economic evaluation of romiplostim vs watch and rescue therapy. However, they do not represent a complete library of health states for patients with ITP. Future research is needed to elicit utilities for other ITP health states for a more comprehensive understanding of QoL in ITP.
As for outliers, they accounted for between 12–20% of responses for specific health states. However, the sensitivity analysis performed without the outliers presented the same pattern as the base case analysis, with results slightly lower, denoting a 3–6% relative decrease for health states 1–9 and 11, and almost identical for health states 10 and 12. In absolute scores, those differences ranged between 0 and 0.04.
With regard to comprehension of the TTO survey, two test questions, depicting counter-intuitive scenarios, were asked before participants were presented the health state scenarios: if they would prefer living in a disease state rather than full health for the same length of time, and whether they would prefer immediate death rather than the disease state. If a counter-intuitive answer was given, such as preference of disease over health for same length of time and preference of immediate death, that participant was excluded from the survey.
Conclusions
An electronic TTO tool, describing 12 health states for patients with ITP receiving romiplostim or watch and rescue therapy, was developed and administered to the general public to elicit utilities for use in a future CUA of romiplostim. A decreasing pattern was observed in utility scores from the least severe health state to the most severe health state, with statistically significant differences between the most extreme health states (such as responders to romiplostim with minimal or no bleeding but with other adverse events, compared to those experiencing significant bleeding). The highest utility score (best quality of life) was associated with the health state scenario describing successful outcome with the use of romiplostim (despite inclusion of possible adverse events), while the lowest utility score (worst quality-of-life) was associated with significant bleeding involving hospitalization. Furthermore, the ranking resulting from the results of the TTO survey confirms the ranking proposed by the clinical experts for the various health states.
The directly measured health state utilities elicited in this study provide the quality-of-life weights required for determining QALYs in a cost utility analysis and will enable such an analysis to be conducted for the use of romiplostim vs watch and rescue therapy for the treatment of ITP in Canada.
Transparency
Declaration of funding
This study was sponsored by Amgen Inc. Thousand Oaks, CA, USA.
Declaration of financial/other interests
ATT has disclosed that he has been a consultant for Amgen and Novartis, and has received grant support from the Canadian Blood Services. DMA has disclosed that he has been a consultant for Amgen, and has received grants from Amgen, GSK, and Hoffman-LaRoche. JM has disclosed that he has no relevant financial relationships. MI has disclosed that he is an employee of PharmIdeas, a company that performed data collection and analysis under contract with Amgen. RD and JI have disclosed that they are employees of Amgen and own stock in the company.
Acknowledgments
The authors would like to acknowledge Olivier Desjardins (formerly of PharmIdeas) and Dr Amiram Gafni (of McMaster University) for their scientific input in the design of the study as well as Marlene Bakmazian, Farhana Khondoker, and Jade Berbari for facilitating data collection, Bechara Farah (all of PharmIdeas) for analyses, as well as Susan Mathias (of Health Outcomes Solutions) and Michelle Zakson (of Amgen Inc.) for writing support.
Notes
*eQtool is a registered trade mark of PharmIdeas USA Inc., a wholly owned subsidiary of PharmIdeas Research and Consulting Inc.
References
- Ren H, Zhao H, Wang T, et al. Leptin enhances in vitro secretion of IgG antiplatelet antibodies by splenocytes and peripheral blood mononuclear cells from patients with chronic idiopathic thrombocytopenic purpura. Clin Immunol 2006;120:205‐11
- Andersson P-O, Wadenvik H. Chronic idiopathic thrombocytopenic purpura (ITP): molecular mechanisms and implications for therapy. Exp Rev Mol Med 2004;6:1‐17
- Ramadan K, El-Agnaf M. Efficacy and response to intravenous anti-D immunoglobulin in chronic idiopathic thrombocytopenic purpura. Clin Lab Haematol 2005;27:267‐9
- Zeller B, Rajantie J, Hedlund-Treutiger I, et al. Childhood idiopathic thrombocytopenic purpura in the Nordic countries: epidemiology and predictors of chronic disease. Acta Paediatr 2005;94:178‐84
- Provan D, Newland A. Fifty years of idiopathic thrombocytopenic purpura (ITP): management of refractory ITP in adults. British Journal of Haematology 2002;118:933‐44
- Cines D, McMillan R. Management of adult idiopathic thrombocytopenic purpura. Ann Rev Med 2005;56:425‐42
- Neylon A, Saunders P, Howard M, et al. Clinically significant newly presenting autoimmune thrombocytopenic purpura in adults: a prospective study of a population-based cohort of 245 patients. Br J Haematol 2003;122:966‐74
- Frederiksen H, Schmidt K. The incidence of idiopathic thrombocytopenic purpura in adults increases with age. Blood 1999;94:909‐13
- Cines D, Blanchette V. Immune thrombocytopenic purpura. N Engl J Med 2002;346:995‐1008
- Rodeghiero F, Stasi R, Gernsheimer T, et al. Standardization of terminology definitions and outcome criteria in immune thrombocytopenic purpura of adults and children: report from an international working group. Blood 2009;113:2386‐93
- Bottiger L, Westerholm B. Thrombocytopenia. I. Incidence and aetiology. Acta Med Scand 1972;191:535‐40
- Cohen Y, Djulbegovic B, Shamai-Lubovitz O, et al. The bleeding risk and natural history of idiopathic thrombocytopenic purpura in patients with persistent low platelet counts. Arch Intern Med 2000;160:1630‐8
- Portielje J, Westendorp R, Kluin-Nelemans H, et al. Morbidity and mortality in adults with idiopathic thrombocytopenic purpura. Blood 2001;97:2549‐54
- Arnold D, Dentali F, Crowther M, et al. Systematic review: efficacy and safety of rituximab for adults with idiopathic thrombocytopenic purpura. Ann Intern Med 2007;146:25‐33
- Bussel J, Kuter D, George J, et al. AMG 531, a thrombopoiesis-stimulating protein, for chronic ITP. N Engl J Med 2006;355:1672‐81
- Canadian Agency for Drugs and Technologies in Health. Procedure for common drug review. July 2009, i-51. 2009. Ottawa, Canada: Canadian Agency for Drugs and Technologies in Health (CADTH)
- Canadian Agency for Drugs and Technologies in Health. Guidelines for the economic evaluation of health technologies: Canada. 3rd edn. Ottawa, Canada: Canadian Agency for Drugs and Technologies in Health (CADTH), 2006
- McMillan R, Bussel J, George J, et al. Self-reported health‐related quality of life in adults with chronic immune thrombocytopenic purpura. Am J Hematol 2008;83:150‐4
- Mathias S, Gao S, Miller K, et al. Impact of chronic immune thrombocytopenic purpura (ITP) on health-related quality of life: a conceptual model starting with the patient perspective. Health Qual Life Outcomes 2008;6:13
- Barnard D, Woloski M, Feeny D, et al. Development of disease-specific health-related quality-of-life instruments for children with immune thrombocytopenic purpura and their parents. J Pediatr Hematol Oncol 2003;25:56‐62
- Mathias S, Bussel J, George J, et al. A disease-specific measure of health-related quality of life for use in adults with immune thrombocytopenic purpura: its development and validation. Health Qual Life Outcomes 2007;5:11
- Mathias S, Bussel J, George J, et al. A disease-specific measure of health-related quality of life in adults with chronic immune thrombocytopenic purpura: psychometric testing in an open-label clinical trial. Clin Therapeut 2007;29:950‐62
- George J, Mathias S, Go R, et al. Improved quality of life for romiplostim-treated patients with chronic immune thrombocytopenic purpura: results from two randomized, placebo-controlled trials. Br J Haematol 2008;144:409‐15
- O'Brien S, Ritchey A, Smith K. A cost-utility analysis of treatment for acute childhood idiopathic thrombocytopenic purpura (ITP). Pediatr Blood Cancer 2007;48:173‐80
- Kunz K, Kuppermann M, Bowe T, et al. Protein A immunoadsorption column versus splenectomy in the treatment of steroid-resistant immune thrombocytopenic purpura. A cost-effectiveness analysis. Int J Technol Assess Health Care 1996;12:436‐49
- Sackett D, Torrance G. The utility of different health states as perceived by the general public. J Chronic Dis 1978;31:697‐704
- Gold MR, Patrick DL, Torrance GW, eds. Identifying and valuing outcomes. In: Cost-effectiveness in health and medicine. New York: Oxford University Press, 1996. p 82-123
- Froberg D, Kane R. Methodology for measuring health-state preferences–II: scalling methods. J Clin Epidemiol 1989;42:459‐71
- Torrance G. Utility Approach to measuring health-related quality of life. J Chronic Dis 1987;40:593‐600
- Gafni A. Encyclopedia of biostatistics - “The Time Trade-Off Technique”. In: Armitage P, Colton T, eds. Baffins Lane, UK: John Wiley and Sons Ltd, 1998. p 4528-32
- Sun J. Adjusting distributions of the Health Utilities Index Mark 3 utility scores of health-related quality of life. Qual Life Res 2003;12:11‐20
- Szende A, Brazier J, Schaefer C, et al. Measurement of utility values in the UK for health states related to immune thrombocytopenic purpura. Curr Med Res Opin 2010;26:1893‐903
- Hahn E, Cella D. Health outcomes assessment in vulnerable populations: measurement challenges and recommendations. Arch Phys Med Rehabil 2003;84(4 Suppl):S35‐S42
- Greenwood M, Hakim A, Carson E, et al. Touch-screen computer systems in the rheumatology clinic offer a reliable and user-friendly means of collecting quality-of-life and outcome data from patients with rheumatoid arthritis. Rheumatology 2006;45:66‐71
- Lofland J, Schaffer M, Goldfarb N. Evaluating health-relatged quality of life: cost comparison of computerized touch-screen technology and traditional paper systems. Pharmacotherapy 2000;20:1390‐5
- Crawley J, Kleinman L, Dominitz J. User preferences for computer administration of quality of life instruments. Drug Info J 2000;34:137‐44
Appendix
Presented below in Table A1 is the exact text used to present the preamble and the 12 health states to the participants who completed the TTO survey.
Table A1. Exact transcription of the text of the preamble and of the 12 health states as presented to the participants of the Time Trade-Off survey.