Abstract
Objective:
To compare utilization and associated costs of epoetin alfa (EPO) and darbepoetin alfa (DARB), two erythropoiesis-stimulating agents (ESAs), in patients with cancer undergoing chemotherapy and patients with chronic kidney disease (CKD) not on dialysis in inpatient and outpatient hospital settings.
Methods:
An analysis of medical claims recorded between January 2006 and December 2009 was conducted using the Premier Perspective Comparative Hospital database. Patients included were ≥18 years old with cancer and chemotherapy or with pre-dialysis CKD and with ≥1 claim for EPO or DARB during a hospital inpatient or outpatient treatment episode. Patients treated with both ESAs or who were receiving dialysis were excluded. Mean cumulative drug costs and dose ratios (units EPO: mcg DARB) were calculated using cumulative dose and April 2010 wholesale acquisition costs.
Results:
Cancer chemotherapy: 13,832 inpatient stays (EPO: 10,454; DARB: 3378) and 5590 outpatient treatment episodes (EPO: 2856; DARB: 2734) were identified. The inpatient and outpatient populations reported ESA dose ratios of 230:1 and 238:1 with DARB cost premiums of 42% (EPO: $948; DARB: $1348) and 38% (EPO: $3358; DARB: $4627), respectively. CKD: 148,746 hospital stays (EPO: 116,017; DARB: 32,729) and 11,012 outpatient treatment episodes (EPO: 6921; DARB 4091) were identified. The inpatient and outpatient populations reported ESA dose ratios of 251:1 and 257:1 with DARB cost premiums of 30% (EPO: $566; DARB: $738) and 27% (EPO: $2077; DARB: $2642), respectively.
Limitations:
The lack of randomization may have led to confounding by indication. In addition, statistical significance must be interpreted with caution in studies involving large samples.
Conclusions:
This study of 19,422 patients with cancer receiving chemotherapy and 159,758 patients with pre-dialysis CKD reported ESA dose ratios ranging from 230:1–257:1 (units EPO: mcg DARB) and associated cost premiums of 27–42% for DARB.
Introduction
Anemia is a common complication in patients with cancer receiving chemotherapy or with chronic kidney disease (CKD)Citation1–4. If left untreated, anemia in patients with cancer undergoing chemotherapy or those with pre-dialysis CKD may lead to serious adverse clinical outcomes. Patients with CKD and untreated anemia are also more likely to suffer from poor cardiovascular health and to experience increased hospitalization and all-cause mortality risksCitation5–7.
Epoetin alfa (EPO) and darbepoetin alfa (DARB) are two erythropoiesis-stimulating agents (ESAs) approved by the Food and Drug Administration (FDA) for the treatment of anemia in patients with cancer receiving chemotherapy and in patients with pre-dialysis CKDCitation8,Citation9. In these patient populations, ESAs have been found to increase hemoglobin (Hb) levels and to reduce blood transfusion requirementsCitation1,Citation10–13. Several studies have documented ESA practice patterns and cost considerations for both conditions, although more extensively in outpatient than in inpatient settingsCitation14–20.
Several recent events, including payer restrictions, ESA label changes, and community practice guideline changes since 2005 may have modified physicians’ practice patterns. For instance, the National Coverage Determination (NCD) issued by the Centers for Medicare and Medicaid Services (CMS) in July 2007 limited ESA utilization in patients with chemotherapy-induced anemia (CIA) to Hb levels of less than 10 g/dL at ESA initiation and after the initial 4 weeks of treatment. Subsequently in 2008, the ESA labels were also changed to recommend initiation at Hb less than 10 g/dL in patients with cancer on chemotherapyCitation8,Citation9,Citation21.
The update of Hb target of the Clinical Practice Guidelines and Clinical Practice Recommendation for Anemia in Chronic Kidney Disease published in March 2007 by the National Kidney Foundation Kidney Disease Outcomes Quality Initiative (NKF KDOQI) marked another changeCitation22. These guidelines recommended that ‘the selected Hb target should generally be in the range of 11.0–12.0 g/dL’. Moreover, the guidelines recommended that ‘the Hb target should not be greater than 13 g/dL’. Most recently in 2011, the FDA-approved prescribing information was updated to recommend ESA dose reductions as the Hb approaches or exceeds 11 g/dL in patients on dialysis or exceeds 10 g/dL in pre-dialysis patients. The ESA label emphasizes that practitioners use the lowest dose sufficient to reduce the need for blood transfusion among both patients on cancer chemotherapy and patients with CKDCitation8,Citation9.
Considering that CIA and CKD affect an increasing number of people, updated guidelines for the treatment of anemia in these patient populations have the potential to change utilization patterns and corresponding costs on a large scaleCitation23. Pharmacoeconomic assessment of ESAs with the most recent available data is therefore important to ensure meaningful and timely comparisons and optimal allocation of healthcare resources.
The goal of this study was to evaluate utilization and trends as well as therapy costs of EPO and DARB in cancer patients undergoing chemotherapy and patients with pre-dialysis CKD treated in inpatient and outpatient hospital settings and to assess the impact of recent regulatory and community practice guideline changes on utilization patterns and corresponding costs. To the best knowledge of the authors, this study is the first to analyze both inpatient and outpatient settings using national-level data.
Patients and methods
Data source
De-identified inpatient and outpatient records were retrieved retrospectively between the first quarter of 2006 to the fourth quarter of 2009 from the Premier Perspective Comparative Hospital Database (PREMIER), the largest hospital-based database in the US. The database provides detailed information for more than 25 million inpatient discharges and 175 million hospital outpatient visits from over 500 acute care hospitals across all US regions. Data elements by setting included visit-level information (e.g., primary and secondary diagnoses) and detailed billing information (e.g., drug name, dosage strength, dispensed quantity, and unit cost). As opposed to centralized healthcare claims recorded by insurance companies, patients’ medical information available in the PREMIER database comes from records collected for billing purposes at the hospital level. Thus, it is not possible with the PREMIER data to link outpatient records across facilities, and, therefore, to know whether or not the entire continuum of care of patients was captured. Consequently, baseline characteristics for inpatients were evaluated during the inpatient stay, whereas those of outpatients were not assessed.
Study design
A retrospective cohort design consisting of two separate cohorts of patients on cancer chemotherapy and with CKD treated with EPO or DARB between January 2006 and December 2009 was used to conduct the analysis. All patients were at least 18 years of age. The cancer chemotherapy population was selected using primary and secondary diagnoses of cancer (International Classification of Diseases, 9th Revision, Clinical Modification [ICD-9-CM], 140 to 209 and V10) and procedure codes for chemotherapy (Current Procedural Terminology [CPT], Healthcare Common Procedure Coding System [HCPCS], PREMIER Standard Master Charge codes). Patients diagnosed with CKD were excluded from the cancer chemotherapy population. The CKD population was identified using primary and secondary diagnoses for CKD (ICD-9-CM: 250.4, 585–586, 588, 403–404), excluding patients also diagnosed with cancer or receiving dialysis. All patients on cancer chemotherapy and with CKD who received both ESA agents were excluded from the analysis.
For hospitalized cancer chemotherapy and CKD patients, the unit of analysis was each inpatient stay and the study period spanned from the date of admission to the date of discharge. Patients’ baseline demographics (e.g., age and sex) and characteristics (e.g., disease severity, length of stay, comorbidities, and concurrent iron supplement) were reported for each eligible stay. The degree of illness severity variable was based on an algorithm developed by 3M Health Information Systems (Salt Lake City, UT) and was constructed by considering (1) the primary admitting diagnosis, (2) the secondary diagnoses, (3) the age of the patient, and (4) the presence of certain procedures, such as chemotherapyCitation24. Levels of illness severity, based on 3M’s algorithm using All-Patient Refined Diagnosis-Related Groups (APR-DRG) grouper codes, were reported as minor, moderate, major, or extreme.
The observation period for an outpatient episode of ESA treatment was defined as the period from the first to the last outpatient visit with a claim for ESA. If there was more than one calendar month between two EPO or DARB claims, the second claim marked the beginning of a new treatment episode. All treatment episodes were used in the analysis. If a patient had received renal dialysis during a treatment episode, data were censored one month prior to the first date of dialysis.
Data on EPO and DARB dosage were reported along with detailed information on rendered services during inpatient stays and outpatient treatment episodes. For hospitalizations, treatment duration was equal to the hospitalization length of stay. For outpatient treatment episodes, treatment duration was equal to the number of months from the first to the last dose of EPO or DARB. Cumulative ESA dose was defined as the sum of all EPO or DARB doses administered during a hospital stay or an outpatient episode. Dose ratio was defined as the mean cumulative dose of EPO divided by the mean cumulative dose of DARB (units EPO: mcg DARB). ESA cost was calculated by multiplying the April 2010 wholesale acquisition costCitation25 (WAC: EPO, $15.15/1000 units; DARB, $4.96/mcg) by the average cumulative dose of the corresponding treatment. As a sensitivity analysis, ESA cost based on the April 2010 average sales price (ASP) plus 6% (EPO, $10.01/1000 units; DARB, $3.05/mcg) was also reportedCitation26.
The effect on ESA cost of the new NCD for the cancer chemotherapy indication and the new community practice guidelines for the CKD indication was assessed by estimating treatment costs before and after the changes (cancer chemotherapy: ESA NCD announcement, July 2007; CKD: KDOQI guideline change, March 2007). Patients with cancer undergoing chemotherapy and with pre-dialysis CKD were assigned to the pre- or post-changes group based on their treatment initiation date.
Statistical analysis
Univariate descriptive statistics on age, gender, degree of illness severity, comorbidities, and concurrent iron supplement were generated for EPO and DARB inpatients for cancer and CKD indications. Frequency counts and percentages were generated for categorical variables and means and standard deviations for continuous variables. Mean costs rather than median costs were reported because, as stated by Thompson and BarberCitation27, ‘despite the usual skewness in the distribution of costs in health economic evaluations, the arithmetic mean is the most informative measure. Measures other than the arithmetic mean do not provide information about the cost of treating all patients, which is needed for healthcare policy decisions’. Statistical comparisons between the two ESA treatments were conducted using chi-square tests for categorical variables and the two-tailed Student t test for continuous variables. Treatment costs between the groups were compared using the Wilcoxon non-parametric statistical test since cost data are rarely normally distributed. To minimize the effect of outliers on statistical inference, 2% of the patients in each treatment group—receiving the upper- and lower-one percentiles of the cumulative dose distribution—were excluded from the dosing analysis. Tests of significance were established at the 95% confidence level. All statistical analyses were performed using Statistical Analysis System (SAS) software, version 9.1 or newer (SAS Institute Inc., Cary, NC).
Results
Characteristics of inpatient population
A total of 13,832 inpatient stays of patients with cancer receiving chemotherapy and treated with EPO (n = 10,454) or DARB (n = 3378) were identified (). Patients with cancer undergoing chemotherapy treated with EPO were slightly older than those receiving DARB (p < 0.01), while gender distribution was similar between the two groups (p = 0.37). The distribution of patients among illness severity levels at admission was different between the EPO and DARB groups (p < 0.01), with a greater proportion of EPO recipients having a higher degree of severity compared with DARB recipients. The two groups were similar in terms of prevalence of comorbid conditions. Although a greater proportion of patients in the EPO group received iron supplements, less than 4% of patients with cancer undergoing chemotherapy in both treatment groups reported iron supplementation.
Table 1. Characteristics of patients with cancer chemotherapy or pre-dialysis chronic kidney disease receiving EPO vs DARB in inpatient settings.
There were 148,746 inpatient stays (EPO: 116,017; DARB: 32,729) meeting the study selection criteria with a diagnosis of CKD (). EPO-treated patients were slightly younger (71.0 vs 71.2 years, p = 0.02), with a higher proportion of women (52.3% vs 51.3%, p ≤ 0.01) compared with DARB-treated patients. The concurrent use of intravenous iron was similar between groups (p = 0.52). Similar to what was observed in the cancer chemotherapy population, patients receiving EPO had a higher degree of disease severity compared with patients receiving DARB (p < 0.01). The prevalence of cardiovascular disease was lower in the EPO group compared with the DARB group, whereas the prevalence of congestive heart failure, myelodysplastic syndrome, and sepsis was higher in the EPO group (p < 0.05 for all). Finally, a larger proportion of EPO-treated patients was concurrently receiving oral iron compared with DARB-treated patients.
ESA utilization and associated costs by practice settings
shows EPO and DARB utilization and corresponding treatment costs for patients with cancer receiving chemotherapy and with pre-dialysis CKD treated in inpatient or outpatient practice settings.
Table 2. Utilization of EPO vs DARB for patients with cancer chemotherapy or pre-dialysis chronic kidney disease.
Inpatient settings
In the hospital inpatient setting, EPO-treated patients with cancer undergoing chemotherapy or with CKD had slightly longer hospital lengths of stay compared to DARB-treated patients with the same conditions. The mean (SD) cumulative dose per inpatient stay in patients with cancer receiving chemotherapy was 62,605 (58,489) units of EPO and 272 (196) mcg of DARB, corresponding to a dose ratio of 230:1 (units EPO: mcg DARB). In pre-dialysis CKD inpatients, the EPO: DARB dose ratio was 251:1 (units EPO: mcg DARB) based on average cumulative doses per hospital stay of 37,333 (37,218) units of EPO and 149 (128) mcg of DARB. Based on the cumulative dose and WAC prices, DARB was associated with cost premiums of 42% and 30% over EPO treatment in cancer chemotherapy and CKD inpatients, respectively (cancer chemotherapy: $948 vs $1348, p < 0.01; CKD: $566 vs $738, p < 0.01). Based on ASP + 6% prices, the cost premiums associated with DARB were 32% and 21% in cancer chemotherapy and CKD inpatients, respectively (cancer chemotherapy: $627 vs $829, p < 0.01; CKD: $374 vs $454, p < 0.01). A sensitivity analysis including the 2% of patients with extreme doses confirmed the existence of a cost premium associated with DARB.
Outpatient settings
In outpatient settings, the average treatment duration between the EPO and DARB groups was similar for patients with cancer receiving chemotherapy and slightly longer for EPO in patients with CKD. The mean (SD) cumulative dose per episode of treatment in patients with cancer and receiving chemotherapy was 221,652 (167,099) units of EPO and 933 (535) mcg of DARB, corresponding to a dose ratio of 238:1 (units EPO: mcg DARB). In patients with pre-dialysis CKD, the dose ratio was 257:1 (units EPO: mcg DARB) based on average cumulative doses per treatment episode of 137,101 (150,017) units of EPO and 533 (483) mcg of DARB. The cumulative cost for cancer chemotherapy outpatients based on WAC prices was $3358 for EPO and $4627 for DARB, resulting in a cost premium of 38% associated with DARB treatment (p < 0.01). In CKD outpatients, DARB was associated with a cost premium of 27% compared with EPO ($2077 vs $2642, p < 0.01). Based on ASP + 6% prices, the cost premiums associated with DARB were 28% and 18% in cancer chemotherapy and CKD outpatients, respectively (cancer chemotherapy: $2219 vs $2845, p < 0.01; CKD: $1372 vs $1625, p < 0.01). A sensitivity analysis including the 2% of patients with extreme doses confirmed the existence of a cost premium associated with DARB.
Treatment costs pre- and post-NCD change for the oncology indication
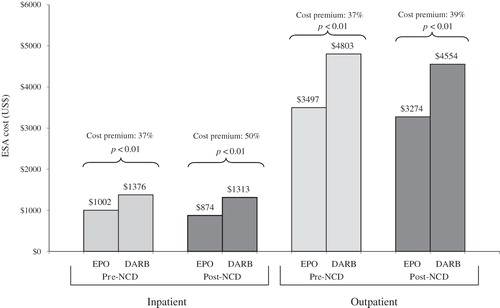
shows cumulative ESA costs and the corresponding cost premiums associated with DARB before and after the NCD change for the oncology indication, released in July 2007. Following the NCD change, DARB treatment remained more costly than EPO treatment in both inpatient and outpatient settings (37–50% and 37–39% cost premiums associated with DARB, respectively, based on WAC prices).
Figure 1. Cumulative ESA cost for patients with cancer receiving chemotherapy based on WAC prices pre- and post-NCD (July 2007).
Treatment costs pre- and post-NKF KDOQI change for the pre-dialysis CKD indication
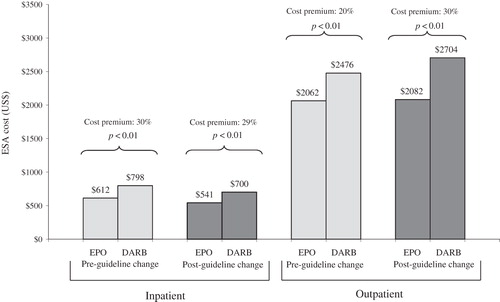
shows cumulative ESA costs and cost premiums based on WAC prices associated with DARB before and after the NKF KDOQI update of Hb target, released in March 2007. Following the new NKF guidelines, DARB remained more costly than EPO for patients with pre-dialysis CKD treated in inpatient or outpatient settings. While the cost premium associated with DARB remained stable (30–29%) during the pre-NKF vs post-NKF guideline change periods in inpatient settings, it increased significantly (from 20% to 30%) in the outpatient setting.
Figure 2. Cumulative ESA cost for patients with pre-dialysis chronic kidney based on WAC prices pre- and post-guidelines modification (March 2007).
Discussion
ESAs are often used for the management of anemia in patients with cancer receiving chemotherapy and with pre-dialysis CKD. Dosing patterns and corresponding costs of EPO and DARB have been previously investigated, although more extensively in outpatient than inpatient settings. Given the recent regulatory and community practice guidelines changes, meaningful and timely comparisons of utilization and associated costs of EPO and DARB are important to maintain optimal practices from both clinical and economic perspectives.
This large retrospective study investigated the current utilization and corresponding costs of EPO and DARB in inpatient and outpatient settings. As EPO is measured in units and DARB in mcg, the dose ratio is the metric usually considered when comparing the relative utilization of EPO and DARB. The CMS has used equitable payment ratios to establish reimbursement rules using the format of units of EPO to 1 mcg of DARB, which established the use of dose ratios to compare these two agents. In this study, the dose ratio between EPO and DARB was 230:1 and 251:1 for hospitalized patients with cancer undergoing chemotherapy and with pre-dialysis CKD, respectively. The outpatient group treated for cancer with chemotherapy had a dose ratio of 238:1, while that of patients with CKD was 257:1. These observed dose ratios are consistent with reported dose ratios in other retrospective studies of both therapeutic areas and settingsCitation14–17,Citation28,Citation29.
A study by Daniel et al.Citation30 reported a dose ratio of 326:1 based on weekly doses, when including the duration of clinical benefit of 8 days for EPO and 15 days for DARB. However, when the duration of clinical benefit is not included, the dose ratio was established at 237:1, which is similar to the results reported in other retrospective studies. The current study reports the overall doses received by the patients and the corresponding total cost of treatment, thus avoiding the discussion of the need for inclusion of the duration of clinical benefit.
To the best knowledge of the authors, there has been little published evidence that analyzes the dosing patterns of ESAs and associated costs in cancer chemotherapy and CKD from the inpatient perspective. In an analysis of data between 2002 and 2005, Vekeman et al.Citation14 found dose ratios of 245:1 and 242:1, respectively, for cancer and CKD inpatients. The current study, conducted from 2006 to 2009, reported lower dose ratios for patients with cancer and higher dose ratios for patients with CKD. Of note, the study by Vekeman et al.Citation14 considered all patients with cancer treated with an ESA as opposed to the current one, which focused on ESA-treated patients with cancer receiving chemotherapy. Kruep and BasskinCitation31 also studied ESA utilization in patients with cancer and CKD admitted to a hospital in 2003 and found a lower dose ratio of 136:1 in oncology patients and a higher dose ratio of 267:1 in those with CKD. It should be noted that the study by Kruep and BasskinCitation31 was conducted using data from only one hospital.
Using April 2010 WAC prices, the cumulative drug cost was 42% and 30% higher in the DARB group, respectively, for cancer chemotherapy and CKD inpatients compared with the EPO group. In outpatient settings, the cost premiums associated with DARB were 38% and 27% in patients with cancer undergoing chemotherapy and with CKD, respectively. Cost results reported for the period before and after labeling revisions in 2007 showed that DARB remained more expensive than EPO by more than 20% for both cancer chemotherapy and CKD inpatient and outpatient settings. These findings are slightly less than results from other observational studies which found cost premiums associated with DARB ranging from 40–52% compared to EPO, probably explained by relative changes in EPO and DARB WACsCitation14,Citation17,Citation28.
The current study used WAC-based unit prices to standardize erythropoietic drug costs across health plans. As a sensitivity analysis, results based on ASP + 6% prices were presented. It is possible that health plans, providers, and institutions may have individualized arrangements, such as rebates and discounts with manufacturers, resulting in actual prices paid generally lower than published WAC prices. Given that there are a myriad of such arrangements, many of them confidential and complex, it was not possible to account for them for this calculation. However, the readers can, with knowledge of their own institutional arrangement, adjust the results of this study to determine the relative costs of the two agents in their particular setting.
In the current study, ∼11% of patients with pre-dialysis CKD received IV iron supplements during their inpatient stay. This medication is typically administered to patients on dialysis, suggesting that those patients are iron-deficient and not responding to oral iron, which can impact their ESA treatment patterns. Since no statistical differences were observed in the proportion of patients receiving IV iron between the two groups, the dose ratio was probably not affected for the CKD population. On the other hand, significantly more EPO-treated patients received IV iron supplements relative to the DARB cohort (4% vs 2%) in the cancer chemotherapy population; however, the magnitude of the difference between the two groups (i.e., 2%) is not likely to significantly influence the dose ratio for this population.
The present study has several limitations. First, given the lack of randomization, it was assumed that there were no unmeasured confounding factors between EPO- and DARB-treated patients. Second, the assessment of hematologic response in this study was not feasible due to the missing Hb data. Therefore, cost comparisons were made assuming comparable effectiveness between EPO and DARB, which from the hospital pharmacy perspective is rational since total cost of ESA therapy depends only on the actual dosage administered regardless of clinical efficacy outcomes. Third, the nature of the database prevented the ability to link inpatient stays to conduct repeated-measures analyses controlling for patients that might have been admitted multiple times. Instead, it was assumed that each inpatient stay was an independent event, although some patients may have been hospitalized more than once over the study period. This limitation also prevented the authors from assessing the evaluation of anemia across the continuum of care. Similarly, because healthcare records are de-identified at the facility level, it was not possible to link outpatient records across facilities and therefore to know whether or not the entire episode of anemia management was captured. Consequently, no assessment of the baseline characteristics for the EPO and DARB outpatient groups was conducted, preventing the identification of potential imbalance in patients’ characteristics between the EPO and DARB groups. Finally, the type of tumors and chemotherapy agents administered to patients with cancer was not described. Given that the intensity of chemotherapy regimens and agents administered varies with tumor types and that chemotherapy agents and regimens do not have the same myelosuppressive properties, imbalance towards more severe malignancies or chemotherapy regimens in one group could have confounded the results.
Despite these limitations, this study provides meaningful information on ESA utilization and corresponding costs across inpatient and outpatient settings in the US. Further research exploring the relative efficacy of ESA therapies through clinical and patient-reported outcomes as well as the adherence to clinical guidelines is warranted to fully understand the pharmacoeconomic profiles of EPO and DARB. Additionally, analyses with more current ESA data may be useful given the recent changes in FDA-approved prescribing information for patients with CKD.
Conclusions
Results from this study on patients with cancer receiving chemotherapy and patients with pre-dialysis CKD from inpatient and outpatient settings revealed that DARB was associated with a cost premium of 27–42% relative to EPO. These findings were not impacted by the 2007 CMS NCD for patients with cancer undergoing chemotherapy or the 2007 NKF KDOQI guidelines for patients with CKD.
Transparency
Declaration of funding
Funding to support preparation of this manuscript was provided by Janssen Scientific Affairs, LLC. All authors were involved in the conceptual development of this study as well as in the interpretation of the results and the manuscript preparation. All authors reviewed and approved the final content of this manuscript.
Declaration of financial/other interest
MHL, FV, and PL have disclosed that they are employees of Groupe d’analyse, Ltée, a company that has received research grants from Janssen Scientific Affairs, LLC. RAB and RSM have disclosed that they are employees of Janssen Scientific Affairs, LLC.
References
- Witzig TE, Silberstein PT, Loprinzi CL, et al. Phase III, randomized, double-blind study of epoetin alfa versus placebo in anemic patients with cancer undergoing chemotherapy. J Clin Oncol 2005;23:2606-17
- Provenzano R, Garcia-Mayol L, Suchinda P, et al. Once-weekly epoetin alfa for treating the anemia of chronic kidney disease. Clin Nephrol 2004;61:392-405
- National Kidney Foundation. KDOQI clinical practice guidelines for anemia of chronic kidney disease. Am J Kidney Dis 2006;47(5 Suppl 3):S33-S53
- Johnson DW. Evidence-based guide to slowing the progression of early renal insufficiency. Inter Med J 2004;34:50-7
- Spence RK. Medical and economic impact of anemia in hospitalized patients. Am J Health Syst Pharm 2007;64(16 Suppl 11):S3-S10
- Schmidt RJ, Dalton CL. Treating anemia of chronic kidney disease in the primary care setting: cardiovascular outcomes and management recommendations. Osteopa Med Prim Care 2007;1:14
- National Kidney Foundation. KDOQI clinical practice guidelines for anemia of chronic kidney disease, 2000. Am J Kidney Dis 2001;37(1 Suppl):S182-238
- Procrit (epoetin alfa) prescribing information. Raritan, NJ: Ortho Biotech Products, L.P., 2011
- Aranesp (darbepoetin alfa) prescribing information. Thousand Oaks, CA: Amgen, Inc., 2011
- Vansteenkiste J, Pirker R, Massuti B, et al. Double-blind, placebo-controlled, randomized phase III trial of darbepoetin alfa in lung cancer patients receiving chemotherapy. J Nat Cancer Inst 2002;94:1211-20
- National Anemia Action Council. ESA Drugs treat anemia by stimulating red blood cell production. April 8, 2009. [Online]. http://www.anemia.org/patients/feature-articles/content.php?contentid=000379§ionid=00015. Accessed May 7, 2010
- Roger SD. Extended administration of erythropoiesis-stimulating agents for optimising the management of renal anaemia: what is the evidence? Int J Clin Pract 2008;62:1413-22
- Spivak JL, Gascón P, Ludwig H. Anemia management in oncology and hematology. Oncologist 2009;14(1 Suppl):43-56
- Vekeman F, McKenzie RS, Lefebvre P, et al. Dose and cost comparison of erythropoietic agents in the inpatient hospital setting. Am J Health-Syst Pharm 2007;64:1943-9
- Vekeman F, McKenzie RS, Bookhart BK. Drug utilisation and cost considerations of erythropoiesis stimulating agents in oncology patients receiving chemotherapy: observations from a large managed-care database. J Med Econ 2009;12:1-8
- Papatheofanis F, Smith C, Mody S, et al. Dosing patterns, hematologic outcomes, and costs of erythropoietic agents in anemic predialysis chronic kidney disease patients from an observational study. Am J Ther 2007;14:322-7
- Lefebvre P, Gosselin A, McKenzie RS, et al. Dosing patterns, treatment costs, and frequency of physician visits in adults with cancer receiving erythropoietic agents in managed care organizations. Curr Med Res Opin 2006;22:1623-31
- Mark TL, McKenzie RS, Fastenau J, et al. Retrospective observational study of patients with chemotherapy-related anemia receiving erythropoietic agents. Curr Med Res Opin 2005;21:1347-54
- Duh MS, Mody SH, McKenzie RS, et al. Dosing patterns and costs of erythropoietic agents in patients with chronic kidney disease not on dialysis in managed care organizations. Clin Ther 2006;28:1443-50
- Duh MS, Mody SH, McKenzie RS, et al. Dosing patterns and treatment costs of erythropoietic agents in elderly patients with pre-dialysis chronic kidney disease in managed-care organizations. Drugs Aging 2006;23:969-76
- Centers for Medicare & Medicaid Services. Decision memo for erythropoiesis stimulating agents (ESAs) for non-renal disease indications (CAG-00383N). Washington, DC: Department of Health & Human Services [Online]. 2007. https://www.cms.hhs.gov/mcd/viewdecisionmemo.asp?id=203. Accessed May 7, 2010
- National Kidney Foundation Kidney Disease Outcomes Quality Initiative. Clinical practice guidelines and clinical practice recommendation for anemia in chronic kidney disease published: 2007 update of hemoglobin target [Online]. http://www.kidney.org/professionals/KDOQI/guidelines_anemiaUP/index.htm. Accessed May 7, 2010
- U.S. Renal Data System. USRDS 2009 Annual Data Report: atlas of chronic kidney disease and end-stage renal disease in the United States, National Institutes of Health, National Institute of Diabetes and Digestive and Kidney Diseases, Bethesda, MD, 2009. [Online]. http://www.usrds.org/atlas.htm. Accessed May 7, 2010
- Averill RF, Goldfield G, Hughes JS, et al. All patient refined diagnosis-related groups (APR-DRGs) version 20.0: methodology overview. Wallington, CT: 3M Health Information Systems [Online], 2007. http://www.hcup-us.ahrq.gov/db/nation/nis/APR-DRGsV20MethodologyOverviewandBibliography.pdf. Accessed May 7, 2010
- Thomson PDS. ReadyPrice software. Last update: April 2010
- US Department of Health & Human Services, Centers for Medicare and Medicaid Services (CMS). ASP: Average Sales Price (ASP) per “Apr 10 ASP Pricing File 031811”. http://www.cms.gov/apps/ama/license.asp?file=/McrPartBDrugAvgSalesPrice/downloads/April_2010_ASP_Pricing_File.zip. Accessed November 16, 2011
- Thompson SG, Barber JA. How should cost data in pragmatic randomised trials be analysed? BMJ 2000;320:1197-2000
- Papatheofanis FJ, McKenzie RS, Mody SH, et al. Dosing patterns, hematologic outcomes, and costs of erythropoietic agents in predialysis chronic kidney disease patients with anemia. Curr Med Res Opin 2006;22:837-42
- Hymes J, Bickimer T, Jackson JH, et al. Dosing patterns, drug costs, and hematologic outcome in anemic patients with chronic kidney disease switching from darbepoetin alfa to epoetin alfa. Curr Med Res Opin 2007;23:1931-7
- Daniel G, Hurley F, Whyte JL, et al. Use and cost of erythropoiesis-stimulating agents in patients with cancer. Curr Med Res Opin 2009;25:1775-84
- Kruep EJ, Basskin LE. Cost-minimization analysis of darbepoetin alfa versus epoetin alfa in the hospital setting. Am J Health-Syst Pharm 2005;62:2597-603