Abstract
Objective:
Cost-effectiveness analysis (CEA) on trial-based data has played an important role in pharmacoeconomics. A regression model can be used to account for patient-level heterogeneity throughout covariates adjustment in CEA. However, the estimates from CEA could be biased if ignoring the censoring issue on effectiveness and costs. This study is to propose a regression model to account for both time-to-event effectiveness and cost.
Methods:
A bivariate regression model was proposed to analyze both effectiveness and cost simultaneously, while censored observations were also taken into account. The regression coefficients were estimated using a Bayesian approach by drawing a random sample from their posterior distribution derived from the Markov chain Monte Carlo (MCMC) method. The proposed method was illustrated using empirical data of anti-platelet therapies to the management of cardiovascular diseases for those patients with high risk of gastrointestinal (GI) bleeding, where cost-effectiveness between different therapies was analyzed under both censored and non-censored circumstances, where the effectiveness was defined as the time to re-hospitalization due to GI complications, and the cost was measured by the total drug expenditure.
Results:
Under censored circumstances, aspirin plus proton-pump inhibitors (PPIs) was considered more cost-effective than clopidogrel with/without PPIs, as shown in the cost-effectiveness acceptability curve, and clopidogrel was preferred to aspirin for a willingness-to-pay of 89 NTD for delaying 1 day to hospitalization due to GI complications.
Conclusions:
Ignoring censoring problems could possibly bias the results in CEA. This study has provided an appropriate method to conduct regression-based CEA to improve the estimation which serves its purpose for CEA concerns.
Limitations:
The normality assumption for the cost and effectiveness in the bivariate normal regression needs to be examined, and the conclusions may be biased if this assumption is violated. However, when sample size is sufficiently large, a slight deviation from normality would not be a serious problem.
Introduction
In both clinic trials and post-market analysis, cost-effectiveness analysis (CEA) of pharmacoeconomic evaluation has played an important role in identifying the most cost-effective drug from a set of candidate medicines with respect to their outcomes (effectiveness) and costs. There are two major approaches to implement CEA: trial-based CEA and decision modeling-based CEA. Trial-based CEA can be used to analyze patient-level data and can provide a better internal validity but poorer external generalizability, while decision modeling-based CEA is suitable for an aggregate data which may come from a range of data sources and is flexible to generalize other populations externallyCitation1. The results of both trial-based and decision modeling-based CEA are usually presented by the measures of the incremental cost-effectiveness ratio (ICER) and the incremental net benefit (INB). Recently, some new statistical techniques on trail-based CEA have been developed to solve the problems in estimating and inferring the ICER and INBCitation2,Citation3. Recent statistical developments on the ICER and INB in trail-based CEA are addressed in the following paragraph.
In trail-based CEA, the ICER is initially used to measure the cost-effectiveness between two drugs, treatments, or interventions. It is defined as the ratio of the difference of expected costs to the difference of expected effects between two drugs. Most of the time, the cost-effectiveness (CE) plane is used to visualize the analysis of CEA by locating the value of incremental effectiveness and incremental costs in a four-quadrant graph, with a line through the origin, with slope of the willingness-to-pay (WTP, denoted as λ), which is defined as the maximum monetary value for marginal effectiveness. The target drug is considered as relatively cost-effective if the ICER is located below the line with a slope λ. Considering the sampling uncertainty for the ICER, the statistical testing hypothesis of whether the ICER is greater than λ, and the confidence interval of the ICER, however, is difficult because the ICER is a ratio statistic with a sample distribution which doesn’t have an exact form; moreover, the denominator of the ICER could possibly be close to or equal to zero in some situations. To overcome this problem, Taylor’s series expansionCitation4 and Fiellers’ theoremCitation5 were applied to approximate the confidence interval for the ICER. Later on, both parametric and non-parametric estimations based on the Bootstrapping method for the confidence interval were developedCitation5,Citation6. Nevertheless, estimating the confidence interval for ICER still remains a major challenge in economic evaluation due to its difficulties and complexities. Recently, the INB, a function of λ, has emerged due to such a predicament and, in contrast to the ICER, it poses some statistical advantages, as the sample distribution of the INB(λ) is known to approximate normal distribution given a large sample size, and its variance is mathematically tractableCitation7. That attractive properties of the INB hold if the appropriate WTP, λ, for decision-making is known. In fact, the WTP is usually unknown and not determined beforehand. As such, providing information on the mathematical relation between the WTP and cost-effectiveness becomes an alternative tool for practical use. The cost-effectiveness acceptability curve (CEAC) provided a summary for the acceptability of cost-effectiveness given a range of λ, from 0 through to a certain large valueCitation8. That acceptability is defined by the probability of the target is more cost-effective given a specific value of λ, and measures for cost-effectiveness can be the ICER and INBCitation9–11. CEAC was initially developed from the frequentist view, but some studies argued that the probability that positive INB or the ICER is greater than λ has a natural and valid interpretation only in the Bayesian frameworkCitation7,Citation12,Citation13. Recently, CEA was extended to undertake factor adjustment to explain the uncertainty for cost and effect in real-world clinical practice. To incorporate such information into the study, a regression model was then introduced to adjust both costs and effects by covariates of interest and allow for the correlation between the patients’ costs and effectsCitation14. A Bayesian estimation procedure for the costs and effects with regression adjustment was also developedCitation15,Citation16.
In most CEA, costs and effects were assumed to be non-censored. However, it is common that when patients are lost to follow-up in some clinical studies censoring occurs if the effects are measured by time-to-event variables such as death, hospitalization, or disease occurrence. Under such circumstances, cost would also be censored due to loss to follow-upCitation17 or censored timeCitation18. The traditional way to tackle this kind of censoring problem is to exclude censored observations from the data analysis naively or to treat them as non-censored cases on costs and effects. The ignorance of censoring could lead to biased estimates of the mean of costs and effectsCitation19–21. Both parametric and non-parametric methods without covariates adjustment were developed to deal with censored data which were collected in a clinical trialCitation18,Citation20,Citation21. However, in an observational study, to control for potential confounders, covariates adjustment is necessary in estimating the ICER and INBCitation14–16.
The aim of this study is to use a bivariate normal regression to incorporate covariates adjustment based on Bayesian estimation to account for censored cost and effect, where the effect was measured by time-to-event variable and the cost would also be censored due to censored effect. Finally, a real example of anti-platelet therapy will be presented for illustration.
Methods
Bivariate regression model
In this section, a bivariate regression model is proposed to adjust for censored time-to-event effect and censored cost (equation 1) by using Bayesian estimation. For each subject i, i = 1, 2 , … , n, data for the effect (Ei), the cost (Ci), and the subject’s characteristics xij, j = 1, 2 , … , p, are collected. Let zi denote an indicator variable (zi = 1 if the subject i receives the target drug D1; zi = 0 if the subject i receives the active drug D0). Suppose that Ei and Ci follows a bivariate normal distribution with a mean vector and a variance-covariance matrix
and the means,
and
can be expressed as
where
denotes the mathematical expectation;
denotes a vector of subject’s covariates;
and
are the vectors of the regression parameters related to effect and cost, respectively. In this regression model, the difference of expected effects of the drug D1 to the drug D0 is calculated as
and the difference of expected cost of the drug D1 to the drug D0 is calculated as
The interpretations of the regression parameters, β and could be plausible if the cost is censored as the effect is censored. To model the censored effect and cost in a regression form, Ei and Ci are assumed to follow a bivariate normal distribution. Then, the marginal distribution of Ei is normally distributed with a mean,
, and a variance,
, and the distribution of Ci conditional on Ei also followed a normal distribution with a mean of
and a variance of
. In this way, the joint density of Ei and Ci will be the product of the marginal density of Ei and the conditional density of Ci given EiCitation17. Then, equation (1) can be rewritten as
The regression parameters, is the incremental cost for increasing one unit of effect conditioning on the effect. The relationships of regression parameters between equations (1) and (2) can be expressed in the corresponding transformations as
Using these relationship functions, the estimates of regression parameters in equation (2) can be derived when given the estimates of regression parameters in equation (1). Then, under equations (1) and (2), the incremental effect of the drug D1 compared to the drug D0 is calculated as
and the incremental cost of the drug D1 compared to the drug D0 under equations (1) and (2) is calculated as
respectively. Then, the ICER would be
, and the
would be
for some
in the model setting.
Bayesian estimation for model parameters
Let denote a censored indictor: when the effect is censored so is the cost,
is 1; otherwise
is 0. The likelihood function (L) for equation (2) is the product of the marginal density of Ei and the conditional density of Ci given Ei. The likelihood function is parameterized as a function of
,
, and
, as shown below.
The above likelihood incorporated two components: the multiplicand (the first bracket) is the density for exact observation sample, and multiplier (the second bracket) is the survival function for censored sample. In the Bayesian estimation, all unknown parameters are estimated based on a joint prior distribution
using Markov Chain Monte Carlo (MCMC) methodCitation22,Citation23. Because, in this model, the calculation of likelihood function involves double integrals for the censored parts, the computation algorithm for those double integrals would be used in applying MCMCCitation24. Through MCMC methods, the posterior samples of the parameters in equation (2) can be obtained.
Posterior distributions for ICER and INB
Given the random samples of regression parameters drawn from MCMC, the posterior distribution of the adjusted ICER and can be approximated. Suppose that
,
and
,
are drawn from MCMC steps after t
burn-in steps. For
, the posterior sample of the ICER is given by
, and the posterior sample of
is given by
for some λ.
With these posterior samples, the authors can use CE planes and CEAC to provide visual presentations in CEA. The C-E plane is constructed by plotting and
on the vertical axis and horizontal axis, and cost-effectiveness acceptability curve is determined by calculating the probability
as the number of
divided by the size of the posterior sample, K
, given varying λ
.
Empirical example
In this section, a real example of anti-platelet therapy to the management of cardiovascular diseases (CVD) was presented to demonstrate this approach. Anti-platelet therapy, including low-dose aspirin (75–150 mg) and clopidogrel, has been found to be effective as a secondary prevention for some CVD. Previous studies have shown that patients that received aspirin treatment may have some level of gastrointestinal (GI) bleeding, and clopidogrel is an alternative treatment to reduce the occurrence of GI bleeding. However, the American College of Cardiology (ACC) and the American Heart Association (AHA) have suggested that gastroprotective agents such as proton-pump inhibitors (PPIs) might be used concomitantly with aspirin or clopidogrel to minimize the risk of GI bleeding. There is no clinical guideline for high-risk patients, i.e., having medical history of GI bleeding. In this case, the clinical issue is to determine which treatment is more cost-effective in terms of the effect to avoid the occurrence of GI bleeding. The CEA is conducted from the perspective of a Taiwanese healthcare payer.
Study subjects were identified from the National Health Insurance Database (NHIRD) in Taiwan. Patients were identified if they initiated anti-platelet therapy after discharge from hospital for major GI complications of peptic ulcer or history of hospitalization with major GI bleeding or perforation detected on surgery between 2001 and 2006. The follow-up began from the discharge date and expended until the earliest occurrence of outcomes of interest in this study or until 5 year after the hospital discharge of acute coronary syndrome (ACS) for those who did not experience any outcome. Study subjects were then classified into four groups based on the anti-platelet therapy regimens they received during the 90 days following the hospital discharge: (1) those who have been prescribed clopidogrel alone; (2) those who have been prescribed clopidogrel plus PPIs; (3) those who have been prescribed aspirin alone; and (4) those who have been prescribed aspirin plus PPIs.
Effect variable was defined as the duration from each patient’s ACS discharge to the next hospitalization for a GI event or the end of the study, whichever came first. GI events were defined as either a hospitalization for GI hemorrhage or peptic ulcer ([ICD-9-CM] codes: 531–534), including bleeding and perforation identified by surgery. Cost outcome was defined as accumulated medication cost from the beginning of the study period to hospitalization for a GI event or the end of the study. If the hospitalization did not occur, the effect and the cost would be denoted as censored; otherwise, denoted as non-censored. The unit for the effect was days (time to re-hospitalization), and the unit for cost variable was NTD (New Taiwan Dollars).
In modeling the effect and cost, subjects’ age, gender, daily medical use (average DDD for clopidogrel, aspirin, and PPIs), and potential GI risk confounders for each patient based on prior GI events (outpatient visits or hospitalizations for peptic ulcer) were controlled. The propensity score used to correct for sample selection bias was estimated by fitting a logistics regression, and was included as a regressor in the model to adjust the potential imbalance among different treatment groups.
To complete the estimation of the Bayesian framework in this empirical example, the prior distribution of the parameters in the model needed to be specified. Each of the regression parameters, ,
, and δ
were assumed to follow a non-informative prior, a normal distribution with a mean zero and a large variance, 100, 0002. Also, the variances,
and
were assumed to follow an inverse gamma distribution, which was denoted by IG(0.01, 0.01)
. The authors also assumed that all prior distributions of the parameters were independent, i.e., their prior distributions are independent. The posterior samples of the parameters were provided by implementing the Metropolis-Hastings algorithm. The Geweke Convergence DiagnosticCitation25 was used to monitor the convergence of Metropolis-Hastings algorithm. The authors ran single chains from a starting value for 300,000 iterations, and discarded the first 250,000 iterations. The remainders were left for posterior estimations for posterior means and 2.5% and 97.5% percentile as 95% Bayesian confidence intervals.
Here, these data were analyzed under two circumstances, ‘censored’ and ‘non-censored’. In the censored circumstance there were some censored observations in the data, while in the non-censored circumstance all observations were assumed to be completely observed. The likelihood for the censored circumstance was given by the previous description and the likelihood for the non-censored circumstance was given by
The assumptions for the prior distributions of the non-censored circumstance and the Bayesian estimation procedures were equivalent to those of the censored one. The comparisons for the estimates in these two circumstances were also addressed.
Results
showed the baseline characteristics of a total sample of 14,627 subjects. Among them, 11,463 (78%) subjects used aspirin, 538 (4%) subjects used aspirin plus PPIs, 2036 (14%) subjects used clopidogrel, and 590 (4%) subjects used clopidogreal plus PPIs. In terms of the effects, the highest average time from the beginning of the study to the next hospitalization for major GI complications was 1636 days (SD = 39) for the aspirin plus PPIs group, and the lowest was 1468 days (SD = 40) for the clopidogrel plus PPIs group. Regarding the cost, the mean costs were 412 NTD, 575 NTD, 12,662 NTD, and 12,807 NTD for the aspirin, aspirin plus PPIs, clopidogrel, and clopidogrel plus PPIs groups, respectively. About 60% were males, and the mean age is ∼70 years among the total sample. During 1 year prior to the entry into the study, there were overall 4.37 ± 6.33 GI-related outpatient visits, 4.22 ± 6.32 for the aspirin group, 4.84 ± 6.34 for the aspirin plus PPs group, 5.16 ± 6.59 for the clopidogrel group, and 4.17 ± 5.33 for the clopidogrel plus PPIs group. Regarding the history of GI-related hospitalization, there was 0.53 ± 0.63 times for the total sample, 0.49 ± 0.61 times for the aspirin group, 0.87 ± 0.68 times for the aspirin plus PPIs group, 0.56 ± 0.63 times for the clopidogrel group, and 0.91 ± 0.57 for the clopidogrel plus PPIs group.
Table 1. Baseline characteristics, medical history, and drug therapy during the follow-up.
shows the estimates of bivariate regressions and the estimates represents the relationship between the patients’ characteristics and the costs and effects for three independent pair-wise comparisons: (1) clopidogrel vs aspirin, (2) clopidogrel vs aspirin plus PPIs, and (3) aspirin plus PPIs vs clopidogrel plus PPIs in both of the censored and non-censored circumstances. The results for all comparisons, the regression estimates, the CE planes, and CEACs and Bayesian 95% CIs of INB would be summarized separately as follows.
Table 2. Bayesian estimates and the corresponding 95% confident intervals for the parameters of the bivariate regression models under censored and non-censored assumptions.
Clopidogrel vs aspirin
Under censored circumstances, after adjusting the covariates, the subjects who received clopidogrel would delay the time to re-hospitalization for GI complications by ∼112.8 days (95% CI: 19.8–209.6) compared with those who received aspirin. The cost of the medical drug for the clopidogrel group was higher than the aspirin group (9947 NTD, 95% CI: 9570–10,320). The average time to re-hospitalization was shorter among subjects with a history of GI-related outpatient visits (−10.2, 95% CI: −17.0 to −3.8) and a history of GI hospitalizations (−152.4, 95% CI = −210.1 to −92.3). Under non-censored circumstances, the subjects who used clopidogrel had a shorter time to re-hospitalization than those who received aspirin (−65.6 days, 95% CI: −97.1 to −34.2); the cost for the clopidogrel group was higher than the aspirin group (9897 NTD, 95% CI: 9483–103,000).
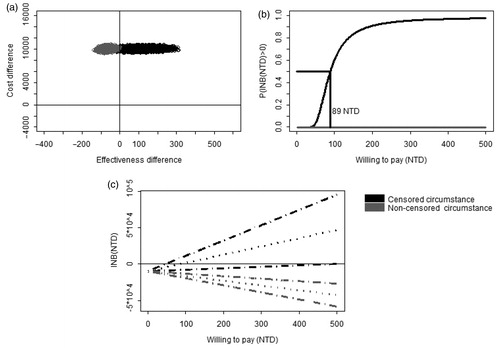
compared the results from a censored model with results from a non-censored model. showed that the joint posterior samples of the censored model (dark color) fell mostly in the first quadrant of the CE plane, indicating that clopidogrel was more effective and more costly than aspirin in the censored circumstance (dark color). However, the posterior samples of the non-censored model (gray color) fell in the second quadrant, indicating that clopidogrel was less effective and more costly than aspirin in the non-censored circumstance (gray color). In , the results from the censored model showed that clopidogrel would be preferred to aspirin if the WTP for delaying 1 day to re-hospitalization was higher than 89 NTD. However, in the non-censored model, clopidogrel would not be cost-effective at all because its probability of being cost-effective was zero across all WTP values. presented the Bayesian 95% CI for INB. The dark lines showed that, for the WTP less than ∼50 NTD per day, the upper limits of 95% CIs were negative, suggesting that clopedogrel is superior to aspirin for those who have a WTP of 50 NTD or lower. At WTP of 89 NTD per day, i.e., the posterior mean of INB equals to 0, clopidogrel and aspirin had equal net benefits. With a WTP of 500 NTD per day, the posterior mean of net benefit of clopidogrel is ∼500 NTD per subject and the lower limit of the 95% CI was positive in the censored circumstance. For given WTP, the net benefits and the entire 95% CI were always negative in the non-censored circumstance.
Figure 1. The comparison of cost-effectiveness between clopidogrel and aspirin. (a) Joint posterior sample of cost and effect differences on the CE plane. (b) Bayesian cost-effectiveness acceptability curve. The horizontal line indicated that posterior probability that INB is greater than zero is 0.5. (c) Bayesian 95% confidence intervals of INB (dashed lines) and the posterior means of INB (dotted lines).
Clopidogrel vs aspirin plus PPIs
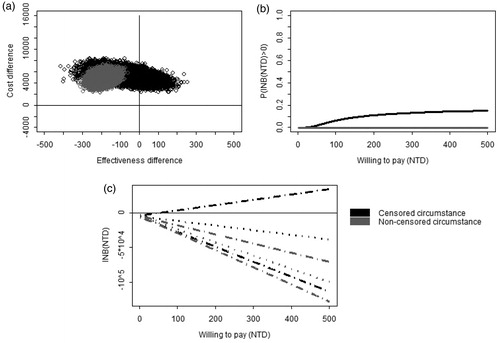
In the censored circumstance (see ), the subjects who received clopidogrel would have an earlier re-hospitalization than those who received aspirin plus PPIs which was statistically insignificant (−66.8 days, 95% CI: −215.9–76.4), and the cost for the clopidogrel group was higher than for the aspirin plus PPIs group (5040 NTD, 95% CI: 3759–6322). In the non-censored circumstance, the subjects receiving clopidogrel would also have earlier hospitalization than those receiving aspirin plus PPIs (−190.0 days, 95% CI: −246.8 to −131.6), and the cost for the clopidogrel group was higher than that for the aspirin plus PPIs group (4679 NTD, 95% CI: 3106–6167). showed that clopedogerl is more costly. In the censored circumstance, most of the posterior samples fell in the second quadrant of the CE plane in , while, in the non-censored circumstance, the entire posterior samples fell in the second quadrant of the CE plane, showing clopedogerl alone was more effective in delaying re-hospitalization than aspirin plus PPIs. showed, in the censored model, the probability of INB > 0 is lower than 0.2 across all WTP levels. showed that only when WTP was greater than 60 NTD, was the upper limit of the 95% CI of INB positive. CEAC and 95% CI of INB in the non-censored circumstance showed the INB was less than zero across all WTP levels.
Figure 2. The comparison of cost-effectiveness between clopidogrel vs aspirin plus PPIs. (a) Joint posterior sample of cost and effect differences on the CE plane. (b) Bayesian cost-effectiveness acceptability curve. (c) Bayesian 95% confidence intervals of INB (dashed lines) and the posterior means of INB (dotted lines).
Aspirin plus PPIs vs clopidogrel plus PPIs
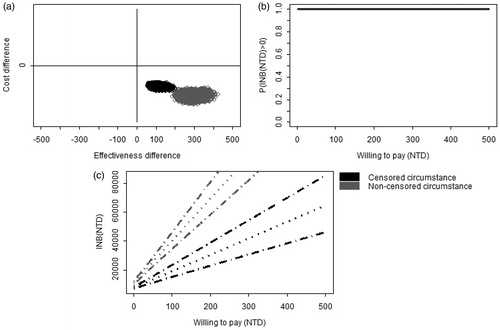
In the censored circumstance, the subjects who received aspirin plus PPIs would delay time to hospitalization significantly more than those who received clopidogrel plus PPIs (113.8 days, 95% CI: 77.5–155.1), and the cost for aspirin plus PPIs was insignificantly lower than that for the clopidogrel plus PPIs group (−708 NTD, 95% CI: −2627–1197). In the non-censored circumstance, the subjects receiving aspirin plus PPIs would delay time to hospitalization more than those receiving clopidogrel plus PPIs (291.2 days, 95% CI: 237.2–349.4), and the cost for aspirin plus PPIs was insignificantly higher than that for clopidogrel plus PPIs (70 NTD, 95% CI: −1758–1918). In , in both censored and non-censored models, the posterior samples fell completely in the fourth quadrant of the CE plane, indicating that aspirin plus PPIs was more effective and less costly than clopidogrel plus PPIs. CEAC in showed that aspirin plus PPIs provided more effect than clopidogrel, without an additional drug cost. The entire 95% CIs were always positive when WTP was greater than 0 ().
Figure 3. The comparison of cost-effectiveness between aspirin plus PPIs vs clopidogrel plus PPIs. (a) Joint posterior sample of cost and effect differences on the CE plane. (b) Bayesian cost-effectiveness acceptability curve. (c) Bayesian 95% confidence intervals of INB (dashed lines) and the posterior means of INB (dotted line).
Discussion
In this study, a Bayesian bivariate normal regression was developed to model both effectiveness and cost in CEA. In this model, both effectiveness and cost were considered correlated and were assumed to be censored. As censored cost was intuitively induced by censored effect, the likelihood function of the bivariate regression is factorized as a product of the marginal density of the effectiveness and the conditional density of the cost given by the effectiveness to take censored information into account.
In the real example, the effectiveness was measured by the duration re-hospitalization due to GI complications, and the cost was measured by the total drug expenditure of those three drugs of interest. For the high risk group of GI, this empirical study showed that the incremental effectiveness was 112.8 days, 242.5 days, and 113.8 days for clopidogrel vs aspirin, aspirin plus PPIs vs clopidogrel, and aspirin plus PPIs vs clopidogrel plus PPIs, and the corresponding incremental costs were 9947 NTD, −5790 NTD, and −708 NTD, respectively. The critical value for choosing clopidogrel relative to aspirin was estimated at WTP of 89 NTD for delaying 1 day to hospitalization due to GI complications. Also, clopidogrel with/without PPIs were dominated by aspirin plus PPIs because aspirin plus PPIs was considered more cost-effective than clopidogrel with/without PPIs across different WTP values, as shown in the CEAC.
In this study, the authors assumed that both cost and effectiveness were from normal distributions. However, it is more reasonable to consider the fact that cost data is sometimes skewed and effectiveness can sometimes belong to some other distributions. In previous literatures, the distributions for effectiveness (time-to-event) are assumed as an exponential distribution or a Weibull distributionCitation18. Meanwhile, cost is usually assumed to be a Gamma distributionCitation18 or a log-normal distributionCitation14. However, in these models, the subjects’ characteristics would be able to be involved in calculating the difference of the mean cost and the difference of the mean effectiveness i.e., both the ICER and INB statistics are functions of the subjects’ covariates, when non-normal distributions are assumed. For using those non-normal distributions to fit the data, the link function in a generalized linear model (GLM) is usually non-linear, such as log-link. The non-linear link function would lead to and
, which are the combinations of the covariate and the interpretations of coefficients in GLM is not straightforward. Adopting a bivariate normal regression would make regression coefficients more intuitively and directly interpretable, both in economic circumstances and in clinical practice. Especially, it is vital for decision-makers who need to review the results from the CEA to have explicit interpretations of the resultsCitation4. In addition, the robustness of the linear regression estimation has been proven to allow for the non-normality of the dataCitation26, and it is adequately so whenever sample size is sufficiently largeCitation11.
Transparency
Declaration of funding
This research was supported by two grants: the National Science Council (Grant Number: NSC 100-2410-H-182-014) and the Chang Gung Medical Research Program grant (Grant Number: CMRPD1A0271).
Declaration of financial/other relationships
All authors claimed no conflict of interests.
Acknowledgments
The authors thank the Bureau of National Health Insurance and the National Health Research Institutes for providing the databases for this study.
References
- Goeree R, He J, O’Reilly D, et al. Transferability of health technology assessments and economic evaluations: a systematic review of approaches for assessment and application. ClinicoEconomics Outcome Res 2011;3:89-104
- Doshi JA, Glick HA, Polsky DP. Analyses of cost data in economic evaluation conducted alongside randomized controlled trials. Value Health 2006;9:334-40
- Willan AR, Briggs AH. Statistical analysis of cost-effectiveness data. Chichester: John Wiley & Sons, 2006
- O’Brien BJ, Drummond MF, Labelle RJ, et al. In search of power and significance: issues in the design and analysis of stochastic cost-effectiveness studies in health care. Med Care 1994;2:150-63
- Willan AR, O'Brien BJ. Confidence intervals for cost-effectiveness ratios: an application of Fieller's Theorem. Health Econ 1996;5:297-305
- Briggs AH, Wonderling DE, Mooney CZ. Pulling cost-effectiveness analysis up by its bootstraps: a non-parametric approach to confidence interval estimation. Health Econ 1997;6:327-40
- Briggs AH. A Bayesian approach to stochastic cost-effectiveness analysis. Health Econ 1999;8:257-61
- Hout BAV, Al MJ, Gordon GS, et al. Costs, effects and C/E-ratios alongside a clinical trial. Health Econ 1994;3:309-19
- Löthgren M, Zethraeus N. Definition, interpretation and calculation of cost-effectiveness acceptability curves. Health Econ 2000;9:623-30
- O’Hagan A, Stevens JW, Montmartin J. Inference for the cost-effectiveness acceptability curve and cost-effectiveness ratio. Pharmacoeconomics 2000;17:339-49
- Briggs A, Fenn P. Confidence intervals or surfaces? Uncertainty on the cost-effectiveness plane. Health Econ 1998;7:723-40
- O’Hagan A, Stevens JW. A framework for cost-effectiveness analysis from clinical trial data. Health Econ 2001;10:303-15
- Briggs AH, O'Brien BJ, Blackhouse G. Thinking outside the box: recent advances in the analysis and presentation of uncertainty in cost-effectiveness studies. Ann Rev Public Health 2002;23:377-401
- Willan AR, Briggs AH, Hoch JS. Regression methods for covariate adjustment and subgroup analysis for non-censored cost-effectiveness data. Health Econ 2004;13:461-75
- Vázquez-Polo FJ, Hernández MAN, López-Valcárcel BG. Using covariates to reduce uncertainty in the economic evaluation of clinical trial data. Health Econ 2005;14:545-57
- Vázquez-Polo FJ, Negrín M, Badía X, et al. Bayesian regression models for cost-effectiveness analysis. Eur J Health Econ 2005;50:45-52
- Blackhouse G, Briggs AH, O’Brien BJ. A note on the estimation of confidence intervals for cost-effectiveness when costs and effects are censored. Med Decis Making 2002;22:173-7
- Heitjan DF, Kim CY, Li H. Bayesian estimation of cost-effectiveness from censored data. Stat Med 2004;23:1297-309
- Fenwick E, Marshall DA, Blackhouse G, et al. Assessing the impact of censoring of costs and effects on health-care decision-making: an example using the Atrial Fibrillation Follow–up Investigation of Rhythm Management (Affirm) Study. Value Health 2008;11:365-75
- Lin DY, Feuer EJ, Etzioni R, et al. Estimating medical costs from incomplete follow-up data. Biometrics 1997;53:419-34
- Raikou M, McGuire A. Estimating medical care costs under conditions of censoring. J Health Econ 2004;23:443-70
- Gilks W, Richardson S, Spiegelhalter D. Markov Chian Monte Carlo in Practice. Boca Raton, FL: Chapman & Hall/CRC, 1996
- Gelman A, Carlin J, Stern H, et al. Bayesian data analysis, 2nd edn. Boca Raton, FL: Chapman & Hall/CRC, 2004
- Genz A. Numerical computation of multivariate normal probabilities. J Comput Graph Statis 1992;1:141-50
- Geweke J. Evaluating the accuracy of sampling-based approaches to calculating posterior moments. In: Bernado JM, Berger JO, Dawid AP, Smith AFM, eds. Bayesian statistics. Oxford: Clarendon Press, 1992
- Lumley T, Diehr P, Emerson S, et al. The importance of the normality assumption in large public health data sets. Ann Rev Public Health 2002;23:151-69