Abstract
Objective:
In the Medical Research Council Myeloma IX Study (MMIX), zoledronic acid (ZOL) 4 mg 3–4/week reduced the incidence of skeletal-related events (SREs), increased progression free survival (PFS), and prolonged overall survival (OS), compared with clodronic acid (CLO) 1600 mg daily, in 1970 patients with newly-diagnosed multiple myeloma (MM).
Methods:
An economic model was used to project PFS, OS, the incidence of SREs and adverse events and expected lifetime healthcare costs for patients with newly-diagnosed MM who are alternatively assumed to receive ZOL or CLO. The incremental cost-effectiveness ratio [ICER] of ZOL vs CLO was calculated as the ratio of the difference in cost to the difference in quality-adjusted life years (QALYs). Model inputs were based on results of MMIX and published sources.
Results:
Compared with CLO, treatment with ZOL increases QALYs by 0.30 at an additional cost of £1653, yielding an ICER of £5443 per QALY gained. If the threshold ICER is £20,000 per QALY, the estimated probability that ZOL is cost-effective is 90%.
Limitations:
The main limitation of this study is the lack of data on the effects of zoledronic acid on survival beyond the end of follow-up in the MMIX trial. However, cost-effectiveness was favourable even under the highly conservative scenario in which the timeframe of the model was limited to 5 years.
Conclusions:
Compared with clodronic acid, zoledronic acid represents a cost-effective treatment alternative in patients with multiple myeloma.
Introduction
Multiple myeloma is the second most common haematological cancer after lymphoma in the UKCitation1. In England in 2008, there were 3805 new diagnoses of multiple myelomaCitation1. In Wales in 2008, there were 219 new cases of multiple myeloma, whilst in Scotland, in 2008, there were 384 new cases of multiple myelomaCitation1. Incidence was highest amongst those aged 75–79 years.Citation2 The 10-year prevalence of multiple myeloma in the UK in 2006 was 12,465 persons or an age-standardized proportion of 16 persons per 100,000 population.Citation3 Prognosis of multiple myeloma is highly variable and depends on stage at diagnosis and other factors. Relative survival for patients diagnosed in England and Wales in 1997–2001 was ∼60% at 1 year and 23% at 5 yearsCitation4. Recent improvements in treatment may result in a more favourable outlook for recently-diagnosed patients.
Randomized controlled trials have demonstrated that adding bisphosphonates to standard treatment for multiple myeloma reduces pain and the risk of skeletal-related events (SREs), where SREs are typically defined as pathological fracture, spinal cord compression, and/or radiotherapy to boneCitation5. Several bisphosphonates also have demonstrated anti-cancer activity in pre-clinical modelsCitation6–11. A randomized controlled trial comparing zoledronic acid 4 mg IV once every 28 days plus conventional chemotherapy vs conventional chemotherapy therapy alone in 94 previously untreated multiple myeloma patients reported a significant benefit on overall survival (OS) with zoledronic acidCitation12.
The Medical Research Council (MRC) Myeloma IX study was a randomized placebo-controlled trial with a two-by-two factorial design and two randomization steps to allow comparison of both first-line and maintenance treatments for adult patients with newly-diagnosed multiple myelomaCitation13–17. The details of the trial methods have been described previouslyCitation13–17. Briefly, the trial included adult patients from 120 centres in the UK with newly-diagnosed, histologically-confirmed, symptomatic multiple myeloma (International Staging System [ISS] Stage I, II or III). The first randomization step compared first-line treatments for multiple myeloma along with either zoledronic acid 4 mg every 3–4 weeks vs clodronic acid 1600 mg daily. The second randomization step compared maintenance treatment with 50 mg thalidomide daily and increasing to 100 mg daily if tolerated or no further treatment. Prior to randomization, patients were selected to receive induction chemotherapy via either an intensive or non-intensive pathway, with pathway selection based on performance status, clinician judgement and patient preference. Patients were followed annually until death. Treatment with zoledronic acid and clodronic acid was to be continued until disease progression. Primary end-points were OS, PFS and response. Secondary end-points included (but were not limited to) the incidence of SREs (vertebral fractures, other fractures, spinal cord compression, the requirement for radiation or surgery to bone lesions or the appearance of new osteolytic bone lesions), health-related quality-of-life and toxicity.
Of 1970 patients randomized to treatment, 1960 were evaluable, with a median follow-up of 3.7 years. Approximately 75% of patients stayed on bisphosphonate therapy until disease progression. Median time on treatment for those who discontinued treatment was 156 days for clodronic acid and 270 days for zoledronic acid. Median OS was 5.5 months longer among patients receiving zoledronic acid than among those receiving clodronic acid (50.0 vs 44.5 months; Hazard ratio [HR] = 0.87, 95% confidence interval [CI] 0.77–0.99, p = 0.04 based on log-rank test with stratification on intensive vs non-intensive pathway). Based on a Cox model stratified by pathway and adjusted for minimization factors, zoledronic acid reduced risk of mortality by 16% (HR = 0.842, 95% CI = 0.736–0.963, p = 0.04). Median PFS was 2.0 months longer among patients receiving zoledronic acid vs clodronic acid (19.5 vs 17.5 months, HR = 0.91, 95%CI = 0.82–1.01, p = 0.07); zoledronic acid reduced the risk of progression or death by 12% (HR = 0.88, 95%CI = 0.80–0.98, p = 0.0179). Patients receiving zoledronic acid had fewer SREs than those receiving clodronic acid (27.0% vs 35.3%, respectively; HR = 0.74, p = 0.0004). The benefit of zoledronic acid on OS was maintained after adjustment for potential effects of SREs on survival. Both zoledronic acid and clodronic acid were generally well-tolerated. Deterioration in renal function was similar between the two treatment groups. The incidence of confirmed osteonecrosis of the jaw (ONJ) was 3.6% with zoledronic acid vs 0.3% with clodronic acid.
Information regarding cost-effectiveness is required by healthcare decision-making authorities in their deliberations regarding pricing, reimbursement, and access to novel therapies. The objective of this evaluation was to assess the cost-effectiveness of zoledronic acid vs clodronic acid in patients with newly-diagnosed multiple myeloma from the UK healthcare system perspective.
Methods
Overview
A partitioned survival analysis model was developed to estimate expected PFS, OS, lifetime costs of treatment of multiple myeloma and quality-adjusted life years (QALYs) in patients receiving first-line treatment for newly-diagnosed Stage I–III multiple myeloma who are alternatively assumed to receive bisphosphonate therapy with zoledronic acid 4 mg IV every 3–4 weeks or clodronic acid 1600 mg daily. Clinical effectiveness (PFS, OS, incidence of SREs and adverse events) for zoledronic acid and clodronic acid were based on results of the MRC Myeloma IX trial. Other model parameters were based on data from secondary sources identified by reviews of the literature. Parameter estimates used in the model are reported in .
Table 1. Model parameters.
The partitioned survival analysis model employed in this study is similar to the Q-TWIST approach, a well-established analytical framework for evaluating oncology therapiesCitation18, and is similar to the models used in numerous prior economic assessments of treatments for advanced or metastatic cancers, including a recent evaluation of the cost effectiveness of bortezomib and lenalidomide for relapsed refractory multiple myelomaCitation19, and bortezomib and thalidomide for first-line treatment of multiple myelomaCitation20. With this approach, survival is partitioned into three mutually exclusive health states: (1) alive and not progressed; (2) alive and progressed; and (3) dead. The proportion of patients in each health state, over the course of time, is estimated based on empirical and/or parametric survival functions for PFS and OS. Post-progression survival (PPS) was assumed to equal the difference between OS and PFS. Expected PFS and expected OS are calculated as the areas under the respective survival curves. Expected PPS is the area between the PFS and OS curves. Costs and quality-of-life were assumed to be conditioned on treatment and expected time in these disease states. This approach is similar to a traditional Markov model except that it does not require explicit calculation of transition probabilities amongst statesCitation21.
Outcomes calculated by the model for each treatment included expected progression-free life years (PFLYs), expected post-progression life years (PPLYs), expected overall life years (LYs), expected quality-adjusted life years (QALYs) and expected lifetime costs of multiple myeloma care. The incremental cost-effectiveness ratio (ICER) was calculated as the ratio of the difference between zoledronic acid vs clodronic acid in expected lifetime cost of multiple myeloma care to the expected difference in QALYs (‘cost per QALY gained’). The model cycle length was 1 month. All outcomes were evaluated over a 20-year (240-month) timeframe, beginning with start of treatment. This timeframe approximates a lifetime projection, consistent with NICE guidanceCitation22–24. The analysis was conducted from the perspective of the UK publically-funded healthcare system, and focused specifically on the costs of multiple-myeloma-related care. The model was programmed using Microsoft Excel® (Microsoft Corp. Redmond, WA).
Model estimation
Progression-free and overall survival
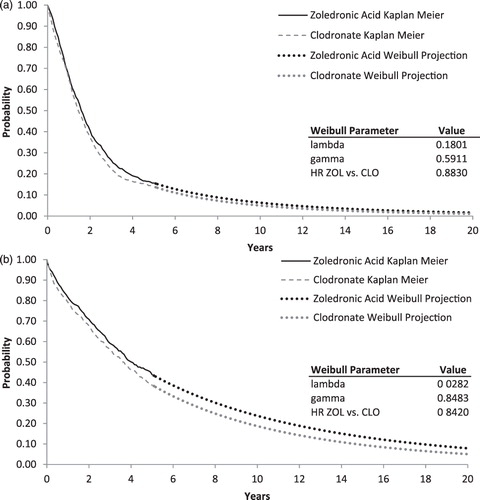
Maximum reported follow-up in the MRC Myeloma IX trial was 72 months for zoledronic acid and 70 months for clodronic acidCitation17. Because Kaplan-Meier estimates of PFS and OS were greater than 0 when analyses of PFS and OS were conducted, it was necessary to project survival beyond the end of the trial to obtain lifetime projections. In the base-case, estimates of PFS and OS for zoledronic acid and clodronic acid through 5 years (60 months) of follow-up were obtained from empirical survival distributions (i.e., the Kaplan-Meier curves). Beyond 5 years, PFS and OS for zoledronic acid and clodronic acid were based on Weibull survival functions fit to the empirical survival data. Five years was used as the cut-off because the number of failure times recorded after this point was small, and subsequent empirical survival probabilities were potentially imprecise. The Weibull is a flexible survival function that allows for increasing or decreasing risk of events over time and takes the general form of S[t] = e-λtγ, where S[t] is the probability of not having experienced the event (e.g., progression or death) at time tCitation25. Weibull survival functions for PFS and OS for clodronic acid were estimated by digitizing the reported Kaplan Meier survival curves (i.e., S[t] and t), then fitting an ordinary least squares regressions with ln(−ln(S[t])) as the dependent variable and ln(t) as the independent variable (taking the log of the negative log of the Weibull function yields a linear function with intercept equal to ln(λ) and coefficient on ln(t) equal to γ). To prevent survival probabilities close to 1.0 from overly influencing regression results for OS, values for t < 6 months were omitted from the regression. To improve the fit for PFS, the model was fit only to the last 30 months of the survival distribution. In the base-case, estimates of PFS and OS beyond 5 years of follow-up for zoledronic acid were obtained by applying to the clodronic acid survival the HR for zoledronic acid vs clodronic acid (HRZOL vs CLO) using the following formula SZOL[t] = SCLO[t]HRZOL vs CLO. This approach is based on the assumption that the hazard rate for zoledronic acid is proportional to that of clodronic acid and that benefits of zoledronic acid observed during the MRC Myeloma IX trial continue beyond the end of follow-up in the trail. Empirical and fitted survival functions for PFS and OS for zoledronic acid and clodronic acid are shown in .
Figure 1. Estimated PFS (a) and OS (b) for zoledronic acid and clodronic acid.
Skeletal-related events
Estimates of the cumulative incidence of SREs by type of SRE for each treatment were obtained from the MRC Myeloma IX trialCitation14. Although bone lesions were included amongst the SREs considered in the trial (9.7% with clodronic acid and 4.7% with zoledronic acid), they were not included in the model, as the effects of such events on costs and QALYs are unknown. To calculate monthly probabilities of individual SREs over time, cumulative incidence estimates over 42 months for each SRE (18.2%, 5.1%, 4.6%, 5.0%, and 1.3% for radiotherapy, vertebral fracture, other fracture, bone surgery, and spinal cord compression, respectively, for zoledronic acid, and 21.6%, 9.0%, 6.7%, 5.9%, and 1.9%, respectively for clodronic acid) were partitioned into intervals based on the treatment-specific estimates of percentage of first SREs occurring during months 1–6, 7–12, 13–24, and 24–42 of follow-upCitation14. Treatment- and period-specific cumulative incidence estimates for each SRE and treatment were then converted to monthly probabilities.
Adverse events
Estimates of the incidence of adverse events for zoledronic acid and clodronic acid (3.6% vs 0.3%, p < 0.0001) were obtained from reported results of the MRC Myeloma IX trialCitation17. Confirmed osteonecrosis of the jaw was uncommon, but rates were significantly higher for zoledronic acid than for clodronic acid (3.6% vs 0.3%, p < 0.0001). None of these events required bone surgery. Although the incidence of thromboembolic events also was higher among patients receiving zoledronic acid (16% vs 12.0%, p = 0.01), the bulk of the imbalance in such events was due to an increased number of events associated with the use of an indwelling catheter. Because use of such catheters is no longer standard practice, this observation may be of limited relevance to current practices. The incidence of serious, treatment-emergent musculoskeletal, connective tissue, and bone disorders also was higher amongst zoledronic acid patients (1.7% vs 0.2%, p = 0.0007), likely reflecting acute phase reactions such as transient arthralgia, bone pain, and fever that are well known side-effects of zoledronic acid administrationCitation8,Citation26. The incidence of these events was low however (<2%), and treatment of such events is generally limited (i.e., paracetamol or non-steroidal anti-inflammatory drugs). The incidence of acute renal failure, which was defined to include a variety of clinical parameters and was not limited to the need for dialysis, was similar in the two groups (5.8% for zoledronic acid vs 6.1% clodronic acid, p = 0.78). Given these findings and considerations, the model considers the effects of ONJ on costs; effects of other adverse events on costs were not considered explicitly. Effects of AEs on quality-of-life were captured implicitly based on utility values collected during the MRC Myeloma IX trial.
Costs
Drug costs for zoledronic acid were obtained from Novartis Pharmaceuticals UK. Drug costs for clodronic acid and thalidomide maintenance therapy were obtained from the latest version of the British National Formulary (BNF)Citation27. The costs of administration of zoledronic acid were based on a costing algorithm used in a recent economic evaluation of the cost-effectiveness of zoledronic acid for prevention of SREs in patients with bone metastases of renal cell carcinoma from the perspectives of the UK, German, and French healthcare systemsCitation28. This algorithm was based on a time and motion study detailing the tasks and resource consumption associated with the use of zoledronic acidCitation29. To estimate duration of treatment with zoledronic acid and clodronic acid, time to discontinuation (TTD) was assumed to be distributed as a Weibull function with shape (gamma) parameters the same as those for PFS, and lambda calculated to yield median TTDs for zoledronic acid and clodronic acid reported in the MRC Myeloma IX trial (∼12 months for both groups)Citation17. TTD for thalidomide maintenance therapy was estimated similarly, with TTD assumed to be distributed as a Weibull function with shape parameters equal to those for PFS and with lambdas calibrated to yield median TTD of 7 monthsCitation16.
Published estimates of the costs of treatment of SREs in patients with multiple myeloma in the UK are unavailable. These costs were, therefore, based on costing algorithms used in the aforementioned economic evaluation of the cost-effectiveness of zoledronic acid for prevention of SREs in patients with bone metastases of renal cell carcinoma from the perspectives of the UK, German, and French healthcare systemsCitation28. The costs of ONJ were based on a costing algorithm reported in a recent cost-effectiveness evaluation of oral clodronic acid compared with oral ibandronate, intravenous zoledronate, or intravenous pamidronate in breast cancer patientsCitation30. Because no patients with ONJ in the MRC Myeloma IX trial required surgery (grade I or II), the costs of surgical treatment were not included in the cost of ONJ treatment in the base-case. A sensitivity analysis was conducted in which it was assumed that all patients with ONJ require bone surgery. Costs of routine follow-up and monitoring were based on treatment algorithms from the aforementioned Technology Assessment Report of the clinical and cost-effectiveness of bortezomib and thalidomide for the first-line treatment of multiple myelomaCitation20. For costs of zoledronic acid administration, treatment of SREs, treatment of ONJ, and routine follow-up, unit costs were based on the most recent information on UK NHS reference costs for inpatient and outpatient staysCitation31,Citation32, medical professional servicesCitation33, and suppliesCitation34.
Utilities
Utility values in the model were estimated based on self-reported EQ-5D assessments collected in the MRC Myeloma IX trial. The EQ-5D is a brief, multi-attribute measure covering five domains of HRQOL, each with three levels, yielding 243 possible distinct health states, with utility values for each state obtained from community preference weightsCitation35. In the MRC Myeloma IX trial, the EQ-5D was administered pre-initial randomization (baseline), 3 months post-initial randomization, and 3 months post-maintenance randomization (if applicable). Of 1960 patients in the intent to treat population, 1551 patients (79%) had valid EQ-5D assessments at baseline, 1440 (73%) had valid EQ-5D assessments at 3 months post-initial randomization, and 682 (35%) had valid assessments at 3 months post-maintenance randomization. Mean (SD) EQ-5D utility at baseline was 0.49 (0.38) for zoledronic acid and 0.48 (0.37) for clodronic acid. From baseline to 3 months post-initial randomization, the mean (SD) utility value increased to 0.57 (0.30) in the zoledronic acid group and to 0.55 (0.30) in the clodronic acid group. At the 3 months post-maintenance randomization, the mean (SD) utility value increased to 0.66 (0.26) in the zoledronic acid group and to 0.67 (0.27) in the clodronic acid group.
In the model, utility values for PFS at time zero were based on the mean utility value at baseline for the zoledronic acid and clodronic acid groups combined (0.485). Utility values during each month of the first year after treatment initiation were derived from the treatment-group specific increase in mean utility from baseline to 3 months post-initial randomization and from 3 months post-initial randomization to 3 months post-maintenance randomization, assuming that the 3 months post-maintenance randomization assessment was ∼12 months after initial randomization, and that mean utility values increase linearly over time during each period. Because the EQ-5D was not administered after progression in the MRC Myeloma IX trial, health-related quality-of-life was assumed to return to the baseline level after progression for both treatment groups (i.e., post-progression utility was assumed to be equal to 0.485). Because EQ-5D assessments from the MRC Myeloma trial may be presumed to reflect the effects of SREs on patient health-related quality-of-life, estimates of the effects of SREs and adverse events on health-related quality-of-life were not required.
Analyses
Base-case analyses
For each treatment strategy, expected PFLYs, PPLYs, overall LYs, QALYs, and costs (medication, administration, treatment of adverse events, treatment of SREs, thalidomide, and total costs) were calculated. Expected PFLYs, PPLYs, overall LYs, and QALYs were calculated on a discounted and undiscounted basis. Expected costs were calculated on a discounted basis. An annual discount rate of 3.5% was employed as recommended by NICECitation36.
Probabilistic sensitivity analyses
Probabilistic sensitivity analyses were conducted by simultaneously sampling from estimated probability distributions of model parameters to obtain 1000 sets of model input estimatesCitation37. When sampling the HRs for OS and PFS of CLO vs ZOL, we assumed that treatment effects on PFS and OS would be correlated, with a correlation coefficient equal to 0.79 from a study of the association between PFS and OS in various metastatic cancersCitation38. Cumulative incidence of adverse events and SREs were assumed to be distributed as beta random variables. Other estimates were assumed to be distributed as either normal or log-normal random variables. If standard errors (SEs) for model estimates were unavailable, they were assumed to be 25% of their base-case estimates. For each simulation, we calculated the differences between zoledronic acid and clodronic acid in costs and QALYs. Ninety-five per cent confidence intervals (95% CIs) for incremental costs and QALY were calculated based on the 2.5 and 97.5 percentiles of these simulations. Cost-effectiveness acceptability curves, which represent the probability that a strategy has a favourable cost-effectiveness ratio relative to the alternative strategy given a decision-maker’s defined maximum acceptable ceiling ratio (λ) (e.g., willingness to pay [WTP] for a QALY), were calculated for zoledronic acid vs no zoledronic acidCitation39.
Deterministic sensitivity analyses
Deterministic sensitivity analyses were undertaken to explore the impact on the ICER of zoledronic acid by changing assumptions concerning key model parameter values. Key model probabilities and costs were varied across their 95% CIs if available or from 50–150% of base-case values otherwise. Cost-effectiveness was calculated using annual discount rates of 3.5% for both costs and benefits. Several alternative approaches were employed to project OS beyond the duration of the MRC Myeloma IX trial. First, OS for zoledronic acid after 5 years was estimated based on an independent Weibull survival function fit to Kaplan Meier data for zoledronic acid from the MRC Myeloma IX trial. With this analysis, the estimated HR for PFS and OS for zoledronic acid vs clodronic acid is not employed in the model and no assumption regarding proportionality of hazards is required. Second, OS for zoledronic acid for the entire model timeframe was estimated by applying to the estimated OS for clodronic acid the estimated HR for OS for zoledronic acid vs clodronic acid. With this approach, the empirical survival distribution for zoledronic acid was not employed and proportionality is assumed throughout. Third, OS for clodronic acid for the entire model timeframe was based on the fitted Weibull survival function, while OS for zoledronic acid for the entire model timeframe was obtained by applying to the estimated OS for clodronic acid the estimated HR for OS for zoledronic acid vs clodronic acid. With this approach, neither of the empirical survival distributions were used directly in the model (the empirical survival distribution for clodronic acid is used indirectly to estimate the Weibull survival function). Last, OS for both clodronic acid and zoledronic acid for the entire model timeframe were estimated based on the fitted Weibull survival functions. With this approach the estimated HR for OS for zoledronic acid vs clodronic acid was not employed and, hence, no assumption regarding proportionality of hazards is required. Also, the empirical survival distributions are not used directly in the model. An analysis also was conducted in which the cut-off point for projecting OS based on the Weibull functions was set to the median OS for zoledronic acid and clodronic acid (48 and 43 months, respectively) rather than 60 months for both. An analysis also was conducted in which the benefits of zoledronic acid on OS are conservatively assumed to persist for 6 years only. This was accomplished by setting the HR for OS for zoledronic acid vs clodronic acid after 72 months equal to 1.0.
Branded zoledronic acid (ZOMETA®) is anticipated to go off patent in 2013. It is anticipated that the price of generic zoledronic acid will be no more than 50% of the price of ZOMETA®. Three scenarios were conducted to represent the results, assuming switching to generic zoledronic acid. In the first, the price of zoledronic acid is set to 50% of the base-case value after 2 years. This scenario represents results for patients initiating therapy in 2011 assuming generic availability in 2013. In the second, the price of zoledronic acid is set to 50% of the base-case value after 1 year. This scenario represents results for patients initiating therapy in 2012 assuming generic availability in 2013. In the third, the price of zoledronic acid is set to 50% of the base-case value at baseline. This scenario represents results for patients initiating therapy in 2013 assuming generic availability in 2013. Note that it is assumed that there is no discontinuation of therapy associated with generic substitution.
Results
Base-case results
Base-case results are presented in . Compared with clodronic acid, life expectancy (undiscounted) was increased by 0.83 years with zoledronic acid. Total QALYs gained with zoledronic acid vs clodronic acid were 0.42. On a discounted basis, total QALYs gained were 0.30. Expected lifetime costs of bisphosphonate therapy (including administration and monitoring costs) were £1825 greater with zoledronic acid vs clodronic acid. Expected costs of SREs were reduced by £277 with zoledronic acid vs clodronic acid. Expected costs of ONJ were increased by £6 with zoledronic acid vs clodronic acid. Expected total lifetime costs were increased by £1653 with zoledronic acid vs clodronic acid. The ICER for zoledronic acid vs clodronic acid was £5443 per QALY gained.
Table 2. Base-case results.
Probabilistic sensitivity analyses
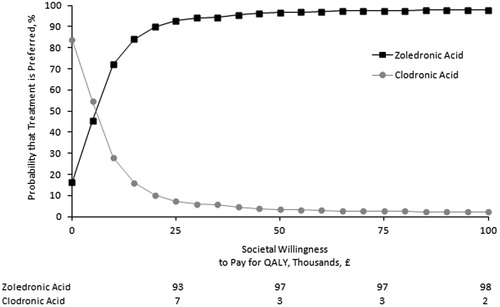
Acceptability curves for zoledronic acid and clodronic acid are reported in . The probability that zoledronic acid is preferred to clodronic acid was 90% with a cost-effectiveness threshold of £20,000 per QALY and 94% with a threshold of £30,000 per QALY.
Figure 2. Cost-effectiveness acceptability curves for zoledronic acid and clodronic acid.
Deterministic sensitivity analyses
Results of deterministic sensitivity analyses are presented in . Results are generally relatively insensitive to changes in parameters reflected in the various scenarios. Cost-effectiveness of zoledronic acid vs clodronic acid was below the threshold of £20,000 per QALY gained in all scenarios. Cost-effectiveness was £8405 per QALY gained if benefits of zoledronic acid on PFS and OS are conservatively assumed to persist for 5 years only (i.e., HR for PFS = 1.0 and HR for OS = 1.0 after 5 years). Cost-effectiveness was £19,378 per QALY gained if the model duration is set to 5 years.
Table 3. Deterministic sensitivity analyses.
If the price of zoledronic acid is set to 50% of the base-case value after 2 years (representing results for patients initiating therapy in 2011 assuming generic availability in 2013), cost effectiveness is £3091 per QALY gained. If the price of zoledronic acid is set to 50% of the base-case value after 1 year (representing results for patients initiating therapy in 2012 assuming generic availability in 2013), cost effectiveness is £1073 per QALY gained. If the price of zoledronic acid is set to 50% of the base-case value at baseline (representing results for patients initiating therapy on or after 2013 assuming generic availability in 2013), zoledronic acid is dominant.
Discussion
This study was an evaluation of the cost-effectiveness of zoledronic acid vs clodronic acid in patients with newly-diagnosed multiple myeloma from the UK healthcare system perspective. Cost-effectiveness was evaluated using a partitioned survival analysis model reporting findings of the MRC Myeloma IX trial and other sources. Results of this analysis suggest that the cost-effectiveness of zoledronic acid vs clodronic acid is well below the threshold values typically used to evaluate novel therapies in the UK (£20,000–£30,000 per QALY)Citation40,Citation41. These results suggest that zoledronic acid is a cost-effective use of healthcare resources in multiple myeloma patients in this setting.
This evaluation was based on assumptions regarding treatment effects of zoledronic acid on PFS and OS beyond the period of follow-up currently reported in the MRC Myeloma IX trial. The precise magnitude of lifetime treatment effects are uncertain. However, the cost-effectiveness of zoledronic acid was favourable, even under the highly conservative scenario in which the timeframe of the model was limited to 5 years (somewhat less than the maximum duration of reported follow-up in the trial). It is unlikely, therefore, that additional data on PFS and OS would alter the conclusions of this analysis.
Utility values during PFS were based on EQ-5D assessments from the MRC Myeloma IX trial. Although mean utility values at 3 months post-maintenance randomization were slightly lower for zoledronic acid than clodronic acid, the difference (0.01) was not statistically significant or clinically meaningfulCitation42. Also, utility values at 3 months post-maintenance randomization were based on a relatively small proportion of the overall population, and these estimates may not be representative of quality-of-life in the overall study population. These estimates should be interpreted cautiously. Because we assumed that the increase in utility during PFS would be greater with clodronic acid than with zoledronic acid, our results may be conservative. Also, information on utilities post-progression was not available from the MRC Myeloma trial. This utility was therefore assumed to be the same as that at baseline (0.485). This estimate is not unreasonable, however, as it implies a disutility of ∼0.20 with progression, which is similar to that used in other cost-effectiveness evaluations of myeloma therapiesCitation19,Citation20.
We estimated that treatment with zoledronic acid reduced the costs of SREs by £277. This result was based on estimates of the incidence of SREs from the MRC Myeloma IX trial. Because patients in typical clinical practice may not undergo routine radiological assessment to identify SREs, the incidence of SREs observed in typical clinical practice may be less than that reported in controlled trials. We may, therefore, have over-estimated the savings that might be achieved by preventing SREs with zoledronic acid. However, the model was insensitive to assumptions regarding the incidence and cost of SREs. Even assuming no savings from the prevention of SREs, the cost-effectiveness of zoledronic acid would be less than £10,000 per QALY gained.
The price of zoledronic acid in the base-case was based on the price of ZOMETA®. ZOMETA® is projected to lose patent protection in the UK in 2013, at which time it is expected that one or more generic version of the drug will be available at a substantially discounted price. If patients switch from ZOMETA® to generic zoledronic acid, or initiate treatment with generic zoledronic acid when it becomes available, the costs of lifelong therapy may be reduced and cost-effectiveness improved. Our results may, therefore, be conservative. Switching from branded to generic treatment may increase risk of treatment discontinuation due to the so-called ‘nocebo’ effectCitation43. Further research is required to evaluate the potential cost-effectiveness of treatment with ZOMETA® with generic substitution to zoledonic acid.
Conclusion
The cost-effectiveness of zoledronic acid vs clodronic acid in patients with newly-diagnosed myeloma is below the threshold of £20,000 per QALY typically used to determine whether a treatment is cost-effective in the UK. Zoledronic acid, therefore, represents a cost-effective treatment alternative in patients with multiple myeloma.
Transparency
Declaration of funding
Funding for this research was provided to PAI (Policy Analysis Inc.) by Novartis Pharmaceuticals Corp.
Disclosure of financial/other relationships
Thomas E. Delea and Jason Rotter are employees of Policy Analysis Inc. (PAI), which has received research funding and consulting fees from Novartis. David Chandiwana, Manjinder Bains, and Khalid El Ouagari are employees of Novartis and own stock and/or stock options in Novartis. Satyin Kaura was an employee of Novartis at the time this research was conducted and owns stock and/or stock options in Novartis.
Acknowledgements
We thank Alex J Szubert for his assistance in providing information from MRC Myeloma IX trial.
References
- Cancer Research UK. CancerStats – Incidence 2008 – UK. http://info.cancerresearchuk.org/prod_consump/groups/cr_common/@nre/@sta/documents/generalcontent/cr_072111.pdf. Accessed January 30, 2012
- Cancer Research UK. Multiple Myeloma. UK Incidence Statistics. http://info.cancerresearchuk.org/cancerstats/types/multiplemyeloma/incidence/. Accessed January 30, 2012
- National Cancer Intelligence Network. Cancer Prevalence, One, Five, and Ten-Year Data. http://www.ncin.org.uk/Prevalence/1_5_10_Year/atlas.html. Accessed January 30, 2012
- Cancer Research UK. Multiple Myeloma Survival Statistics. http://info.cancerresearchuk.org/cancerstats/types/multiplemyeloma/survival/. Accessed January 30, 2012
- Mhaskar R, Redzepovic J, Wheatley K, et al. Bisphosphonates in multiple myeloma. Cochrane Database Syst Rev 2010;CD003188.
- Corso A, Ferretti E, Lunghi M, et al. Zoledronic acid down-regulates adhesion molecules of bone marrow stromal cells in multiple myeloma: a possible mechanism for its antitumor effect. Cancer 2005;104:118-125
- Croucher PI, De Hendrik R, Perry MJ, et al. Zoledronic acid treatment of 5T2MM-bearing mice inhibits the development of myeloma bone disease: evidence for decreased osteolysis, tumor burden and angiogenesis, and increased survival. J Bone Miner Res 2003;18:482-92
- Rosen LS, Gordon D, Kaminski M, et al. Zoledronic acid versus pamidronate in the treatment of skeletal metastases in patients with breast cancer or osteolytic lesions of multiple myeloma: a phase III, double-blind, comparative trial. Cancer J 2001;7:377-87
- Scavelli C, Di Pietro G, Cirulli T, et al. Zoledronic acid affects over-angiogenic phenotype of endothelial cells in patients with multiple myeloma. Mol Cancer Ther 2007;6:3256-62
- Shipman CM, Rogers MJ, Apperley JF, et al. Bisphosphonates induce apoptosis in human myeloma cell lines: a novel anti-tumour activity. Br J Haematol 1997;98:665-72
- Uchida R, Ashihara E, Sato K, et al. Gamma delta T cells kill myeloma cells by sensing mevalonate metabolites and ICAM-1 molecules on cell surface. Biochem Biophys Res Commun 2007;354:613-8
- Aviles A, Nambo MJ, Neri N, et al. Antitumor effect of zoledronic acid in previously untreated patients with multiple myeloma. Med Oncol 2007;24:227-30
- Morgan G, Davies F, Gregory W, et al. Evaluating the effects of zoledronic acid (ZOL) on overall survival (OS) in patients (Pts) with multiple myeloma (MM): results of the Medical Research Council (MRC) Myeloma IX study. ASCO Meeting Abstracts 2010;28(15 Suppl):8021
- Morgan G, Davies FE, Gregory WM, et al. Zoledronic Acid (ZOL) significantly reduces Skeletal-Related Events (SREs) versus Clodronate (CLO) in Patients (Pts) with Multiple Myeloma (MM): results of the Medical Research Council (MRC) Myeloma IX Study. Abstract 1132O. 35th European Society of Medical Oncology (ESMO) Congress, October 8, 2010, Milan, Italy. Ann Oncol 2010;21(8 Suppl):viii350-62
- Morgan GJ, Davies FE, Gregory WM, et al. Optimising bone disease in myeloma; zoledronic acid plus thalidomide combinations improves survival and bone endpoints: results of the MRC Myeloma IX Trial. ASH Annual Meeting Abstracts 2010;116:311
- Morgan GJ, Gregory WM, Davies FE, et al. The role of maintenance thalidomide therapy in multiple myeloma: MRC Myeloma IX results and meta-analysis. Blood 2012;119(1):7-15
- Morgan GJ, Davies FE, Gregory WM, et al. First-line treatment with zoledronic acid as compared with clodronic acid in multiple myeloma (MRC Myeloma IX): a randomised controlled trial. Lancet 2010;376:1989-99
- Gelber RD, Goldhirsch A, Cole BF, et al. A quality-adjusted time without symptoms or toxicity (Q-TWiST) analysis of adjuvant radiation therapy and chemotherapy for resectable rectal cancer. J Natl Cancer Inst 1996;88:1039-45
- Hornberger J, Rickert J, Dhawan R, et al. The cost-effectiveness of bortezomib in relapsed/refractory multiple myeloma: Swedish perspective. Eur J Haematol 2010;85:484-91
- Picot J, Cooper K, Bryant J, et al. The clinical and cost-effectiveness of bortezomib and thalidomide for the first-line treatment of multiple myeloma: a systematic review and economic evaluation. Southhampton: Southampton Health Technology Assessments Centre, 2010
- Sonnenberg FA, Beck JR. Markov models in medical decision making: a practical guide. Med Decis Making 1993;13:322-38
- Mittmann N, Evans WK, Rocchi A, et al. Addendum to CADTH’s guidelines for the economic evaluation of health technologies: specific guidance for oncology products. Ottawa: Canadian Agency for Drugs and Technologies in Health, 2009
- Siegel JE, Torrance GW, Russell LB, et al. Guidelines for pharmacoeconomic studies. Recommendations from the panel on cost effectiveness in health and medicine. Panel on cost Effectiveness in Health and Medicine. Pharmacoeconomics 1997;11:159-68
- Weinstein MC, O'Brien B, Hornberger J, et al. Principles of good practice for decision analytic modeling in health-care evaluation: report of the ISPOR Task Force on Good Research Practices–Modeling Studies. Value Health 2003;6:9-17
- Carroll KJ. On the use and utility of the Weibull model in the analysis of survival data. Control Clin Trials 2003;24:682-701
- Rosen LS, Gordon D, Kaminski M, et al. Long-term efficacy and safety of zoledronic acid compared with pamidronate disodium in the treatment of skeletal complications in patients with advanced multiple myeloma or breast carcinoma: a randomized, double-blind, multicenter, comparative trial. Cancer 2003;98:1735-44
- Royal Pharmaceutical Society of Great Britain and British Medical Association. British National Formulary No. 59. London; 2010
- Botteman MF, Meijboom M, Foley I, et al. Cost-effectiveness of zoledronic acid in the prevention of skeletal-related events in patients with bone metastases secondary to advanced renal cell carcinoma: application to France, Germany, and the United Kingdom. Eur J Health Econ 2011;12(6):575-88
- DesHarnais Castel L, Bajwa K, Markle JP, et al. A microcosting analysis of zoledronic acid and pamidronate therapy in patients with metastatic bone disease. Support Care Cancer 2001;9:545-51
- Paterson A, McCloskey E, Redzepovic J, et al. Cost-effectiveness of oral clodronate compared with oral ibandronate, intravenous zoledronate or intravenous pamidronate in breast cancer patients. J Int Med Res 2008;36:400-13
- Department of Health. Appendix NSRC004: NHS 2009-2010 NHS Trusts and PCTs combined reference costs schedules. http://www.dh.gov.uk/en/Publicationsandstatistics/Publications/PublicationsPolicyAndGuidance/DH_123459. Accessed January 30, 2012
- Department of Health. National schedule of reference costs year: ‘2008–09’ - NHS Trusts and PCTs combined non-elective inpatient (Long stay) HRG Data. http://www.dh.gov.uk/en/Publicationsandstatistics/Publications/PublicationsPolicyAndGuidance/DH_111591. 2010. Accessed January 30, 2012
- Curtis L. Unit costs of health and social care 2010. Canterbury: Personal Social Services Research Unit, University of Kent, 2010
- Medisave. 2011. http://www.medisave.co.uk/. Accessed April 4, 2011
- Pickard AS, Wilke CT, Lin HW, et al. Health utilities using the EQ-5D in studies of cancer. Pharmacoeconomics 2007;25:365-84
- National Institute for Health and Clinical Excellence. Guide to the Methods of Technology Appraisal; 2008. London, UK. http://www.nice.org.uk/media/B52/A7/TAMethodsGuideUpdatedJune2008.pdf. Accessed January 30, 2012
- Briggs A. Probabilistic analysis of cost-effectiveness models: statistical representation of parameter uncertainty. Value Health 2005;8:1-2
- Wilkerson J, Fojo T. Progression-free survival is simply a measure of a drug's effect while administered and is not a surrogate for overall survival. Cancer J 2009;15:379-85
- Lothgren M, Zethraeus N. Definition, interpretation and calculation of cost-effectiveness acceptability curves. Health Econ 2000;9:623-30
- Rawlins MD, Culyer AJ. National Institute for Clinical Excellence and its value judgments. BMJ 2004;329:224-7
- Devlin N, Parkin D. Does NICE have a cost-effectiveness threshold and what other factors influence its decisions? A binary choice analysis. Health Econ 2004;13:437-52
- Pickard AS, Neary MP, Cella D. Estimation of minimally important differences in EQ-5D utility and VAS scores in cancer. Health Qual Life Outcomes 2007;5:70
- Weissenfeld J, Stock S, Lungen M, et al. The nocebo effect: a reason for patients' non-adherence to generic substitution? Pharmazie 2010;65:451-6