Abstract
Objective:
A 12-week clinical trial (TIMES) demonstrated that therapy with tolterodine extended release (TOL) + tamsulosin (TAM) provides clinical benefits vs TOL or TAM monotherapy or placebo (PBO) in men with lower urinary tract symptoms (LUTS) including overactive bladder (OAB). The present analysis estimated the costs and quality-adjusted life-years (QALYs) associated with these therapies from the perspective of the UK healthcare system.
Methods:
TIMES cohorts receiving TOL, TAM, TOL + TAM, or PBO were followed from therapy initiation to 12 weeks. A decision-tree model was used to extrapolate the 12-week results to 1 year (including need for surgery owing to treatment failure at 12 weeks) and to track patients’ outcomes (symptoms, utility, and costs). Because TIMES did not include costs and QALYs, data from the EpiLUTS epidemiologic survey (12,796 males) were used to model a mathematical relationship between LUTS (daytime and nocturnal frequency, urgency episodes, urgency urinary incontinence episodes, and International Prostate Symptom Score [IPSS]), quality-of-life, and utility. This was used to convert improvements in TIMES patients’ LUTS into utility scores and QALYs. The model included drug and surgery procedure costs and hospital length of stay.
Results:
Incremental QALYs of TOL + TAM vs PBO, TAM, and TOL were 0.042, 0.021, and 0.013, and corresponding incremental costs were £189, £223, and −£70, respectively, resulting in cost-utility ratios for TOL + TAM of £4508/QALY gained compared with PBO and £10,381/QALY gained compared with TAM. TOL + TAM combination therapy was both more effective and cost-saving compared with TOL. Univariate sensitivity analyses showed that patient utility was most responsive to changes in drug efficacy on IPSS and urgency episodes. Changing the percentage of patients undergoing surgery did not substantially affect model outcomes. The main limitation of the study was that the relation between LUTS and patient utility was based on an indirect association.
Conclusions:
TOL + TAM combination therapy appears to be cost-effective compared with TOL or TAM monotherapy or PBO in male patients with LUTS.
Introduction
Lower urinary tract symptoms (LUTS) related to benign prostatic hyperplasia (BPH) are the most common condition associated with aging in menCitation1. LUTS often co-exist with symptoms of overactive bladder (OAB)Citation2. This co-existence results from benign growth of the prostate, which can cause bladder outlet obstruction, resulting in LUTS (e.g., urinary hesitancy, intermittency, and weak urinary stream). Bladder outlet obstruction in men can also lead to detrusor overactivity, causing OAB symptoms. The increased pressure that is required to void may lead to structural changes in the bladder. This, in turn, increases the excitability of detrusor smooth muscle cells, which may cause overactivity of the bladder. LUTS caused by bladder muscle overactivity include urinary urgency, with or without urgency urinary incontinence, and increased micturition frequency during the day and at nightCitation3.
The prevalence of LUTS suggestive of BPH increases from 3% among men aged 45–49 years to 24% at age 80 yearsCitation4. In a population-based study, the overall prevalence of OAB in men over age 40 years was estimated at 16%, ranging from 3% at ages 40–44 years to 42% in men over 75 years oldCitation5.
In a study published in 2009, the estimated annual economic impact of OAB in six Western countries ranged from €262 per patient in Spain to €619 in Sweden, with a total annual direct cost burden due to OAB predicted at €3.9 billion in these six countriesCitation6. Besides direct costs, OAB can lead to considerable indirect costs because of lost productivity at work. The latter were estimated at €1.1 billion per year for these countriesCitation6. Because of the aging of the population and increased life expectancy, the burden of disease in patients with LUTS and OAB can be expected to increase substantially. For instance, in 2003, the mean annual treatment costs per patient with LUTS suggestive of BPH were estimated at €858 in the Netherlands. Seventy-five per cent of these costs were drug costs. Predictions for the year 2035 indicate that these costs are expected to more than doubleCitation7,Citation8. Cost-effective management of these conditions is therefore of great interest to payers.
The frequent co-existence of bladder and prostate symptoms adds to the complexity of optimal therapeutic management of male LUTS. Drug therapies that target the prostate only (alpha1-receptor antagonists [alpha-blockers] and 5-alpha-reductase inhibitors) may not alleviate symptoms in patients with predominantly storage symptoms (i.e., daytime urinary frequency, nocturia, urgency, urgency urinary incontinence). Hence, there is increased interest in better defining and diagnosing this specific male patient group with symptoms related to both prostate and bladder problems and treating these patients with drugs that focus on bothCitation3. The addition of an anti-muscarinic agent to alpha-blocker therapy has proven to reduce LUTS more effectively than monotherapy with either agentCitation9–12. The treatment effect of tolterodine extended release (ER), tamsulosin, or both, on individual LUTS in men who met research criteria for both OAB and BPH has been extensively investigated and reported in a randomized, double-blind, placebo-controlled study design: the Tolterodine in Men Efficacy and Safety (TIMES) studyCitation9.
Assessments of symptoms, such as daytime and nighttime urinary frequency, urgency, and urgency urinary incontinence, as well as the International Prostate Symptom Score (IPSS) were included in the TIMES study. The results of this study suggested that treatment with tolterodine ER plus tamsulosin for 12 weeks provides more benefit for individual LUTS in male patients compared with monotherapy with either drug or placebo. However, the TIMES study did not report the impact of these therapies on medical resource use and patient utility.
To determine the added value of tolterodine ER plus tamsulosin combination therapy in the optimization of treatment of men with LUTS, physicians and decision-makers must critically appraise the clinical benefits in terms of efficacy, safety, and associated quality-of-life implications. Subsequently, these benefits must be balanced against the corresponding economic consequences, such that costs and effects can be compared with other competing therapeutic strategies included in the TIMES study. Typically, these are assessed by means of a decision analytic model. Accordingly, the research objective of the present analysis was to use a decision analysis to estimate the costs and quality-of-life impact in terms of quality-adjusted life-years (QALYs) associated with these therapies from the perspective of the UK healthcare system.
Patients and methods
Health economic model structure
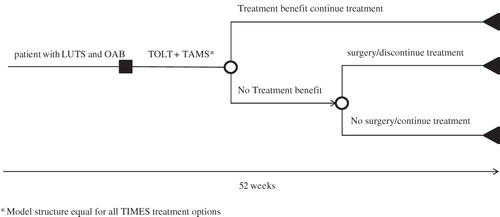
A decision tree was constructed using Microsoft Excel® to evaluate the short-term costs and quality-of-life implications of tolterodine ER plus tamsulosin combination therapy (). The time horizon of the model was 52 weeks. At the beginning of the analysis, male patients were assumed to suffer from moderate-to-severe LUTS, including OAB. They initiated therapy with tolterodine ER plus tamsulosin combination therapy vs a competing treatment strategy to treat their symptoms. After a treatment period of 12 weeks, treatment benefit was evaluated as beneficial or non-beneficial. Patients who benefited from treatment continued therapy throughout the 1-year time horizon. A decision to conduct a surgical procedure to alleviate symptoms was made for a proportion of patients who do not report treatment benefit at week 12. Those who underwent a surgical procedure discontinued medical treatment. The remaining patients stayed on treatment, even though they considered their treatment non-beneficial.
Figure 1. Decision tree model structure for the TIMES study treatment options. LUTS, lower urinary tract symptoms; OAB, overactive bladder; TAMS, tamsulosin; TOLT, tolterodine. *Model structure equal for all TIMES treatment options.
Model input
Patient characteristics, treatment comparisons, treatment effect over time, and transition probabilities
The baseline characteristics of the average patient for individual LUTS and outcomes at week 12 were consistent with those from the TIMES studyCitation9 (). Specifically, the analysis assumed that patients were men aged 40 years or older (mean, 62.8 years) who had a total IPSS of 12 or higher and an IPSS quality-of-life item score of 3 or higher, a self-rated bladder condition of at least moderate bother, and a bladder diary documenting micturition frequency (≥8 micturitions per 24 h) and urgency (≥3 episodes per 24 h), with or without urgency urinary incontinenceCitation9.
Table 1. Lower urinary tract symptoms at baseline and treatment effects after 12 weeks of drug treatment in the TIMES study used as model inputs.
At model entry, patients received placebo, tolterodine ER 4 mg, tamsulosin 0.4 mg, or tolterodine ER 4 mg plus tamsulosin 0.4 mg for 12 weeks. Surgical treatment was an option in patients who did not respond to medical therapy and continued to have bothersome LUTSCitation13,Citation14. To accommodate the possibility of surgical treatment in the model, it was assumed that 50% of the patients who did not report treatment benefit, despite 12 weeks of therapy, would be eligible for a surgical procedure and, consequently, would discontinue drug treatment. The effects of surgery on symptom improvement were modeled consistent with the results after transurethral resection of the prostate (TURP) from a study by Tkocz and PrajsnerCitation15; TURP was chosen as the surgical procedure because it is one of the most conventional surgical interventions to alleviate LUTSCitation13.
The relative reduction in IPSS, daytime voids, and nighttime voids after surgery has been reported as 70%, 28%, and 63%, respectively, at 24 months. However, more recent insights into the specific improvement in LUTS after surgery has indicated that symptom improvement is apparent within the first 3 months after surgery and remains constant thereafter until at least 5 yearsCitation16. Therefore, in the current model, LUTS were assumed to improve within the first 3 months after surgery and remain constant thereafter. For all patients in the treatment arms who did not receive surgery, it was assumed that observations from the TIMES study at week 12 () could be extrapolated to 52 weeks. This assumption was based on the observation from the TIMES studyCitation9 that the relative difference in symptoms already remained relatively constant between week 6 and 12.
Quality-of-life and utilities
To calculate utility values over time and determine QALYs, the composite of patients’ individual LUTS had to be translated into a single generic quality-of-life measure. For this purpose, a statistical model was developed to establish a relationship between individual LUTS (i.e., IPSS, urinary frequency, urgency, and urgency urinary incontinence), quality-of-life, and utility. This mathematical relationship, therefore, focuses not only on one specific symptom or disease parameter but on a composite of both bladder and prostate symptoms.
The basis for the statistical model was the male sub-set (n = 12,796) of data from a cross-sectional, population-based study in the US, Sweden, and the UK (EpiLUTS) in which 30,000 men and women reported on the occurrence of individual LUTS during the previous 4 weeksCitation17. Survey respondents were asked to report on their daytime and nighttime urinary frequency, urgency episodes, and occurrence of urgency urinary incontinence episodes and to complete the IPSS questionnaire. Respondents were also requested to complete the SF-12, a generic instrument used to measure health-related quality-of-lifeCitation18. Based on these patient-level data, multinomial logistic regression was applied, by means of R software for statistical computing version 2.13.1 (available at: http://www.R-project.org/), to establish the relationship between individual LUTS and SF-12 scores. Subsequently, the time-varying observations on LUTS, reported in the TIMES study, were imputed in these regressions to obtain corresponding SF-12 score estimates. Finally, estimation of a single generic quality-of-life measure was accomplished by mapping of SF-12 profiles to EQ-5D health states and converting the latter into utility scores. Published algorithms by DolanCitation19 and Gray et al.Citation20 were used to predict these utility values.
Please see the supplementary statistical appendix for a more detailed description of the statistical model for mapping of individual LUTS to a patient utility value.
Resource use and costs
The model included drug costs and costs for surgery. The daily drug costs for tolterodine ER 4 mg and tamsulosin 0.4 mg (in 2010) were £0.92 and £0.15, respectivelyCitation21. The average cost of TURP (in 2010) was estimated at £1889 using published National Health Service estimates and consumer price index figuresCitation22,Citation23.
Model outcomes
Model outcomes were expressed as incremental costs per QALY gained (primary outcome) and the number of surgical procedures avoided (secondary outcome).
Sensitivity analyses
Deterministic and probabilistic sensitivity analyses were performed to determine the influence of uncertainty on the final results. Parameter estimates were varied within their uncertainty distributions that best reflect the nature of each specific parameter. Normal distributions were used for the regression coefficients of the 12 multinomial model, gamma distributions for cost estimates and LUTS symptoms to avoid values below zero, and beta distributions were applied to probability estimates in the model.
Within the deterministic univariate sensitivity analyses, the impact on incremental QALYs and costs was determined when each model parameter was varied separately within the limits of its 95% confidence intervals. Input parameters for treatment effect, the transition probability to undergo a surgical procedure, surgery costs, and effect of surgery on LUTS were included in the univariate sensitivity analyses. Results of these analyses are presented using tornado graphs. A tornado graph visualizes and orders the model parameters from parameters that have the highest impact on incremental model results to parameters that have the lowest impact on incremental outcomes.
In the probabilistic sensitivity analysis, Monte Carlo simulation was used to represent the scatter in model results when the parameters were varied according to their assumed distributions. Uncertainty surrounding the regression parameters of the series of 12 multinomial models was included in the probabilistic sensitivity analysis. Correlation between different parameters was negligible and therefore ignored (data not shown). The uncertainty surrounding the regression parameters of published algorithms by DolanCitation19 and Gray et al.Citation20 that were also part of the statistical model to estimate quality-of-life and utility were not included in the probabilistic sensitivity analysis because of computer-processing time restrictions. Within the probabilistic sensitivity analysis, 1000 simulations were processed. Based on these simulations, a scatterplot and an acceptability curve were drawn to estimate the probability of tolterodine plus tamsulosin combination therapy being considered cost-effective compared with its comparator treatments at a given willingness-to-pay (WTP) threshold per QALY gained.
Scenario analysis
Several key assumptions were made given a lack of published data. One of the main assumptions in the model was that half of the male patients who did not report treatment benefit at week 12 would be eligible for a surgical procedure. In a scenario analysis, the impact on the incremental model results was determined when this percentage was varied within an extreme range of 0–100%. A second scenario analysis was conducted in which the short-term (1 year) economic impact of an immediate surgical procedure was assessed compared with tolterodine plus tamsulosin combination therapy.
Results
Predicted EQ-5D utility scores, QALYs, and costs
When individual LUTS for the four treatment arms over time are imputed in the statistical model, the association between LUTS and patients’ quality-of-life, expressed as an EQ-5D utility value, can be predicted. Based on their baseline symptom profile, all patients have a predicted utility of 0.578 at model entry (). The improvement in LUTS for combination therapy after 12 weeks of drug treatment resulted in an increase in utility from 0.578 to 0.710, compared with an increase from 0.578 to 0.691 for tolterodine monotherapy and 0.578 to 0.683 for tamsulosin monotherapy. Patient utility improves from week 12 to week 52 for 50% of the non-responders who underwent surgery to further alleviate their LUTS, leading to a total QALY estimate after 1 year of follow-up ranging from 0.716 for combination therapy to 0.671 in the placebo arm.
Table 2. Estimated mean EQ-5D utility values over time, QALYs, and costs for alpha-blocker plus anti-muscarinic combination therapy compared with other TIMES study therapies.
Incremental QALYs during a 1-year period are estimated at 0.042 and 0.013 when combination therapy is compared with placebo and tolterodine monotherapy, respectively. These QALY differences are mainly explained by the higher efficacy of combination therapy in terms of improvements in the IPSS and urinary urgency episodes compared with the other treatment options.
The estimated total 1-year costs consisted of drug and surgery costs. The latter ranged from £198 for combination treatment to £362 in the placebo arm. In the placebo arm, the largest share of patients was assumed to require surgery to alleviate their symptoms. Estimates for surgery costs for tamsulosin and tolterodine monotherapy were £280 and £343, respectively. One-year drug costs ranged from £0 for placebo to £352 for tamsulosin plus tolterodine combination therapy. This led to total incremental costs over a 1-year period ranging from £189 vs placebo to cost savings of −£70 when combination therapy is compared with tolterodine monotherapy. In the latter treatment comparison, incremental drug costs of combination treatment (£352–£277 = £75) are compensated by cost savings (£198–£343 = £145) due to a higher number of patients eligible for surgery when treated with tolterodine monotherapy. As a consequence of positive incremental effects combined with cost savings, combination therapy with tamsulosin plus tolterodine was the dominant treatment strategy compared with tolterodine monotherapy. When the incremental costs of combination therapy compared with tamsulosin monotherapy are divided by the corresponding value for incremental QALYs, the cost-utility ratio for this treatment comparison was estimated at £10,381 per QALY gained.
The predicted number of surgical procedures avoided over a short-term period of 1 year was five per 100 men in this treatment comparison, due to the observation that fewer patients reported treatment benefit on tamsulosin monotherapy compared with combination therapy. However, this statement must be interpreted cautiously. It reflects a 1-year period and was based on the observed number of patients who reported treatment benefit after a 12-week treatment period. It is acknowledged that this effect might erode when long-term data are available that allow economic modeling of LUTS over a longer timeframe than 1 year.
Sensitivity analyses
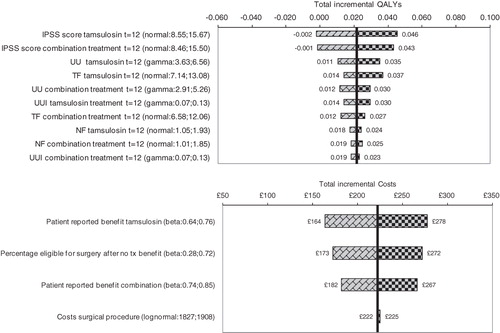
presents the results of the deterministic univariate sensitivity analyses of tamsulosin plus tolterodine combination treatment vs monotherapy with tamsulosin. The tornado graph for incremental effects shows that the incremental QALYs are most sensitive to variations in the treatment effect of both treatment alternatives on the IPSS and urinary urgency episodes. Incremental costs over a 1-year period change from £164 to £278 when the percentage of patients treated with tamsulosin who reported benefit of their drug treatment is varied within the limits of its 95% confidence interval (i.e., 64–76%). Results of the univariate sensitivity analyses were very similar for the other two comparisons. Therefore, the tornado graphs for incremental QALYs and costs for combination treatment vs tolterodine monotherapy and placebo are presented in the supplementary appendix on model results.
Figure 2. Overview of the results of the univariate sensitivity analyses for tamsulosin plus tolterodine combination therapy vs tamsulosin monotherapy: Tornado graphs that present the impact on incremental effects (top) and incremental costs (bottom) when changing parameters within their outer limits of their 95% confidence intervals according to their uncertainty distributions (not all parameters are shown in these graphs). IPSS, International Prostate Symptom Score; NF, nighttime urinary frequency; TF, total 24-h urinary frequency; QALY, quality-adjusted life-year; UU, urinary urgency; UUI, urgency urinary incontinence.
The results of the probabilistic sensitivity analysis of the three comparisons are presented as a scatterplot and an acceptability curve (). The top graph represents the scatter in estimates for incremental costs and effects as a result of 1000 simulations of the probabilistic sensitivity analysis. Based on these simulations, 95% confidence intervals for incremental effects (–0.015–0.069) and costs (£126–£302) are estimated for the comparison of tamsulosin plus tolterodine combination therapy vs tamsulosin monotherapy. The prediction that combination therapy resulted in positive effects compared with tamsulosin was 86%. Furthermore, tamsulosin plus tolterodine combination therapy had a 14% probability of being less effective and more expensive and a 86% probability of being more effective and more expensive. For the comparison of tamsulosin plus tolterodine combination therapy vs tolterodine, 95% confidence intervals for incremental effects and costs were estimated at −0.024–0.059 and −£168–£12, respectively. Corresponding estimates when tamsulosin plus tolterodine is compared with placebo were −0.003–0.096 for incremental effects and £64–£290 for incremental costs.
Figure 3. Results of the probabilistic sensitivity analysis of the three model comparisons. Top: Scatterplot representing uncertainty surrounding the central estimate of incremental costs and effects of tamsulosin plus tolterodine combination therapy vs its comparators. Bottom: Acceptability curves: estimated probability that a specific treatment strategy is cost-effective given different values of the willingness-to-pay (WTP) threshold. QALY, quality-adjusted life-year.
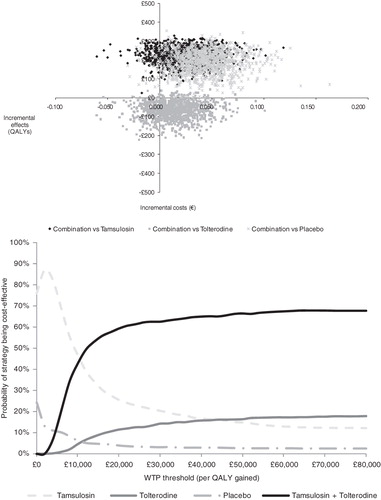
The acceptability curve demonstrates that when society’s WTP for drug treatment is low, tamsulosin monotherapy is estimated to be the most cost-effective treatment option. Tamsulosin plus tolterodine combination therapy becomes the most cost-effective treatment option at a WTP level above £10,000. As the generally accepted WTP threshold in the UK is £30,000 per QALY, tamsulosin plus tolterodine combination therapy is suggested to be an attractive treatment strategy from both a clinical and economic perspective.
In an additional scenario analysis, the cost-utility ratio of tamsulosin plus tolterodine combination treatment vs tamsulosin monotherapy ranged from £5,616–£14,324 when the percentage of patients eligible for a surgical procedure was varied between 0–100%. Combination therapy resulted in short-term total QALY gains of 0.020 and cost savings of £1496 compared with a scenario where all patients would undergo a surgical procedure upfront. Naturally, these cost savings will probably decrease when long-term clinical data allow economic modeling beyond a 1-year period.
Discussion
The current analysis was designed to assess the quality-of-life impact and cost-effectiveness of alpha-blocker plus anti-muscarinic combination therapy in men with LUTS related to concomitant BPH and OAB. The analysis was conducted from a payer’s perspective in accordance with the NICE guidelines for technology appraisals. In the base case analysis, tolterodine plus tamsulosin combination therapy was estimated to result in 0.021 incremental QALYs combined with incremental costs of £223 compared with tamsulosin monotherapy. Compared with tolterodine monotherapy, incremental QALYs were predicted at 0.013. Additionally, combination treatment results in estimated cost savings of −£70 over a 1-year period and was therefore labeled as the dominant therapy over tolterodine monotherapy. The sensitivity analyses revealed that the estimated QALYs were most sensitive to changes in the effect of the drug on the IPSS and the number of urinary urgency episodes. The probability that tolterodine plus tamsulosin combined additional effectiveness with higher costs was estimated at 86%, with a 14% probability that the drug was less effective and more costly.
The results of this analysis could be explained by a straightforward mechanism. Patients with bothersome LUTS at baseline may receive drug treatment with or without surgery over time to alleviate their symptoms. Drug treatment costs are highest for patients receiving combination therapy with tolterodine plus tamsulosin. However, this is also the most effective drug treatment optionCitation9. This leads to increased benefits in patient’s individual LUTS and consequently may result in quality-of-life benefits and in postponement of a costly surgical procedure.
The utilities for patients with LUTS related to concomitant BPH and OAB, that were estimated by means of a statistical model based on a series of 12 multinomial regressions, were incorporated in a health economic framework using a decision-tree structure. To our knowledge, this is the first effort that has been made to estimate cost-effectiveness in patients with both bladder- and prostate-related symptoms. Other studies that determined the cost-effectiveness of treatments have focused on alleviation of predominantly bladder symptomsCitation24,Citation25 or prostate symptomsCitation26–28. As symptoms related to BPH and OAB often co-exist in male patientsCitation2, the current cost-effectiveness study may serve as a useful addition for this specific patient population.
When combination therapy does not provide benefit and symptoms remain bothersome, a choice must be made by the treating physician on the optimal follow-up treatment. Current options to improve symptoms include watchful waiting, continuation of drug therapy, or a surgical procedure. In this health economic model, based on the average patient in the TIMES studyCitation9, the costs and effects of TURP were incorporated as a proxy for the surgical procedure in the model, and applied to half of the patient cohort not responding to therapy. However, it is acknowledged that in clinical practice the decision to undergo surgery and the type and effect of surgery may vary by patient depending on symptom profile.
Another assumption of the current modeling approach is that patient utility values could be estimated indirectly through a number of associations. An indirect association may introduce considerable uncertainty surrounding the point estimates of patient utility and, accordingly, the predicted cost-utility ratios. The combined uncertainty surrounding patient utility estimates is built up from a number of parameters. First, there is uncertainty surrounding the regression parameters of the set of 12 multinomial models that predict answers to each of the SF-12 questions based on patients’ individual LUTS. Second, the uncertainty needs to be included in the parameters of the multinomial model that predict answers to the EQ-5D descriptive system from the SF-12Citation20. Lastly, uncertainty is incorporated surrounding the regression equation that estimates utility values from the EQ-5D descriptive system using the time trade-off methodCitation19. The total uncertainty is captured in a probabilistic sensitivity analysis, where all variables that are uncertain are incorporated. Although the probabilistic sensitivity analysis included uncertainty surrounding point estimates of efficacy and costs, the uncertainty surrounding the utility estimates was limited to the regression parameters of the set of 12 multinomial models that predict answers to each of the SF-12 questions. It was infeasible to include the uncertainty of the remaining regression equations because of computational time restrictions. Therefore, the uncertainty surrounding the utility values may be under-estimated.
As an option for future research to optimize the estimation of the cost-effectiveness of treatments in patients with concomitant bladder and prostate symptoms, patients on a specific treatment strategy could be directly asked to classify their quality-of-life using a generic instrument, such as the EQ-5D. In this way, a more direct relationship between disease status and quality-of-life could be established, thereby limiting the uncertainty that is introduced when using indirect associations. When these patients are followed up for a longer period of time, they may switch or discontinue drug treatment strategies and may undergo a surgical procedure that is most beneficial for their specific prostate or bladder symptoms. These different treatment patterns could then be incorporated in the health economic model structure, extending this structure over a longer period of time. In this case, a more accurate estimate of the cost-effectiveness may be provided for patients who start with alpha-blocker plus anti-muscarinic combination therapy relative to patients who start with another drug treatment or, alternatively, a costly surgical procedure upfront to alleviate their symptoms.
In conclusion, the results of this cost-effectiveness analysis suggest that combination therapy with tolterodine plus tamsulosin is cost-effective compared with monotherapy with either agent or placebo in men with LUTS related to both BPH and OAB, based on a short-term model with a 1-year time horizon.
Transparency
Declaration of funding
This study was funded by Pfizer Inc.
Declaration of financial relationships
BGV, MMLO, MJT, and MFB are employees of Pharmerit International who were paid consultants to Pfizer in connection with the development of this manuscript.
SUPPLEMENTARY APPENDIX ON MODEL RESULTS
Download PDF (136.7 KB)SUPPLEMENTARY FIGURE 1
Download JPEG Image (428.8 KB)
SUPPLEMENTARY FIGURE 2
Download JPEG Image (304.6 KB)
Acknowledgments
This study was conducted by Pharmerit International and funded by Pfizer Inc., New York, USA. The authors had complete access to all data and had final control over the content, review, and submission of the manuscript. Editorial support was provided by Karen Zimmermann, at Complete Healthcare Communications, Inc., and was funded by Pfizer Inc.
References
- Chapple CR. Introduction and conclusions. Improving the management of lower urinary tract symptoms in real life practices. Eur Urol 2001;39(3 Suppl):1-5
- Abdel-Aziz KF, Lemack GE. Overactive bladder in the male patient: bladder, outlet, or both? Curr Urol Rep 2002;3:445-51
- Chapple CR, Roehrborn CG. A shifted paradigm for the further understanding, evaluation, and treatment of lower urinary tract symptoms in men: focus on the bladder. Eur Urol 2006;49:651-9
- Verhamme KM, Dieleman JP, Bleumink GS, et al. Incidence and prevalence of lower urinary tract symptoms suggestive of benign prostatic hyperplasia in primary care–the Triumph project. Eur Urol 2002;42:323-8
- Milsom I, Abrams P, Cardozo L, et al. How widespread are the symptoms of an overactive bladder and how are they managed? A population-based prevalence study. BJU Int 2001;87:760-6
- Irwin DE, Mungapen L, Milsom I, et al. The economic impact of overactive bladder syndrome in six Western countries. BJU Int 2009;103:202-9
- van Exel NJ, Koopmanschap MA, McDonnell J, et al. Medical consumption and costs during a one-year follow-up of patients with LUTS suggestive of BPH in six European countries: report of the TRIUMPH study. Eur Urol 2006;49:92-102
- Polder JJ, Meerding WJ, Koopmanschap MA, et al. [The cost of sickness in the Netherlands in 1994; the main determinants were advanced age and disabling conditions]. Ned Tijdschr Geneeskd 1998;142:1607-11
- Kaplan SA, Roehrborn CG, Rovner ES, et al. Tolterodine and tamsulosin for treatment of men with lower urinary tract symptoms and overactive bladder: a randomized controlled trial. JAMA 2006;296:2319-28
- Lee KS, Choo MS, Kim DY, et al. Combination treatment with propiverine hydrochloride plus doxazosin controlled release gastrointestinal therapeutic system formulation for overactive bladder and coexisting benign prostatic obstruction: a prospective, randomized, controlled multicenter study. J Urol 2005;174:1334-8
- Lee JY, Kim HW, Lee SJ, et al. Comparison of doxazosin with or without tolterodine in men with symptomatic bladder outlet obstruction and an overactive bladder. BJU Int 2004;94:817-20
- Athanasopoulos A, Perimenis P. Efficacy of the combination of an alpha1-blocker with an anticholinergic agent in the treatment of lower urinary tract symptoms associated with bladder outlet obstruction. Expert Opin Pharmacother 2005;6:2429-33
- de la Rosette J, Alivizatos G, Madersbacher S, et al. Guidelines on Benign Prostatic Hyperplasia. Arnhem: European Association of Urology, 2009
- AUA BPH Guideline Update Panel. AUA guideline on the management of benign prostatic hyperplasia: diagnosis and treatment recommendations. Linthicum: AUA Guideline on the Management of Benign Prostatic Hyperplasia (BPH), 2003
- Tkocz M, Prajsner A. Comparison of long-term results of transurethral incision of the prostate with transurethral resection of the prostate, in patients with benign prostatic hypertrophy. Neurourol Urodyn 2002;21:112-6
- Mattiasson A, Wagrell L, Schelin S, et al. Five-year follow-up of feedback microwave thermotherapy versus TURP for clinical BPH: a prospective randomized multicenter study. Urology 2007;69:91-6; discussion 6–7
- Coyne KS, Sexton CC, Thompson CL, et al. The prevalence of lower urinary tract symptoms (LUTS) in the USA, the UK and Sweden: results from the Epidemiology of LUTS (EpiLUTS) study. BJU Int 2009;104:352-60
- Ware J, Jr Kosinski M, Keller SD. A 12-Item Short-Form Health Survey: construction of scales and preliminary tests of reliability and validity. Med Care 1996;34:220-33
- Dolan P. Modeling valuations for EuroQol health states. Med Care 1997;35:1095-108
- Gray AM, Rivero-Arias O, Clarke PM. Estimating the association between SF-12 responses and EQ-5D utility values by response mapping. Med Decis Making 2006;26:18-29
- British Medical Association and Royal Pharmaceutical Society of Great Britain. British National Formulary. http://bnf.org/bnf/index.htm. Accessed January 2010
- UK Office for National Statistics. Consumer price index figures. http://www.statistics.gov.uk/statbase/tsdataset.asp?vlnk=7174&More=Y. Accessed January 2010
- Department of Health. National Health Service Reference Costs 2008-2009. http://www.dh.gov.uk/en/Publicationsandstatistics/Publications/PublicationsPolicyAndGuidance/DH_111591. Accessed January 2010
- Speakman M, Khullar V, Mundy A, et al. A cost-utility analysis of once daily solifenacin compared to tolterodine in the treatment of overactive bladder syndrome. Curr Med Res Opin 2008;24:2173-9
- Hakkaart L, Verboom P, Phillips R, et al. The cost utility of solifenacin in the treatment of overactive bladder. Int Urol Nephrol 2009;41:293-8
- McDonnell J, Busschbach JJ, Kok E, et al. Lower urinary tract symptoms suggestive of benign prostatic obstruction–Triumph: health-economical analysis. Eur Urol 2001;39(3 Suppl):37-41
- DiSantostefano RL, Biddle AK, Lavelle JP. An evaluation of the economic costs and patient-related consequences of treatments for benign prostatic hyperplasia. BJU Int 2006;97:1007-16
- DiSantostefano RL, Biddle AK, Lavelle JP. The long-term cost effectiveness of treatments for benign prostatic hyperplasia. Pharmacoeconomics 2006;24:171-91
STATISTICAL APPENDIX
Multinomial logistic regression models that map individual LUTS to SF-12 responses and application of these regression models within a statistical framework that links LUTS to utility estimates
Three main steps are involved to translate LUTS into single utility values required for the model.
Step 1: Multinomial model estimation that map LUTS to SF-12 responses based on EpiLUTS
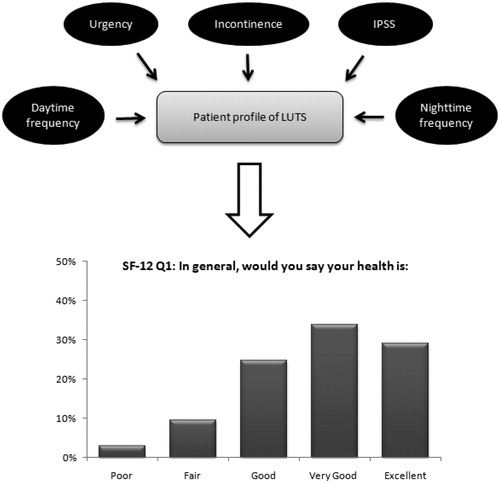
Respondent-level data on urgency episodes, urgency urinary incontinence, daytime and nighttime urinary frequency, and IPSS from the EpiLUTS survey were used to predict the probability for each answer to each of the 12 items of the SF-12. This results in 12 multinomial logistic regression models estimating the relation between individual LUTS and the SF-12. provides a graphical representation of the multinomial model for one of the 12 items of the SF-12, namely “general health.” Similar regression models were fitted for the other SF-12 questions.P can be considered as the dependent variable and represents the probability of patient i of observing outcome J on a specific SF-12 question. This probability depends on a function of the linear combination xiβj. Exponentiation of xiβj gives non-negative probabilities, and exp(xiβj) is normalized (by dividing by the sum of the exponents) to ensure that probabilities sum to 1. In each multinomial model, one outcome of J is set as the reference case, and therefore the regression coefficients for j = 1 are equal to 0. The remaining regression coefficients for other outcomes of J represent the change relative to the J = 1 outcome. This results in the mathematical equations as presented below. These equations represent the multinomial logistic regression model of the first question of the SF-12 (general health). Similar models are estimated for the other 11 items of the SF-12.
Figure 1. Graphical representation of the multinomial model. Patient symptoms profile is mapped to probabilities to give each specific answer on each separate question of the SF-12. Example for the first SF-12 question (general health) with five answering options.
SFi = SF-12 answer given by patient i
j = answering option
P[qDi = 1] = probability of the reference case (in this example answering option 1)
DFi = daytime urinary frequency of patient i
NFi = nighttime urinary frequency of patient i
URGi1-4 = dummy variables to reflect answer given to categorical urgency question by patient i
INCi1-5 = dummy variables to reflect answer given to categorical urgency urinary incontinence question by patient i
IPSSi = International Prostate Symptom Score of patient i
Note that DFi and NFi were log-transformed for reasons of improving normality of the variables
presents the regression coefficients when the multinomial logistic regression models were fitted on the EpiLUTS data. The column headers represent the LUTS covariates from EpiLUTS that were included in the multinomial models. The row headers represent each specific answering option to each of the 12 items of the SF-12, with one answering option per item without coefficients as it was used as the reference case. For example, rows 1 to 4 represent the answering options for the SF-12 item on general health. The first option ‘sfstat1’ was used as the reference case.
Table 1. Multinomial logistic regression model using questions on individual storage and voiding symptoms (column headers) from EpiLUTS as covariates for each SF-12 question (row headers).
Results indicate that, for example, individual IPSS is statistically significantly related to responses to the general health question of the SF-12; the association is also statistically significant between daytime and nighttime urinary frequency, urinary urgency, IPSS, and answers to the SF-12 question regarding whether someone accomplishes less because of his or her health condition.
Step 2: Convert SF-12 responses to utility values based on published algorithms
As a second step, responses to the SF-12 questionnaire were converted into utility values. This was accomplished using published multinomial regression algorithms that map SF-12 responses to the 243 possible combinations of the EQ-5D descriptive system (ie, three response levels to the power of five dimensions)20. These probabilities can then in turn be translated into a single weighted average utility value using the published regression algorithm by Dolan19.
Step 3: Impute LUTS data at baseline and follow-up of the TIMES study
Individual LUTS estimates at baseline and the development of these symptoms over time for patients treated with placebo, tolterodine, tamsulosin, or combination therapy were imputed in the statistical model as a final step to estimate treatment- and time-specific utility values.
Validation of the multinomial regression models for mapping individual LUTS to SF-12 responses
To test whether the estimated regression models accurately predict individual patient responses, the series of regression models on each individual SF-12 question were validated by means of inner and outer sample prediction.
Within the inner sample prediction, multinomial regressions were estimated based on the entire dataset of 12,796 men. For every patient, the answering option of each specific SF-12 question where the model predicts the highest probability was compared with the true observed answer on each question (equation 1).
Equation 1:
p = patient p
k.j = answer k,j
i = question i
The prediction was calculated dividing the total number of predicted and observed matches by the total number of patients who answered the specific SF-12 question.
The dataset of 12,796 men was split into half to conduct the outer sample prediction. Multinomial regression models were estimated based on the first half of the dataset, predicting the SF-12 answers of patients in the second half of the dataset. The same routine was used to calculate the prediction as in the inner sample prediction.
The forecasting performance of the models was expressed as the absolute and relative difference between the predictions and the probabilities of an answer on each specific SF-12 question that one would obtain by chance.
Overall, the inner and outer sample prediction lies around 65% compared with an average probability by chance of 31%. The predictions of the multinomial model were highest for SF-12 questions on accomplishment as a result of emotional problems (83%) and on doing work as carefully as usual (86%). Relative to the probability by chance, predictions of the multinomial model were highest for SF-12 questions on interference with social activities due to physical and emotional problems (68% vs 20%) and on feeling calm and peaceful (50% vs 17%). The prediction was better than chance in all cases with relative improvements ranging from 163% to 339% better than the probability obtained by chance.
Sensitivity analysis: estimation of a regression model to predict the impact on quality of life of each symptom
To provide insight into the specific urinary symptoms that drive patients’ quality of life, a regression model was estimated in which utility was explained by patients’ LUTS profile, including daytime and nighttime frequency, urgency episodes, urgency urinary incontinence, and IPSS as explanatory variables. More specifically, the impact of each separate symptom on quality of life was estimated using ordinary least squares (OLS) regression analysis that was based on 1000 simulations of the LUTS profiles reported in the TIMES study, with each symptom that was varied within their uncertainty distribution. This analysis was done to determine the responsiveness of patient utility when specific symptom improvements are expected due to initiation of drug or surgical treatment.
The OLS regression equation that was estimated is presented below:
Equation 2:
R2 = 0.981
DF = number of daytime voids
NF = number of nighttime voids
URG = number of urinary urgency episodes
INCO = number of urgency urinary incontinence episodes
IPSS = IPSS
This implies for instance that a 10-point decrease in IPSS score is estimated to result in an increase in patient utility of 0.082. Imputing the LUTS of tamsulosin plus tolterodine at baseline and at week 12 (), patient utility is estimated to increase 0.066 due to the effect of combination treatment on IPSS and 0.040 due to the effect on urinary urgency episodes. This regression suggests that a one unit change in urinary urgency incontinence episodes has the highest impact on the utility value.