
Abstract
Objective:
Fingolimod has been shown to be more efficacious than interferon (IFN) beta-1a, but at a higher drug acquisition cost. The aim of this study was to assess the cost-effectiveness of fingolimod compared to IFN beta-1a in patients diagnosed with relapsing-remitting multiple sclerosis (RRMS) in the US.
Methods:
A Markov model comparing fingolimod to intramuscular IFN beta-1a using a US societal perspective and a 10-year time horizon was developed. A cohort of 37-year-old patients with RRMS and a Kurtzke Expanded Disability Status Scale score of 0–2.5 were assumed. Data sources included the Trial Assessing Injectable Interferon vs FTY720 Oral in Relapsing–Remitting Multiple Sclerosis (TRANSFORMS) and other published studies of MS. Outcomes included costs in 2011 US dollars, quality-adjusted life years (QALYs), number of relapses avoided, and incremental cost-effectiveness ratios (ICERs).
Results:
Compared to IFN beta-1a, fingolimod was associated with fewer relapses (0.41 vs 0.73 per patient per year) and more QALYs gained (6.7663 vs 5.9503), but at a higher cost ($565,598 vs $505,234). This resulted in an ICER of $73,975 per QALY. Results were most sensitive to changes in drug costs and the disutility of receiving IFN beta-1a. Monte Carlo simulation demonstrated fingolimod was cost-effective in 35% and 70% of 10,000 iterations, assuming willingness-to-pay thresholds of $50,000 and $100,000 per QALY, respectively.
Limitations:
Event rates were primarily derived from a single randomized clinical trial with 1-year duration of follow-up and extrapolated to a 10-year time horizon. Comparison was made to only one disease-modifying drug—intramuscular IFN beta-1a.
Conclusion:
Fingolimod use is not likely to be cost-effective compared to IFN beta-1a unless fingolimod cost falls below $3476 per month or a higher than normal willingness-to-pay threshold is accepted by decision-makers.
Introduction
Multiple sclerosis (MS) is a debilitating neurologic disorder that affects ∼400,000 Americans, resulting in an estimated annual cost of $6.8 billionCitation1,Citation2. Most patients with MS experience their first symptoms between working age of 20–40 years. Due to the progressive nature of MS caused by accumulated myelin damage in the central nervous system, disease-modifying drugs (DMDs) are often indicated to reduce relapse rates and slow disease progression. Although the duration of therapy is not clear, interferon (IFN) beta is usually initiated early for patients with a definite diagnosis of relapsing–remitting multiple sclerosis (RRMS), and also used for patients who have experienced a first clinical episode suggestive of MS. Current guidelines published by the American Academy of Neurology (AAN) recommend the use of IFN beta for the treatment of patients with RRMS (Level A, Class I)Citation3. Unfortunately, these agents require parenteral administration and are associated with injection-site reactions and flu-like symptoms in greater than 60% of patientsCitation4.
In the Trial Assessing Injectable Interferon vs FTY720 Oral in Relapsing–Remitting Multiple Sclerosis (TRANSFORMS), fingolimod (GilenyaTM, Novartis, East Hanover, NJ)—the first oral DMD approved for the treatment of RRMS in the US—significantly reduced the relative rate of relapse by 52% compared to IFN beta-1a administered intramuscularly (IM) once weeklyCitation5. While fingolimod has been shown to be more efficacious than IFN beta-1a (Avonex®, Biogen Idec, Weston, MA), this incremental improvement in efficacy comes at a higher drug acquisition cost. Here, we report the results of a Markov model based cost-effectiveness analysis comparing fingolimod to IFN beta-1a administered IM once weekly to treat RRMS in the US.
Methods
Decision model structure
We developed a Markov model to evaluate the cost-effectiveness of fingolimod 0.5 mg orally once daily compared to IFN beta-1a 30 mcg IM once weekly in patients with RRMS (). It was assumed that all patients also received basic supportive care regardless of the DMDs with which they were treated. Our base-case analysis consisted of a hypothetical cohort of 37 year-old RRMS patients who had a Kurtzke Expanded Disability Status Scale (EDSS) score of 0–2.5, and a recent history of relapseCitation5. Similar to previous MS models, we utilized a 1-month cycle length, assumed a 10-year time horizon, and conducted the analysis from a societal perspective (including direct and indirect costs and consequences and health utility)Citation6.
Figure 1. Schematic representation of the Markov model. All patients start at age 37 years-old with RRMS and an EDSS score of 0–2.5. Patients can progress through different EDSS health states based on assigned transition probabilities over 10 years or until death (from MS or other causes). The transition probabilities depend on the EDSS stage the patient is in, as well as their prescribed therapy. Each cycle is 30 days in length. Patients can remain in an EDSS stage for more than one cycle. Patients may only enter the temporary health state of relapse while in EDSS 0–2.5 or EDSS 3–5.5. Once patients enter EDSS 6–7.5 or higher, they are considered to have SPMS and their disease modifying drug is discontinued. All patients are assumed to receive basic supportive care. ‘M’ represents a Markov process. EDSS, Expanded Disability Status Scale; IFN, interferon; RRMS, relapse–remitting multiple sclerosis; SPMS, secondary-progressive multiple sclerosis; Tx, treatment.
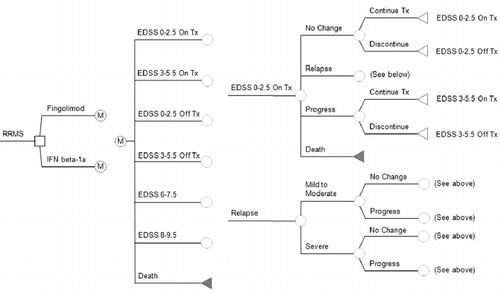
Permanent health states patients could transition through included: EDSS 0–2.5 on or off treatment (no or few limitations due to MS), EDSS 3–5.5 on or off treatment (mild-to-moderate mobility limitations due to MS), EDSS 6–7.5 off treatment (requires walking assistance due to MS), EDSS 8–9.5 off treatment (restricted to bed due to MS), and death. Patients could also transition to the temporary health state of relapse (treated either as an outpatient or as an inpatient based on the severity) from either EDSS 0–2.5 or EDSS 3–5.5, and remain there for a single cycle. However, once patients transitioned to an EDSS of 6–7.5 or higher, they were considered to have secondary-progressive multiple sclerosis (SPMS); an end-stage form of MS associated with fewer relapses and gradual destruction of neurons. Therefore, we assumed that patients with SPMS no longer suffered relapses, and their DMD was discontinued.
Outcomes evaluated included the total costs associated with MS in 2011 US dollars, quality-adjusted life-years (QALYs), number of relapses avoided, and incremental cost-effectiveness ratios (ICERs). Both costs and QALYs were discounted at a rate of 3% annuallyCitation6. The model was built and all analyses were performed in TreeAge Pro 2008 (TreeAge Software Inc., Williamstown, MA).
Transition probabilities
Disease progression rates from one EDSS disability level to another were obtained from the literature and were extrapolated to a 1-month cycle length ()Citation7–9. These rates were derived using epidemiologic data from natural history studies of MS patients who only received supportive careCitation10–13. The relative risk (RR) of disease progression for IFN beta-1a compared to placebo was obtained from other previously published clinical trialsCitation7,Citation14,Citation15. The RR of disease progression while on fingolimod compared to IFN beta-1a was calculated based on data from TRANSFORMSCitation5.
Table 1. Base-case model variables and ranges used in sensitivity analysis.
Patients with RRMS (those in EDSS 0–2.5 and EDSS 3–5.5) could experience a relapse based upon rates derived from natural history data ()Citation10–12. Once a patient experienced relapse, it was further defined as either mild–moderate (treated outpatient) or severe (treated as an inpatient with corticosteroids)Citation16–18. Following a relapse, patients could return to their prior EDSS state or progress to the next highest EDSS disability level under the assumption that their transition probabilities are the same as persons who have not experienced relapse. As with progression, the RR of relapse for IFN beta-1a compared to placebo was obtained from a previously published clinical trialCitation14, and the RR of relapse while on fingolimod compared to IFN beta-1a was calculated from annualized relapse rates (0.16 vs 0.33) from TRANSFORMSCitation5.
Fingolimod and IFN beta-1a discontinuation rates were reflective of those observed in TRANSFORMSCitation5. It was assumed that these rates would be constant during the first 2 years of treatment, and then would become zero, since any patient who would have stopped treatment due to adverse effects or lack of efficacy would likely have done so early on. The probability of death due to MS was only applied to patients in the EDSS 8–9.5 health state, meaning patients had to progress to severe disability before they could die as a direct result of MS. This assumption was based on available epidemiologic data that has found that as many as 89% of MS patients are non-ambulatory prior to deathCitation19. All cause death rates (independent of EDSS disability level) were taken from US Census Bureau life tablesCitation20.
Quality-of-life estimates
Utility estimates associated with each EDSS health state were obtained from survey studies performed in the US ()Citation8,Citation21,Citation22. The temporary disutility of having an episode of relapse, based on severity, was also included in our modelCitation21. Given that IFN beta-1a is administered intramuscularly and is known to have undesirable adverse effects such as injection site reactions and flu-like symptoms, we assumed there was a disutility associated with its use. The IFN beta-1a disutility was extrapolated from a published community study that used a standard-gamble approach to calculate utility scoresCitation21.
Costs
Costs included in our model included drug acquisition, direct costs (inpatient and outpatient care, relapse management, community services, informal care, medications used in symptom management), and indirect costs (lost worker productivity) associated with MS-related health states. We valued the cost of fingolimod and IFN beta-1a using their reported wholesale acquisition costs (WAC)Citation23. The baseline testing cost for fingolimod consisted of physician work-up and two electrocardiograms with reports and interpretation (CPT codes: 99215 and 93000)Citation24.
Direct costs were assigned to each EDSS disability level based on the findings of a survey of RRMS patients in the USCitation8,Citation25. The cost of relapse depended on the severity, with mild–moderate consisting of just one physician visit in the outpatient setting (CPT code 99214) and severe consisting of 5 days of complicated MS management in the inpatient setting. This inpatient cost consisted of a Diagnosis-Related Group (DRG) cost as well as the cost of three physician work-ups; admission, check-up, and discharge (CPT codes: 99217, 99228, and 99251, respectively)Citation24,Citation26. The indirect costs per EDSS state were taken from our own analysis of the North American Research Committee on Multiple Sclerosis (NARCOMS) databaseCitation27. When applicable, costs were inflated to 2011 US dollars using the Consumer Price Index (CPI) for Medical CareCitation28.
Sensitivity analysis
The uncertainty of the variables included in our model was assessed by performing sensitivity analyses. One-way sensitivity analysis was performed on all the variables included in across a priori determined plausible ranges. Additional one-way sensitivity analyses performed included altering the initial EDSS distribution of patients from the base-case assumption (100% starting in EDSS 0–2.5 to 71.2% in EDSS 0–2.5 and the remainder in EDSS 3.0–5.5) to better reflect the TRANSFORMS population (TRANSFORMS), changing the time horizon across a range of 1–40 years, assuming the discontinuation rates of both medications is 0% from the onset of the model, and assuming a US payor perspective.
Monte Carlo simulation (MCS) based on 10,000 iterations was also performed in which all variables were randomly and simultaneously varied across their plausible ranges. For each variable in the MCS, we assumed their plausible range followed a triangle distribution (defined by a likeliest, low and high value) since the true nature of variance for these variables is not well understood and the triangle distribution (when used appropriately) does not violate the requirements of any variable (i.e., costs cannot be less than $0 and probabilities and utilities must lie between 0 and 1).The results of MCS were used to generate a cost-effectiveness acceptability curve (CEAC).
Results
Base-case analysis
Compared to IFN beta-1a, fingolimod was associated with fewer relapses (0.41 vs 0.73 per patient per year) and more QALYs gained (6.7663 vs 5.9503). The mean total cost for fingolimod over this time was $565,598 per patient, while the total cost for IFN beta-1a was $505,234 per patient. The resulting ICER was $73,975 per QALY ().
Table 2. Base-case analysis results.
One-way sensitivity analysis
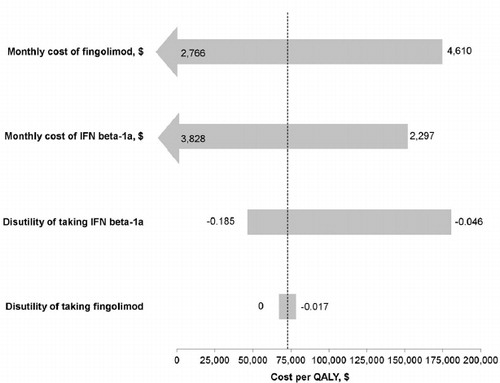
One-way sensitivity analysis found our base-case results to be sensitive to changes in the acquisition cost of both fingolimod and IFN beta-1a, as well as changes in the disutility of receiving IFN beta-1a (). When the monthly cost of fingolimod was on the lower end of its plausible range (<$3476), fingolimod became a cost-effective alternative to IFN beta-1a. Furthermore, when its cost was ≤$3006, fingolimod became a dominant strategy. Fingolimod was also found to be cost-effective when the monthly cost of IFN beta-1a was >$3300, and became the dominant alternative when INF beta-1a’s costs rose above $3790. When the annual disutility of receiving IFN beta-1a exceeded −0.172, fingolimod’s ICERs fell below $50,000 per QALY.
Figure 2. Tornado diagram of one-way sensitivity analysis. Each bar indicates the range of cost per additional QALY saved with fingolimod compared to IFN beta-1a as determined in one-way sensitivity analysis over a priori plausible ranges for each variable. The upper and lower limits of each value used in the sensitivity analysis are listed next to each bar. The dotted line represents the ICER determined from the base-case analysis ($73,975 per QALY). ICER, incremental cost-effectiveness ratio; IFN, interferon; QALY, quality-adjusted life year.
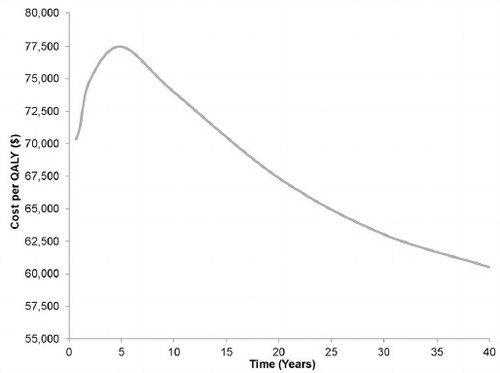
Upon altering our initial assumption to assume 28.8% of patients would start treatment with an EDSS score between 3 and 5.5 (which is more reflective of the TRANSFORMS study population than the base-case), the ICER increased to $78,478 per QALY. Varying the time horizon (1–40 years) had minimal impact on ICER estimates; with even the longest time horizon not being associated with a fingolimod ICER below $50,000 per QALY (ICER range: $71,146–$60,505 per QALY) (). The model was not sensitive to a change in the discontinuation rate of both drugs. If all discontinuation rates were assumed to be zero from the start of the simulation, fingolimod had an ICER of $454,687 per QALY. Finally, when indirect costs associated with each EDSS disability level were removed from the model to simulate the US payor perspective, the total cost per treatment per patient ($398,891 for fingolimod and $332,148 for IFN beta-1a) greatly decreased, but the ICER remained relatively stable ($81,794 per QALY).
Figure 3. Effect of time horizon on the incremental cost-effectiveness ratio. This diagram portrays the varying effect of time horizon on the incremental cost-effectiveness of fingolimod. QALY, quality-adjusted life year.
MCS
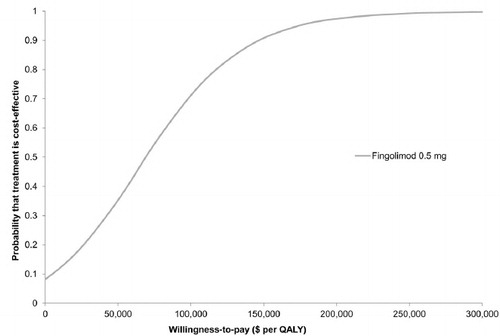
The results of our MCS based on 10,000 iterations are depicted as a cost-effectiveness acceptability curve (CEAC) in . Fingolimod was cost-effective in 35% and 70% of the simulations using WTP thresholds of $50,000 and $100,000 per QALY, respectively.
Figure 4. Results of Monte Carlo simulation. Cost-effectiveness acceptability curve based on 10,000 iterations, which drew parameters for each input simultaneously from probability distributions. Fingolimod was found to be cost-effective compared to IFN beta-1a in 35% and 70% of the simulations at willingness-to-pay thresholds of $50,000 and $100,000 per QALY, respectively. IFN, interferon; QALY, quality-adjusted life year.
Discussion
Over the 10-year time horizon, fingolimod was associated with fewer relapses (4.1 vs 7.3 per patient); driven by the 52% reduction in relapses observed in the pivotal phase III trial TRANSFORMS, and more QALYs gained (6.8465 vs 5.9503). However, fingolimod was also projected to be the more costly treatment strategy with a total incremental cost of $60,364. Our ICER estimate exceeded the commonly used WTP threshold of $50,000 per QALY, at a value of $73,975 per QALY. MCS showed that fingolimod was only cost-effective in 35% of the iterations using a WTP threshold of $50,000 per QALY. When the threshold was extended to $100,000 per QALY, 70% of the iterations found fingolimod to be cost-effective.
Our findings were sensitive to changes in drug cost and IFN beta-1a disutility. Although the cost of fingolimod is high, the costs of other DMDs have risen dramatically in the recent past. Of particular note, the WAC for IM IFN beta-1a increased by more than 20% in 2010Citation29. In our model, as the difference in cost between fingolimod and IFN beta-1a decreased, fingolimod became more cost-effective. It is important to note that if IFN costs continue to rise, fingolimod may become a cost-effective alternative. Fingolimod has the advantage of more convenient administration via the oral route and is not associated with flu-like symptoms. Therefore, we assigned a relative disutility related to taking IFN beta-1a instead of fingolimod of 0.103. To our knowledge, no analysis to estimate patients’ utility preference for taking fingolimod has been undertaken to date. Thus, our assumption that fingolimod is associated with less disutility than IFN beta-1a is purely speculative.
Our Markov model is not the first to compare IM IFN beta-1a to fingolimod in the treatment of RRMS. The Evidence Review Group (ERG) conducted a Markov model on behalf of the National Institute for Health and Clinical Excellence (NICE) from a UK National Health Service (NHS) perspectiveCitation30. Their model did not include indirect costs associated with MS, and they came to a higher ICER estimate for fingolimod vs IM IFN beta-1a than ours (∼$111,227 per QALY gained). In addition, fingolimod’s manufacturer (Novartis) also conducted an economic model for NICE which produced an ICER of ∼$88,619 per QALYCitation31. Novartis performed their base-case analysis over a 50-year time horizon, even though MS models typically utilize shorter time horizons. Moreover, this model also did not include indirect costs. We feel the inclusion of indirect costs into a MS model is of great importance since cost-of-illness studies have consistently shown costs of lost productivity to be the single largest cost associated with MSCitation22,Citation32. To include indirect costs into our model, we conducted our own analysis of the NARCOMS database, the largest database of US patients with MS. This allowed us to derive highly US externally valid estimates of indirect costs stratified by EDSS health state. Also of note, because the above-mentioned models were from a UK perspective, both were based on UK epidemiologic and cost data. Finally, to date, neither has been published in a peer-reviewed medical journal.
It should be noted there is no one uniformly accepted WTP threshold for determining the cost-effectiveness of a drug or intervention in an economic analysis. The arbitrary figure of $50,000 per QALY gained has been the most cited in published economic analyses (52% of analyses published between 1998 and 2003), but $100,000 per QALY has been used as well (11%)Citation33. Consequently, the use of a lower threshold could alter how our results are interpreted. Because there is disagreement as to what acceptable WTP threshold should be, some have proposed calculating ICERs based upon disease-specific clinical end-pointsCitation34. Based on this recommendation, we investigated the cost per relapses avoided in our model, in addition to the commonly reported cost per QALY. Compared to IM IFN beta-1, fingolimod prevented 3.2 more relapses per patient over the 10-year time horizon (ICER = $18,744 per relapse avoided). By reporting how much more it would cost society to prevent one relapse in a MS patient by using fingolimod instead of IFN beta-1a, we hope that clinicians may be able to better interpret and apply our findings to their practice.
An important limitation of our analysis comes from the fact that we compared only one DMD, IM IFN beta-1a, to fingolimod. One reason we did so is because IM IFN beta-1a was the only comparator to fingolimod evaluated in TRANSFORMS. It is also important to note that IM IFN beta-1a had the largest market share for IFNs in the US ($303,147,918) in 2010Citation3Citation5. Moreover, to include other first-line recommended agents in the model would have required less reliable, indirect assumptions about their comparative efficacy and safety to fingolimod. Even with IFNs, such indirect assumptions may be problematic because there may be important differences in the efficacy and safety across these agents in the treatment of MS. For example, IFN beta-1b has been found to be superior to IFN beta-1a in preventing disease progression (relative risk of 0.48) based on pooled data in a systematic review of four head-to-head trialsCitation36. Finally, a decision analytic model has been published that evaluated the cost-effectiveness of fingolimod compared to natalizumabCitation37. O’Day et al.Citation37 concluded that natalizumab was dominant (more effective and less costly) than fingolimod using indirect comparison over a 2-year time horizon. However, clinically, natalizumab is reserved for RRMS patients who have failed other therapies due to the risk of developing progressive multifocal leukoencephalopathy (PML)Citation38.
Some additional limitations should be considered when interpreting our results. First, our analysis was primarily based upon data from the randomized clinical trial TRANSFORMS, which only followed patients for 1 year. It is possible that annualized relapse rates or disease progression may vary with longer treatment duration. Second, randomized controlled trial participants and data do not always accurately reflect real-life efficacy and safety; since participants may exhibit superior medication adherence and receive more comprehensive follow-up. Third, RR of disease progression on fingolimod was derived from a single trial TRANSFORMS (as it is the only trial available providing such data), while the RR of disease progression on INF beta-1a was taken from multiple trials. Additionally, we assumed that the discontinuation rates would remain constant for 2 years and then drop off to zero.
Conclusions
In conclusion, the results of our analysis suggest that despite fingolimod’s superior efficacy in preventing relapses and the disutility associated with taking IFN beta-1a, fingolimod is not cost-effective at a WTP threshold of $50,000 per QALY. However, fingolimod may become cost-effective if its acquisition cost falls below $3515 per month, the cost of IFNs continue to rise, the relative disutility of taking one agent over the other is found to be wider than we estimated, or decision-makers are willing to accept a moderately higher WTP threshold. Further studies measuring the risk and benefits of fingolimod over a longer period of time may allow for better estimates of its cost-effectiveness. Healthcare decision-makers may find additional decision analyses comparing fingolimod to other pertinent DMD treatments useful.
Transparency
Declaration of funding
This study was not funded.
Declaration of financial/other relationships
Dr Coleman has no relevant financial relationships to disclose regarding this paper. However, he has disclosed that he has received past research funding from the Agency for Healthcare Research and Quality (AHRQ), Acorda Therapeutics, and Janssen Pharmaceuticals Inc. The other authors have no relevant financial relationships to disclose.
Author contributions
Drs Lee and Coleman had full access to all of the data in the study and take responsibility for the integrity of the data and the accuracy of the data analysis. Study concept and design: Lee, Roberts, Coleman. Acquisition of data: Lee, Baxter, Limone, Roberts, Coleman. Analysis and interpretation of data: Lee, Baxter, Limone, Coleman. Drafting of the manuscript: Lee, Baxter, Coleman. Critical revision of the manuscript for important intellectual content: Lee, Baxter, Coleman. Statistical analysis: Lee, Baxter, Roberts, Coleman. Administrative, technical, or material support: Lee, Baxter, Roberts, Limone, Coleman. Study supervision: Lee, Coleman.
References
- National Institute of Neurological Disorders and Stroke. How many people have MS? 2012; http://www.ninds.nih.gov/disorders/multiple_sclerosis/detail_multiple_sclerosis.htm#193373215. Accessed February 17, 2012
- Whetten-Goldstein K, Sloan FA, Goldstein LB, et al. A comprehensive assessment of the cost of multiple sclerosis in the United States. Mult Scler 1998;4:419-25
- Goodin DS, Frohman EM, Garmany GP Jr., et al. Disease modifying therapies in multiple sclerosis: report of the therapeutics and technology assessment subcommittee of the American academy of neurology and the MS council for clinical practice guidelines. Neurology 2002;58:169-78
- Munschauer FE, Kinkel RP. Managing side effects of interferon beta in patients with relapsing–remitting multiple sclerosis. Clin Ther 1997;19:883-93
- Cohen JA, Barkhof F, Comi G, et al. Oral fingolimod or intramuscular interferon for relapsing multiple sclerosis. N Engl J Med 2010;362:402-15
- Gold MR, Siegel JE, Russell LB, et al. Cost-effectiveness in health and medicine. New York: Oxford University Press, 1996
- Prosser LA, Kuntz KM, Bar-Or A, et al. Cost-effectiveness of interferon beta-la, interferon beta-lb, and glatiramer acetate in newly diagnosed non-primary progressive multiple sclerosis. Value Health 2004;7:554-68
- Bell C, Graham J, Earnshaw S, et al. Cost-effectiveness off our immunomodulatory therapies for relapsing-remitting multiple sclerosis: a Markov model based on long-term clinical data. J Manag Care Pharm 2007;13:245-61
- Earnshaw SR, Graham J, Oleen-Burkey M, et al. Cost effectiveness of glatiramer acetate and natalizumab in relapsing–remitting multiple sclerosis. Appl Health Econ Health Policy 2009;7:91-108
- Weinshenker BG, Ebers GC. The natural history of multiple sclerosis. Can J Neurol Sci 1987;14:255-61
- Weinshenker BG, Bass B, Rice GP, et al. The natural history of multiple sclerosis: a geographically based study. 2. Predictive value of the early clinical course. Brain 1989;112:1419-28
- Goodkin DE, Hertsgaard D, Rudick RA. Exacerbation rates and adherence to disease type in a prospectively followed-up population with multiple sclerosis. Implications for clinical trials. Arch Neurol 1989;46:1107-12
- Runmarker B, Andersen O. Prognostic factors in a multiple sclerosis incidence cohort with twenty-five years of follow-up. Brain 1993;116:117-34
- Jacobs LD, Cookfair DL, Rudick RA, et al. Intramuscular interferon beta-1a for disease progression in relapsing multiple sclerosis. The Multiple Sclerosis Collaborative Research Group (MSCRG). Ann Neurol 1996;39:285-94
- Rudick RA, Goodkin DE, Jacobs LD, et al. Impact of interferon beta-1a on neurologic disability in relapsing multiple sclerosis. Neurology 1997;49:358-63
- Interferon beta-1b is effective in relapsing-remitting multiple sclerosis. I. Clinical results of a multicenter, randomized, double-blind, placebo-controlled trial. The IFNB Multiple Sclerosis Study Group. Neurology 1993;43:655-61
- Fay AJ, Mowry EM, Strober J, et al. Relapse severity and recovery in early pediatric multiple sclerosis. Mult Scler Epub ahead of print 19 Dec 2011
- Naldi P, Collimedaglia L, Vecchio D, et al. Predictors of attack severity and duration in multiple sclerosis: a prospective study. Open Neurol J 2011;5:75-82
- Phadke JG. Survival pattern and cause of death in patients with multiple sclerosis: results from an epidemiological survey in northeast Scotland. J Neurol Neurosurg Psychiatry 1998;50:523-31
- United States Census Bureau. The 2012 Statistical Abstract [online]. 2012; http://www.census.gov/compendia/statab/cats/births_deaths_marriages_divorces.html. Accessed January 22, 2012
- Prosser LA, Kuntz KM, Bar-Or A, et al. Patient and community preferences for treatments and health states in multiple sclerosis. Mult Scler 2003;9:311-9
- Kobelt G, Berg J, Atherly D, et al. Costs and quality of life in multiple sclerosis: a cross sectional study in the United States. Neurology 2006;66:1696-702
- Medicaid Totals Q3 2011. Microsoft Office Excel 2003 [Computer Software], Microsoft Corporation. 2011; http://ahca.myflorida.com/medicaid/Prescribed_Drug/xls/111025_2011Q3_totals_Rpt.xls. Accessed February 17, 2012
- American Medical Association. CPT Code/Relative Value Search. AMA Coding [online]. https://catalog.ama-assn.org/Catalog/cpt/cpt_search.jsp?_requestid=78299. Accessed January 22, 2012
- Oleen-Burkey M, Kobelt G, Borgstrom F. Costs and quality of life of patients with relapsing-remitting multiple sclerosis currently on immunomodulatory therapy in the United States. International Committee on Databases in Multiple Sclerosis, 2003; Abstract Hackensack, New Jersey, USA
- Schmidt K, Stegman M. DRG expert: a comprehensive guidebook to the DRG classification system. 26th ed. Ingenix, 2010; Salt Lake City, Utah, USA
- Coleman CI, Roberts MS, Sidovar M. Mobility, indirect costs, and health-related quality of life in multiple sclerosis. Value Health 2012; Abstract. [In Press]
- Bureau of Labor Statistics. Consumer Price Index. United States Department of Labor [online]. http://www.bls.gov/cpi/. Accessed February 17, 2011
- AARP Public Policy Institute. Rx watchdog report: brand name drug prices continue to climb despite low general inflation rate 2010; [online]. http://assets.aarp.org/rgcenter/ppi/health-care/i43-watchdog.pdf. Accessed February 21, 2011
- CRD and CHE Technology Assessment Group. Fingolimod for the treatment of relapsing remitting multiple sclerosis. Centre for Reviews and Dissemination/Centre for Health Economics, 2011; York, UK
- National Institute for Health and Clinical Excellence (NICE). Fingolimod for the treatment of relapsing-remitting multiple sclerosis in adults. 2011; http://www.nice.org.uk/nicemedia/live/12170/55812/55812.pdf. Accessed February 17, 2011
- Whetten-Goldstein K, Sloan F, Goldstein L, et al. A comprehensive assessment of the cost of multiple sclerosis in the United States. Mult Scler 1998;4:419-25
- Greenberg D, Winkelmayer WC, Neumann PJ. Prevailing judgments about society's willingness to pay for a QALY: do they vary by country? Have they changed over time? Value Health 2006;9:A-60. Abstract
- Smyth KA. Cost-effectiveness analyses of treatments for multiple sclerosis: are they clinically relevant? Neurology 2011;77:317-8
- Drug Topics Staff. 2010 Top 200 branded drugs by retail dollars. Drug Topics 2011 [online]. http://drugtopics.modernmedicine.com/drugtopics/data/articlestandard//drugtopics/252011/727252/article.pdf. Accessed February 17, 2011
- Smith B, Carson S, Fu R, et al. Drug class review: disease-modifying drugs for multiple sclerosis. Final Update 1 Report. Oregon Health and Science University, 2010; Portland, Oregon, USA. http://derp.ohsu.edu/about/final-products.cfm. Accessed February 29, 2012
- O'Day K, Meyer K, Miller RM, et al. Cost-effectiveness of natalizumab versus fingolimod for the treatment of relapsing multiple sclerosis. J Med Econ 2011;14:617-27
- Goodin DS, Cohen BA, O'Connor P, et al. Assessment: the use of natalizumab (Tysabri) for the treatment of multiple sclerosis (an evidence-based review): report of the therapeutics and technology assessment subcommittee of the American academy of neurology. Neurology 2008;71:766-73