Abstract
Objective:
There is limited information regarding the cost-effectiveness of sevelamer for the treatment of hyperphosphatemia in chronic kidney disease (CKD) patients on dialysis in the UK. Using a UK National Health Service (NHS) perspective and final results of the Dialysis Clinical Outcomes Revisited (DCOR) study, an evaluation was performed to determine the cost-effectiveness of sevelamer compared to calcium-based phosphate binders for the first-line treatment of hyperphosphatemia in CKD patients on dialysis.
Methods:
A Markov model was developed to estimate life years, quality-adjusted life years (QALYs), costs, incremental cost per life year (LY) gained, and QALY gained. Treatment-specific overall survival up to 44 months, hospitalizations, and resource utilization were derived from the DCOR study. Survival was extrapolated to a lifetime horizon using Weibull regression analysis. Unit costs and utility estimates specific to the UK were obtained from the published literature. Sub-group analyses were conducted based on data reported from the DCOR study for increasing age cut-points. Outcomes and costs were modeled for a lifetime horizon.
Results:
In the base case analysis, the use of sevelamer resulted in a gain of ∼0.73 LYs and 0.44 QALYs per patient (discounted at 3.5% per year). Total per-patient costs were higher for sevelamer, resulting in an incremental cost of £22,157 per QALY gained and £13,427 per LY gained (in £2009). Increasingly favorable cost per QALY ratios were observed with increasing age cut-points, ranging from £15,864 for patients ≥45 to £13,296 for patients ≥65 years of age. Results were most sensitive to assumptions regarding overall survival and the inclusion of dialysis costs. Key limitations of the analysis included the use of non-UK trial data for survival and hospitalizations, and the exclusion of quality-of-life impacts associated with hospitalization.
Conclusions:
In CKD patients receiving dialysis, treatment of hyperphosphatemia with sevelamer offers good value for money compared with calcium-based binders.
Introduction
Hyperphosphatemia is a serious consequence of renal insufficiency that significantly contributes to increased morbidity and mortality, particularly in chronic kidney disease (CKD) patients on dialysis. Elevated serum phosphate leads to vascular calcification, cardiovascular disease (CVD), and further renal damageCitation1–6. Published studies indicate an increased risk of morbidity and mortality at serum phosphate levels ranging from >3.5 mg/dL Citation5 to >6.5 mg/dL Citation7, with the greatest risks observed at levels >7.0 mg/dL Citation2.
International and UK guidelinesCitation8,Citation9 recommend maintaining serum phosphate within the normal range of 2.5–4.6 mg/dL through the use of diet control and phosphate binders. According to data from the international Dialysis Outcomes and Practice Patterns Study (DOPPS), over 75% of patients on dialysis in the UK receive treatment with phosphate bindersCitation2,Citation10. Calcium-based binders (CBBs) are the most commonly used phosphate binder in the UK. However, these agents are associated with an increased incidence of hypercalcemia and accelerated progression of vascular calcificationCitation11–17.
Sevelamer hydrochloride and sevelamer carbonate are non-calcium, non-accumulating, and non-metal based binders which have been shown to be effective at controlling serum phosphateCitation14,Citation18. Trials have demonstrated significantly lower levels of serum calcium and arterial calcification with sevelamer compared to CBBsCitation11,Citation13,Citation14.
The impact of phosphate binder choice on overall survival was examined in the Dialysis Clinical Outcomes Revisited (DCOR) study, a multi-center, randomized, open-label trial comparing sevelamer vs CBBs (calcium carbonate and calcium acetate)Citation19,Citation20. The study found a non-significant difference favoring sevelamer with respect to all-cause mortality (hazard ratio [HR]: 0.93; 95% confidence interval (CI): 0.79–1.10; log rank p = 0.40). In a pre-specified sub-group analysis of patients 65 years and older (44% of the DCOR study population), sevelamer was associated with significantly lower all-cause mortality compared with CBBs (HR: 0.77; 95% CI: 0.61–0.96; log rank p = 0.02). This statistically significant difference was maintained in post-hoc analyses using lower age cut-pointsCitation20. In addition, in an analysis of all patients with a follow-up ≥2 years, the difference in survival was also statistically significantCitation19. These findings were supported by the Renagel in New to Dialysis (RIND) study, a randomized open label study of 127 incident hemodialysis patients in which mortality was found to be significantly higher in patients treated with CBBs compared to sevelamerCitation21, and by a national retrospective cohort study in which incident dialysis patients who received sevelamer had significantly better survival compared to patients who received calcium carbonate (HR: 0.62; 95% CI: 0.50–0.76)Citation22.
Despite the potential benefits in terms of calcification and overall survival, sevelamer is not widely used as a first-line treatment in the UK, primarily due to concerns over higher acquisition costs. Whether sevelamer offers good value for its additional cost has been addressed within several published cost-effectiveness analyses. One such study conducted by Taylor et al.Citation23 used a Markov model to analyze patient outcomes over a 5-year time horizon and determine incremental cost-effective ratios (ICERs) for sevelamer relative to calcium carbonate and calcium acetate phosphate binders. This study addressed the UK population; however, it utilized data from a smaller study of patients new to dialysisCitation21. A Canadian study examined the cost-effectiveness of sevelamer in prevalent dialysis patientsCitation24. However, data from a variety of alternative sources were utilized to inform baseline patient population characteristics, phosphate binder dosages, risk of transplant, risk of hospitalization, and risk of death for patients treated with CBBs, while the relative risk (RR) of hospitalization and death for sevelamer was derived from preliminary results of the DCOR study. Two additional analyses assessing the cost-effectiveness of sevelamer in Canada have been published; one in prevalent hemodialysis patients and one for incident hemodialysis patients. However, these analyses relied on regression equations developed from a clinical trial to translate changes in calcification score to long-term outcomes such as cardiovascular disease riskCitation25,Citation26. The current study, from a UK payer perspective, provides the first cost-effectiveness analysis of sevelamer compared to CBBs in first-line treatment of hyperphosphatemia in prevalent dialysis patients based on published DCOR data.
Methods
A decision analytic model was designed using Microsoft Excel in order to quantify the clinical and economic impact of treating hyperphosphatemia with sevelamer compared with CBBs in a hypothetical cohort of CKD patients who had been receiving dialysis for an average of 38.2 months. The evaluation’s outcome measure was the incremental cost per quality-adjusted life year (QALY) gained for sevelamer vs CBBs. QALY is a composite measure that combines the length of a patient’s life with the quality-of-life the patient experiences, where quality-of-life is measured on a 0–1 utility scale, with a utility score of 1 representing perfect health. Incremental cost per life year gained was also provided.
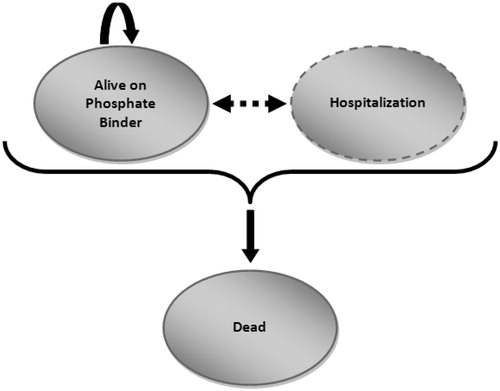
The model uses health state transitions (e.g. Markov processes) to simulate disease outcomes and estimate the corresponding quality-of-life, resource use, and costs. shows the health states and transitions in the model. All patients started the model in the ‘alive on phosphate binder’ state, where patients in the sevelamer arm of the model received on-going treatment with sevelamer and patients in the calcium arm of the model received on-going treatment with CBBs. At the end of each model cycle of 1 month patients either remained in the ‘alive on phosphate binder’ state or transitioned to ‘dead’. Monthly transitions to death were informed directly by treatment-specific overall survival (OS) curves from the DCOR study. During each model cycle, all patients in the ‘alive on phosphate binder’ state were also at risk of hospitalization, to which cost consequences were assigned.
Figure 1. Model health states and transitions.
Base case model inputs, assumptions, and sources are provided in . Sensitivity analyses were conducted to evaluate the impact of uncertainty in model assumptions and parameters on the results.
Table 1. Summary of base case analysis inputs, assumptions, and data sources.
A lifetime horizon was adopted for the base case analysis. The analysis was conducted from the perspective of the publicly-funded healthcare system in the UK, the National Health Service (NHS).
Patient population
The patient cohort for the analysis reflected patients enrolled in the DCOR study. Two thousand, one hundred and three (2103) hemodialysis patients were enrolled at 75 dialysis centers across the US. A comparable data source was not available for a UK-specific population, therefore it was assumed that data from DCOR was generalizable to the UK. As per the study inclusion criteria, patients over 18 years of age receiving dialysis for at least 3 months and in need of phosphate binder therapy were consideredCitation19. Overall, the sevelamer and CBB treatment groups were well balanced with respect to baseline demographics and renal history.
Treatment comparators
CBBs and sevelamer are the most commonly prescribed binders in the UK, accounting for ∼90% of all phosphate binder use in CKD patients receiving dialysisCitation10. CBBs also constitute the only binders that have been compared with sevelamer in long-term head-to-head clinical trials capturing hard clinical outcomes. The CBB group in the DCOR study was comprised of 70% of patients receiving calcium acetate and 30% receiving calcium carbonate.
Health state transitions
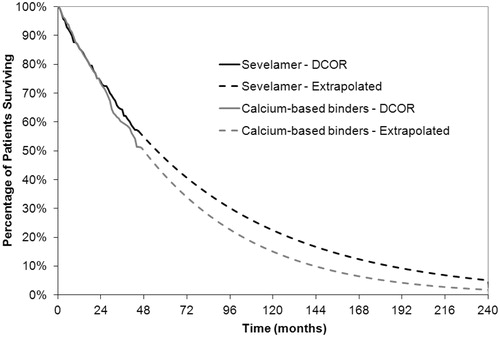
Monthly transitions from ‘alive on phosphate binder’ to ‘dead’ in the model were directly informed by the treatment-specific Kaplan-Meier curves reported in the DCOR study, which provided data for CBBs and sevelamer for up to 44 monthsCitation19. Survival rates for CBBs reflect the combined survival for patients receiving either calcium acetate or calcium carbonate. Regression analysis was used to fit curves to the published data and extrapolate survival to a lifetime horizon. A Weibull regression model was selected for the final model for several reasons; (1) the Weibull model showed the best fit to the within-trial data, as measured by R-square values of 99.7% (r2 = 0.997) and 99.6% (r2 = 0.996) for the sevelamer and CBB curves, respectively, (2) survival data are known to best follow a Weibull distribution, and (3) the Weibull regression line predicting the survival of the CBB patients closely resembled that of the average ESRD population in the UKCitation27. The extrapolated Kaplan-Meier curves used to inform the monthly transition probabilities in the model are provided in .
Figure 2. Overall survival of patients in the DCOR study (up to 44 months), extrapolated using Weibull regression analysis, shown to 20 years. CBBs, Calcium-based binders.
Hospitalizations
All-cause hospitalizations for the sevelamer and CBB treatment groups were also taken directly from the DCOR study. The mean hospital days/patient-year reported in DCOR was 17.4 for CBB patients and 14.8 for sevelamer-treated patients, resulting in a 15% risk reduction in mean hospital days/patient-year for sevelamer compared to CBBs. Mean hospital days/year were converted to monthly estimates of 1.45 and 1.23 hospital days per patient for CBBs and sevelamer, respectively. All patients in the ‘alive’ health state were assumed to be hospitalized for a mean of 1.45 days per month for patients receiving CBBs and 1.23 days per month for patients receiving sevelamer. The reduction in hospitalizations for sevelamer was applied for the duration of the analysis time horizon.
Costs
Costs included in the model reflect healthcare costs incurred by the NHS for treating hyperphosphatemia, including drug and hospitalization costs. Costs were estimated by combining resource utilization reported in the DCOR study and unit costs from published UK sourcesCitation28,Citation29. Costs were inflated to 2009 values using the most recent UK consumer price index (CPI) and are reported in British pounds (£).
The average daily doses of CBBs and sevelamer were taken from the DCOR study. Of the DCOR subjects randomized to CBBs, 70% received calcium acetate and 30% received calcium carbonate. The mean prescribed daily dose at study completion was 5.3 g for calcium acetate, 4.9 g for calcium carbonate, and 6.9 g for sevelamer. The acquisition cost of calcium acetate (£0.11 per gram) and calcium carbonate (£0.0483 per gram) were derived from the 2009 BNFCitation28. The total annual CBB cost per patient assumed in the analysis was £174.84, representing the average cost of each form of calcium used in the DCOR study, weighted by the proportion of its use. The acquisition cost of sevelamer was assumed to be £0.8191 per gram, based on the 2009 manufacturer’s price for sevalemer hydrochloride (Renagel). The total annual sevelamer cost per patient was £2062.90. Costs were determined assuming 100% adherence to prescribe daily dose.
A unit cost per hospital day was calculated from NHS 2007–2008 data by taking the weighted average unit cost from all elective and non-elective hospitalizations for patients with one of the following healthcare resource group (HRG) codes; LA08A through LA08D (chronic renal failure), EB01Z (non-interventional acquired cardiac conditions 19 years and over), EB05Z (cardiac arrest) and EB10Z (actual or suspected myocardial infarction)Citation29. HRGs related to vascular disease were excluded. summarizes the data and calculations used in the determination of the weighted average cost per hospitalized day. The weighted average cost (£334.18) was inflated to 2009 to arrive at a final base case cost of £359.15. The upper and lower 95% CIs for the weighted average cost (£582.18 and £136.12, respectively) were used in sensitivity analyses.
Table 2. Base case cost of a hospitalized day.
Dialysis costs were excluded from the base case analysis.
Health outcomes
A recent systematic review of the published literature for utility measures associated with CKD was used to derive a utility score representative of patients in the DCOR studyCitation30. Dale et al.Citation30 performed a structured literature assessment of utility associated with various health states in CKD to determine the most appropriate values for use in economic models evaluating renal treatments in the UK. Only those studies for which Dale et al.Citation30 reported a quality score of at least 4, and presented utility values for CKD patients on hemodialysis, were considered for inclusion in our analysisCitation31–35. summarizes the utility studies used to derive the weighted average base case utility value. For the base case analysis, we calculated a weighted average utility of 0.61 for CKD patients on dialysis derived from these five studies.
Table 3. Summary of the utility studies used to determine the weighted average base case utility value for patients with ESRD receiving dialysis.
Since data regarding the disutility associated with ESRD-related hospitalizations was not available from the published literature, this outcome was not included in the analysis. The impact of excluding this outcome was assumed to be minimal, as any health utility losses associated with short-term hospitalizations would likely be small and temporary. Excluding this outcome biases the analysis against sevelamer, given that patients receiving sevelamer spend fewer days in hospital.
Discounting
Health outcomes and costs were discounted at 3.5% per year in accordance with UK guidelinesCitation36.
Results
Base case analysis
Analysis results are summarized in . Approximately 57% of sevelamer and 51% of CBB patients remained alive at 44 months. Based on the extrapolated survival, 22% of sevelamer and 15% of CBB patients remained alive at 10 years and 5% of sevelamer and 2% of CBB patients remained alive at 20 years. Based on a 20-year time horizon, the resulting number needed to treat (NNT) with sevelamer to avoid one death was 33 patients (e.g., 1/[5% − 2%]).
Table 4. Discounted base case cost-effectiveness results for sevelamer compared with calcium-based binders, considering a lifetime horizon.
In the base case analysis, treatment with sevelamer resulted in a gain of ∼0.7332 life years (LYs) and 0.4443 QALYs per patient compared with CBBs. The total lifetime cost per patient treated with sevelamer was £39,701, of which £11,100 (39%) was attributable to drug costs and £28,601 (61%) to hospitalizations. For the CBB group, the total cost was £29,856, of which £812 (3%) was attributable to drug costs and £29,044 (97%) to hospitalizations. Total aggregate costs were higher for sevelamer, resulting in an incremental cost of £9845 per patient over a lifetime. The resulting incremental cost per QALY gained was £22,157 and the incremental cost per LY gained was £13,427.
Sensitivity analysis
One-way sensitivity analyses were conducted to evaluate the impact of uncertainty in model assumptions and parameters, including the time horizon, overall survival, number of hospitalization days in the CBB group, RR in hospitalization days for the sevelamer group, discount rate, utility, cost of drug, and cost of hospitalization (). In order to highlight the impact of including dialysis costs on the cost-effectiveness of sevelamer, we also conducted a sensitivity analysis that included the cost of dialysis.
Figure 3. Tornado diagram displaying results of one-way sensitivity analyses. Results are presented as incremental costs per QALY gained (£) for sevelamer vs calcium-based binders.
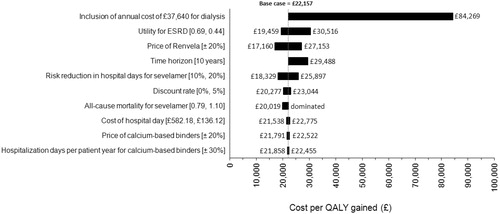
The model’s results were most affected by assumptions regarding overall survival and the inclusion of dialysis costs. When the lower 95% confidence interval (CI) on the HR for mortality for sevelamer vs CBBs (0.79) was used to predict overall survival for sevelamer, the incremental cost per QALY gained decreased to £20,019. When the upper 95% CI on the HR for mortality (1.10) was used, sevelamer was dominated by CBBs (e.g., sevelamer was less effective and more costly). This was expected, as the difference in overall survival between sevelamer and CBBS in the DCOR study did not reach statistical significance. Explanations for this have been discussed elsewhereCitation19,Citation20, but relate primarily to a lack of statistical power to detect a significant difference in survival in the overall study population. Independent sub-group analyses conducted on patients ≥65 years of age and on patients who were followed for at least 2 years showed a statistically significant difference in overall survivalCitation19,Citation20. When the annual cost of dialysis was incorporated in the analysis, the incremental cost per QALY gained increased substantially to £84,269. When the time horizon was limited to 10 years, the incremental cost per QALY gained increased to £29,488.
Sub-group analysis
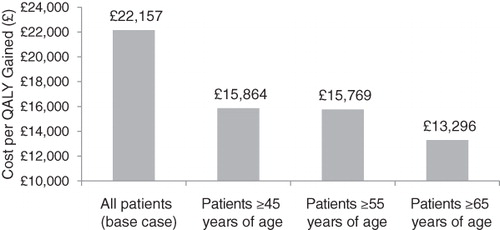
Because of the interactions between patient age and clinical benefit for sevelamer observed in the DCOR trial, the cost-effectiveness of sevelamer was also determined for four sub-groups of patients based on different age cut-points. Data were utilized from the pre-specified sub-group analysis in DCOR for patients 65 years of age and olderCitation19, as well as from post-hoc sub-group analyses for patients aged 45, 50, and 55 years and olderCitation20.
In the sub-group analyses, incremental cost-effectiveness ratios (ICERs) were found to improve with increasing age cut-off points, decreasing from £15,864 for patients 45 years of age and older to £13,296 for those 65 years of age and older ().
Figure 4. Incremental cost-effectiveness ratios for age sub-group populations of DCOR, including patients aged ≥45, ≥50, ≥55, and ≥65 years.
Discussion
We present an economic evaluation that offers evidence that in patients on dialysis in the UK, treatment of hyperphosphatemia with sevelamer provides good value for money compared with CBBs, from the perspective of the NHS.
The current study represents the first cost-effectiveness analysis that uses final results of the DCOR study to compare sevelamer to CBBs for the first-line treatment of hyperphosphatemia in CKD patients on dialysis. While a Canadian CEA referencing preliminary findings of the DCOR study was published in 2007, Manns et al.Citation24 applied a RR of death and hospitalization associated with sevelamer treatment from DCOR to Canadian population data. In contrast to the present analysis, Manns et al.Citation24 concluded that sevelamer, relative to CBBs, was not cost-effective with an incremental cost per QALY gained estimated to be $CAN 157,700. The findings of the present analysis differ from those reported by Manns et al.Citation24, due primarily to opposing approaches regarding the inclusion of dialysis costs. While Manns et al.Citation24 chose to include the cost of dialysis in their base case analysis, we argue that dialysis costs should not be included in cost-effectiveness analyses of therapies that extend the lives of patients with ESRD, but do not reduce the need for or the frequency of dialysis.
CKD patients on dialysis in the UK require over £37,000 in healthcare costs for dialysis during each year of lifeCitation37. This implies that for any therapy, such as a phosphate binder, statin therapy or insulin, that extends the life of a CKD patient on dialysis, without reducing the extent or need for dialysis, the healthcare system will incur a cost of over £37,000 per year of life gained, in addition to the cost of the therapy which extended the patient’s life. With respect to cost-effectiveness, even if the life extending therapy were free, the cost per life year gained for the therapy will be at least as great as the cost of dialysis (£37,000 per life year gained). As noted by Manns et al.Citation24, ‘interventions for dialysis patients that improve survival without reducing the need for dialysis, will be associated with a cost-utility ratio at least as great as that of dialysis itself’ (p. 2870). As such, if dialysis is not cost-effective, then the therapy being used to improve survival in CKD patients on dialysis cannot be cost-effective.
It stands to reason that if no therapy that extends life in CKD patients on dialysis can be cost-effective, and cost-effectiveness criteria are used to make reimbursement decisions, then no life extending therapy for these patients would be reimbursed. Of course, cost-effectiveness is not the only criteria for adoption of a new therapy, but it can be the sole reason for lack of reimbursement. The risk is that CKD patients requiring dialysis could be denied access to any current or future therapy that would extend their life, simply because those additional years of life on dialysis are costly. As such, we argue that it is unreasonable to include the cost of dialysis in cost-effectiveness analyses of therapies that extend the lives of ESRD patients but do not impact the need for or the frequency of dialysis.
Our findings also differ from those reported by Taylor et al.Citation23 in their UK CEA of sevelamer vs CBBs using data from the RIND. The authors reported a cost-effectiveness ratio of £27,120 in their base case analysis; over 2-times that of our own analysis. The primary reason for the observed differences in the ICERS was that Taylor et al.Citation23 applied the risk reduction in hospitalizations for sevelamer patients for only the first 18 months of the analysis. As noted above, the model is sensitive to alternative assumptions regarding the risk reduction in hospitalizations. We assumed that the risk reduction in hospitalization for sevelamer lasts for the duration of treatment and believe that this assumption is more clinically plausible. For example, there is no clinical rationale supporting that the benefits of sevelamer in terms of hospitalized events wanes over time. On the contrary, given the mechanism of action of CBBs and their contribution to metastatic calcification in dialysis patients, it is more plausible that the benefit of sevelamer with respect to hospitalized events may become more pronounced over time. Despite these underlying differences between our analysis and the analysis conducted by Taylor et al.Citation23, it is important to note that the two analyses were consistent in their findings that sevelamer represents a cost-effective alternative to CBBs in the treatment of hyperphosphatemia in dialysis patients.
The primary strength of our evaluation is that it is based on outcomes data from a long-term, head-to-head, randomized clinical study comparing sevelamer to CBBs. The DCOR study represents the only randomized controlled trial comparing sevelamer to CBBs with respect to long-term outcomes in prevalent dialysis patients. DCOR found, on average, a 7–8% reduction in the risk of mortality for sevelamer in all patients compared with CBBs, although this reduction in mortality was not statistically significant. In a pre-specified sub-group analysis of DCOR patients ≥65 years of age, sevelamer was associated with a 23% reduction in the risk of mortality. The data from DCOR, coupled with the evidence from both prospective and retrospective studies that have also shown an association between improved survival and sevelamer, relative to CBBs, suggests that a real treatment effect existsCitation21,Citation22,Citation38.
This analysis is subject to limitations common to all decision analytic models in that it combines data from numerous sources and requires structural and data assumptions. The primary limitation of this analysis is the use of data from DCOR, a US-based clinical trial, to inform the primary inputs of the UK analysis. For example, data from the DCOR study was used to inform overall survival, hospitalization, and drug utilization. In the absence of data for a UK-specific population, it was assumed that data from DCOR was generalizable to the UK. Secondly, as data regarding overall survival was available for only 44 months, regression analysis was required to extrapolate overall survival beyond 44 months to a lifetime horizon. Finally, since data regarding the disutility associated with ESRD-related hospitalizations was not available from the published literature, this outcome was not included in the analysis. The impact of excluding this outcome was assumed to be minimal, as any health utility losses associated with short-term hospitalizations would likely be small and temporary. Excluding this outcome biases the analysis against sevelamer, given that patients receiving sevelamer spend fewer days in hospital.
Further research around the impact of phosphate binder choice on health outcomes in ESRD is in order, including adequately powered, long-term prospective, randomized trials. Until these trials are undertaken, an economic evaluation based on DCOR represents our best estimate regarding the cost-effectiveness of sevelamer in a prevalent ESRD patient population. We therefore conclude that, based on a 7–8% reduction in mortality for sevelamer compared with calcium, sevelamer represents a cost-effective approach as a first-line treatment of hyperphosphatemia in CKD patients on dialysis in the UK.
Transparency
Declaration of funding
Funding for this research was provided by Genzyme Corporation.
Declaration of financial/other relationships
Lisa Bernard and Daniel T Grima have disclosed that they are employees of and shareholders in Cornerstone Research Group Inc., which received funds from Genzyme Corporation for the conduct of this study. Elizabeth S. Dunn is an employee of Genzyme Corporation. David Mendelssohn and Colin Hutchison have received honorarias for scientific consulting from Genzyme Corporation.
References
- Hruska KA, Methew S, Lund R, et al. Hyperphosphatemia of chronic kidney disease. Kidney Int 2008;74:148-57
- Tentori F, Blayney MJ, Albert JM, et al. Mortality risk for dialysis patients with different levels of serum calcium, phosphorus, and PTH: the Dialysis Outcomes and Practice Patterns Study (DOPPS). Am J Kidney Dis 2008;52:519-30
- Tonelli M, Sacks F, Pfeffer M, et al.; Cholesterol and Recurrent Events Trial Investigators. Relation between serum phosphate level and cardiovascular event rate in people with coronary disease. Circulation 2005;112:2627-3
- Dhingra R, Sullivan LM, Fox CS, et al. Relations of serum phosphorus and calcium levels to the incidence of cardiovascular disease in the community. Arch Intern Med 2007;167:879-85
- Kestenbaum B, Sampson JN, Rudser KD, et al. Serum phosphate levels and mortality risk among people with chronic kidney disease. J Am Soc Nephrol 2005;16:520-8
- Kovesdy CP, Ahmadzadeh S, Anderson JE, et al. Secondary hyperparathyroidism is associated with higher mortality in men with moderate to severe chronic kidney disease. Kidney Int 2008;73:1296-302
- Qunibi WY, Nolan CA, Ayus JC. Cardiovascular calcification in patients with end-stage renal disease: a century-old phenomenon. Kidney Int Suppl 2002 Dec;(82):S73-80
- Kidney Disease: Improving Global Outcomes (KDIGO) CKD-MBD Work Group. KDIGO clinical practice guideline for the diagnosis, evaluation, prevention: treatment of Chronic Kidney Disease-Mineral and Bone Disorder (CKD-MBD). Kidney Int Suppl 2009 Aug;(113):S1-130
- Steddon S, Sharples E. The UK Renal Association. Clinical Practice Guidelines: CKD-Mineral and Bone Disorders (CKD-MBD). 5th Edition (v. 6.12.10). http://www.renal.org/clinical/GuidelinesSection/Guidelines.aspx. Accessed September 2010.
- 2010 Annual Report of the Dialysis Outcomes and Practice Patterns Study: Hemodialysis Data 1999-2008. Ann Arbor, MI: Arbor Research Collaborative for Health.
- Russo D, Miranda I, Ruocco C, et al. The progression of coronary artery calcification in predialysis patients on calcium carbonate or sevelamer. Kidney Int 2007;72:1255-61
- Asmus HG, Braun J, Krause R, et al. Two year comparison of sevelamer and calcium carbonate effects on cardiovascular calcification and bone density. Nephrol Dial Transplant 2005;20:1653-61
- Block GA, Spiegel DM, Ehrlich J, et al. Effects of sevelamer and calcium on coronary artery calcification in patients new to hemodialysis. Kidney Int 2005;68:1815-24
- Chertow GM, Burke SK, Lazarus JM, et al. Poly[allylamine hydrochloride] (RenaGel): a noncalcemic phosphate binder for the treatment of hyperphosphatemia in chronic renal failure. Am J Kidney Dis 1997;29:66-71
- Burke SK, Slatopolsky EA, Goldberg DI. RenaGel, a novel calcium- and aluminum-free phosphate binder, inhibits phosphate absorption in normal volunteers. Nephrol Dial Transplant 1997;12:1640-4
- Guérin AP, London GM, Marchais SJ, et al. Arterial stiffening and vascular calcifications in end-stage renal disease. Nephrol Dial Transplant 2000;15:1014-21
- Goodman WG, Goldin J, Kuizon BD, et al. Coronary artery calcification in young adults with end-stage renal disease who are undergoing dialysis. N Engl J Med 2000;342:1478-83
- Delmez J, Block G, Robertson J, et al. A randomized, double-blind, crossover design study of sevelamer hydrochloride and sevelamer carbonate in patients on hemodialysis. Clin Nephrol 2007;68:386-91
- Suki W, Zabaneh R, Cangiano J, et al. Effects of sevelamer and calcium-based phosphate binders on mortality in hemodialysis patients. Kidney Int 2007;72:1130-7
- Suki WN; for the Dialysis Clinical Outcomes Revisited Investigators. Effects of sevelamer and calcium-based phosphate binders on mortality in hemodialysis patients: results of a randomized clinical trial. J Renal Nutr 2008;18:91-8
- Block GA, Raggi P, Bellasi A, et al. Mortality effect of coronary calcification and phosphate binder choice in incident hemodialysis patients. Kidney Int 2007;71:438-41
- Borzecki AM, Lee A, Wang SW, et al. Survival in end stage renal disease: calcium carbonate vs. sevelamer. J Clin Pharm Ther 2007;32:617-24
- Taylor MJ, Elgazzar HA, Chaplin S, et al. An economic evaluation of sevelamer in patients new to dialysis. Curr Med Res Opin 2008;24:601-8
- Manns B, Klarenbach S, Lee H, et al. Economic evaluation of sevelamer in patients with end-stage renal disease. Nephrol Dial Transplant 2007;22:2867-78
- Huybrechts KF, Caro JJ, Wilson DA, et al. Health and economic consequences of sevelamer use for hyperphosphatemia in patients on hemodialysis. Value Health 2005;8:549-61
- Huybrechts KF, Caro JJ, O'Brien JA. Prevention and management of hyperphosphatemia with sevelamer in Canada: health and economic consequences. Value Health 2009;12:16-19
- Ansell D, Feehally J, Feest TG, et al. UK Renal Registry Report 2007. Bristol: UK Renal Registry
- British Medical Association and the Royal Pharmaceutical Society of Great Britain. British National Formulary (BNF) 53. http://www.bnf/org/uk/bnf/. Accessed September 2009.
- Department of Health. Reference costs 2006-07. London: DoH, 2008. http://www.dh.gov.uk/en/Publicationsandstatistics/Publications/PublicationsPolicyAndGuidance/DH_082571. Accessed September 2009
- Dale PL, Hutton J, Elgazzar H. Utility of health states in chronic kidney disease: a structured review of the literature. Curr Med Res Opin 2008;24:193-206
- Bass EB, Wills S, Fink NE, et al. How strong are patients' preferences in choices between dialysis modalities and doses? Am J Kidney Dis 2004;44:695-705
- de Witt GA, Ramsteijn PG, de Charro FT. Economic evaluation of end stage renal disease treatment. Health Policy 1998;44:215-32
- Gorodetskaya I, Zenios S, McCulloch CE, et al. Health-related quality of life and estimates of utility in chronic kidney disease. Kidney Int 2005;68:2801-8
- Manns B, Johnson JA, Taub K, et al. Quality of life in patients treated with haemodialysis or peritoneal dialysis: what are the important determinants? Clin Nephrol 2003;60:341-51
- Sennfalt K, Magnusson M, Carlsson P. Comparison of haemodialysis and peritoneal dialysis – a cost-utility analysis. Peritoneal Dial Int 2002;22:39-47
- National Institute for Health and Clinical Excellence (NICE), 2008. Guide to the methods of technology appraisal. 2008. http://www.nice.org.uk/media/B52/A7/TAMethodsGuideUpdatedJune2008.pdf. Accessed February 2009
- Baboolal K, McEwan P, Sondhi S, et al. The cost of renal dialysis in a UK setting - a multicentre study. Nephrol Dial Transplant 2008;0:1-8
- Collins AJ, St Peter WL, Dalleska FW, et al. Hospitalization risks between Renagel phosphate binder treated and non-Renagel treated patients. Clin Nephrol 2000;54:334-41