
Abstract
Objective:
To evaluate the real-world rates of hypoglycemia and related costs among patients with type 2 diabetes mellitus (T2DM) who initiated insulin glargine with either a disposable pen or vial-and-syringe.
Methods:
Pooled data were evaluated from six previously published, retrospective, observational studies using US health plan insurance claims databases to investigate adults with T2DM who initiated insulin glargine. The current study evaluated baseline characteristics, hypoglycemic events, and costs during the 6 months prior to and 12 months following insulin glargine initiation. Comparisons were made between patients initiating treatment with a disposable pen (GLA-P) and vial-and-syringe (GLA-V). Multivariate analyses using baseline characteristics as covariates determined predictors of hypoglycemia after initiating insulin glargine.
Results:
This study included 23,098 patients (GLA-P: 14,911; GLA-V: 8187). Overall annual prevalence of hypoglycemia was low (6.3% overall, 2.2% related to hospital admission or emergency department visit). Prevalence was significantly lower with GLA-P (5.5% vs 7.7%; p < 0.0001). Furthermore, average glycated hemoglobin HbA1c reduction was higher with GLA-P (−1.22% vs −0.86%; p = 0.0012). The average annual hypoglycemia-related cost associated with initiating insulin glargine was $293, with GLA-P being 46% lower than GLA-V ($225 vs $417; p = 0.001). Patients who had already developed microvascular complications at the time of initiating insulin therapy were at higher risk for developing hypoglycemia.
Limitations:
This study is limited by the use of retrospective data and ICD-9-CM codes, which are subject to coding error. In addition, this pooled analysis used unmatched cohorts, with multivariate regression analyses employed to adjust for between-group differences. Finally, results describe a managed care sample and cannot be generalized to all patients with T2DM.
Conclusions:
Patients with T2DM initiating insulin glargine treatment showed low rates of hypoglycemia, especially when using a disposable pen device. Hypoglycemia-related costs were low, contributing a very small proportion to overall diabetes-related healthcare costs.
Introduction
Type 2 diabetes mellitus (T2DM) is characterized by a progressive loss of beta-cell function and insulin hyposecretion; in order to achieve adequate glycemic control, most patients with T2DM will eventually require insulinCitation1. Despite the well-known benefits of early insulin initiationCitation2, many patients face protracted and unnecessary delays in initiating insulin therapyCitation3 due to treatment barriers among patients and providers alikeCitation1,Citation4,Citation5. Hypoglycemia is a common complication of insulin therapy and a leading limiting factor of anti-diabetes therapyCitation6. Furthermore, in patients with T2DM, hypoglycemia has a substantial negative impact on the patient’s quality-of-life in terms of physical, mental, and social functioningCitation7. Short-term effects of hypoglycemia relate to the symptoms associated with the actual hypoglycemic episode and risks of dangerous situationsCitation7,Citation8. On the long-term, hypoglycemia has been shown to have a major impact on work productivity, weight gain, and increased risk for cardiovascular complications, but also behavioral changes, including loss of self-confidence, anxiety, and fear of future episodesCitation7,Citation8.
In addition, hypoglycemia is associated with a higher risk of anti-diabetes treatment discontinuation and a significantly increased financial burden for the patient, the healthcare system, and the societyCitation7,Citation9–12.
Cost-driving factors induced by hypoglycemia include hospital admissions, emergency visits, out-of-pocket expenses required to manage hypoglycemic events, but also the indirect costs associated with the reduced quality-of-life, reduced work capacity, and increased long-term complicationsCitation8,Citation10.
The selection of treatments to provide good glycemic control with the lowest possible risk of hypoglycemia is an important consideration for healthcare decision-makers looking to provide the best possible, cost-effective treatment strategy care for patients with T2DMCitation7. Glycemic control and hypoglycemic complications may be influenced by the type of insulin and the delivery method used. Insulin glargine is a long-acting basal insulin analog that, compared with conventional insulin therapy, has a significantly reduced hypoglycemia occurrence that may result in cost savingsCitation13. Although direct medication costs are higher with insulin pens compared with vial-and-syringe systems, using insulin pens improves patient adherence and may reduce the occurrence of hypoglycemia without increasing total healthcare costsCitation5,Citation14.
Clinical studies using glucose-confirmed hypoglycemia can provide information about the association between anti-diabetes treatments and the risk of hypoglycemia. Real-world studies using claims-based data on hypoglycemia provide particularly valuable information about the impact of hypoglycemia on healthcare costs; these hypoglycemic events may represent more severe events requiring assistance and medical care. This claims-based study was designed to evaluate the real-world rates of hypoglycemia and related healthcare costs among patients with T2DM who initiated insulin glargine with either a disposable pen or vial-and-syringe. It represents the perspective of US payers with regard to hypoglycemia-related costs incurred, and as such is not designed to capture wider societal costs associated with diabetes.
Patients and methods
This pooled analysis evaluated patient-level data collected from US health plan administrative claims databases. Data from six previously published, retrospective, observational studies of T2DM patients initiating insulin glargine were includedCitation14–19. Each included study compared initiation of insulin glargine administered using a disposable pen (SoloSTAR®, sanofi-aventis U.S., Bridgewater, NJ) with other injectable therapy (insulin glargine vial-and-syringe (Lantus®, sanofi-aventis U.S.), insulin detemir disposable pen (FlexPen®, Novo Nordisk A/S, Bagsværd, Denmark), or the incretin mimetic, exenatide (Byetta®, Amylin Pharmaceuticals, Inc., San Diego, CA)). Although stringent 1:1 propensity score matchingCitation20 was used in each study to ensure that treatment cohorts were comparable in observed baseline characteristics, the analysis used pooled patient-level data from two unmatched cohorts of patients and only included data from the insulin glargine disposable pen (GLA-P) and vial-and-syringe (GLA-V) cohorts. Individual patients were not identifiable, in accordance with the Health Insurance Portability and Accountability Act (HIPAA) of 1996.
Patient selection criteria
Potential study candidates were patients with T2DM, defined as having at least one inpatient visit or two physician visits dated at least 30 days apart with a primary or secondary diagnosis of International Classification of Diseases, Ninth Revision, Clinical Modification (ICD-9-CM) codes 250.x0 or 250.x2. In addition, patients were required to be at least 18 years old at the time of insulin glargine initiation (index date) and to have previously received treatment with oral anti-diabetes drugs (OADs) or glucagon-like peptide-1 receptor agonists prior to initiating GLA-P or GLA-V between January 2007 and December 2009. Patients were required to have continuous health plan coverage for at least 6 months prior to (baseline or pre-index period) and for at least 1 year after (follow-up period) initiating insulin glargine. Duplicate patient records were removed when pooling the data.
Outcome measures
Baseline patient characteristics were recorded. Outcome measures included hypoglycemia at follow-up and hypoglycemia claim-related costs. The identification of hypoglycemic events was based on ICD-9-CM codes, consistent with the codes published by Zhao et al.Citation21. Hypoglycemia was defined as a healthcare encounter (outpatient, inpatient, or emergency department [ED] visit) with a primary or secondary ICD-9-CM diagnosis code for hypoglycemia (ICD-9-CM code 250.8–diabetes with other specified manifestations; 251.0–hypoglycemic coma; 251.1–other specified hypoglycemia; or 251.2–hypoglycemia, unspecified)Citation22. A limitation of retrospective observational claims data studies is the unavailability of glucose-confirmed hypoglycemia data. Therefore, in order to capture information on severity of hypoglycemia, the setting of hypoglycemia diagnosis was used as a proxy of severity; severe and non-severe hypoglycemia were defined as inpatient/ED hypoglycemia and outpatient hypoglycemia, respectively. Follow-up hypoglycemic events during the 1-year follow-up period included all hypoglycemic events, including recorded inpatient, outpatient, and ED hypoglycemic events. Hypoglycemia claim-related costs included costs related to total hypoglycemia claims and inpatient, outpatient, and ED hypoglycemia claim-related costs.
The prevalence and event rates of hypoglycemia and associated healthcare costs were measured over the 1-year follow-up period and compared for GLA-P and GLA-V initiators. Prevalence was defined as the proportion of patients experiencing at least one hypoglycemic event during the 1-year follow-up. Event rate was defined as the number of hypoglycemic events per patient-year during the 1-year follow-up. Healthcare costs were computed as plan-paid amounts of adjudicated claimsCitation17, total paid amountCitation14–16,Citation19, and total chargeCitation18. In order to remove the cost bias that originates from different databases, the final cost variable for the pooled analysis was determined as the percentage of costs divided by total cost or diabetes-related total cost.
Statistical analysis
Descriptive statistics were used for demographics and other baseline variables to describe differences between the GLA-P and GLA-V cohorts. Baseline factors assessed included age at the time of insulin initiation, gender, glycated hemoglobin A1C (HbA1c) level, OAD use, comorbidities, total and diabetes-related healthcare utilization and costs, and hypoglycemia.
Correlation analyses were used to determine the relationship between the number of hypoglycemic events and HbA1c reduction from baseline. Multivariate analyses, using baseline characteristics as a covariate, were conducted to determine predictors of hypoglycemia during the 1-year follow-up. Logistic regression analysis was used to examine the relationship between baseline characteristics and the probability of experiencing any hypoglycemic event, or hypoglycemic events related to hospitalization or ED visit during the 1-year follow-up period. Negative binomial regression analyses were used to explore the relationship between baseline characteristics and the number of any hypoglycemic events or inpatient/ED hypoglycemic events during the 1-year follow-up period.
Results
Baseline characteristics
A total of 26,118 patients were included in the six retrospective observational studies, with 23,098 meeting criteria for the current study (GLA-P: n = 14,911; GLA-V: n = 8187). The mean age of all patients at index date was 54.1 years: 53.5% were men, the mean Charlson comorbidity index (CCI) score was 0.55 and patients were previously treated with a mean of 2.45 OADs. In the 2554 patients with available data (GLA-P: n = 1,812; GLA-V: n = 742), the mean baseline HbA1c value was 9.34%. Baseline data are summarized in .
Table 1. Baseline demographics and clinical characteristics.
Prevalence and hypoglycemia event rates during 1-year follow-up
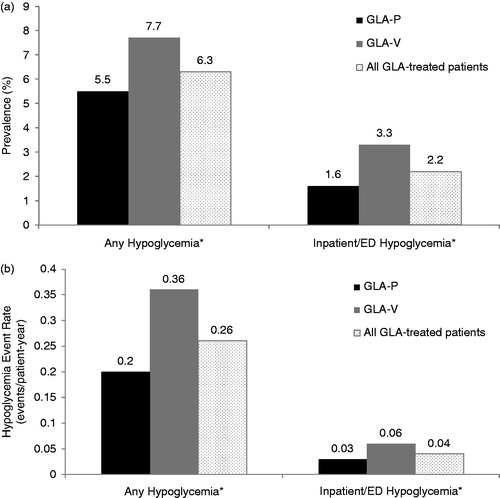
During the 1-year follow-up, overall prevalence of any hypoglycemic event and inpatient/ED hypoglycemic events was low (6.27% and 2.19%, respectively) (). The prevalence of hypoglycemia was significantly lower for GLA-P patients compared with GLA-V patients (p < 0.0001). Similarly, overall event rates of any hypoglycemia and inpatient/ED hypoglycemia were low (0.26 and 0.04 events/patient-year, respectively), and significantly lower for GLA-P compared with GLA-V patients (p < 0.0001; ).
Figure 1. Annual prevalence rate (a) and event rate (b) of hypoglycemia. *p < 0.0001 for GLA-P vs GLA-V. ED, emergency department; GLA, insulin glargine; GLA-P, insulin glargine with disposable pen; GLA-V, insulin glargine with vial and syringe.
Among those patients with available baseline and follow-up HbA1c data (n = 2554), the average HbA1c reduction from baseline was −1.22% in GLA-P patients compared with −0.86% in GLA-V patients (p = 0.0012). The number of hypoglycemic events was significantly correlated with reduction in HbA1c from baseline (r = −0.152; p < 0.0001).
The average HbA1c reduction was higher for patients who had inpatient/ED hypoglycemia during the follow-up compared with patients who only had outpatient hypoglycemia during the follow-up (−1.65% [median −1.4%] vs −1.57% [median −1.0%]). However, a higher frequency of inpatient/ED hypoglycemia was not significantly associated with a higher HbA1c reduction.
Healthcare costs associated with hypoglycemia during 1-year follow-up
The average annual hypoglycemia-related cost associated with initiating insulin glargine was 46% lower for GLA-P compared with GLA-V patients ($225 vs $417; p = 0.001). The overall hypoglycemia-related cost contributed to 0.75% of the overall healthcare cost and 1.50% of the diabetes-related healthcare cost; again, a significant benefit (p < 0.0001) was observed for GLA-P compared with GLA-V patients ().
Figure 2. Associated absolute (a) and relative costs (b) of hypoglycemia. (a) Data are presented as costs associated with any hypoglycemia or inpatient/ED hypoglycemia. (b) Data are presented as percentage of total costs or of diabetes-related costs. p-values for between-group comparison GLA-P vs GLA-V: *p = 0.001; †p = 0.02; ‡p < 0.0001; $p = 0.0003. ED, emergency department; GLA, insulin glargine; GLA-P, insulin glargine with disposable pen; GLA-V, insulin glargine with vial-and-syringe.
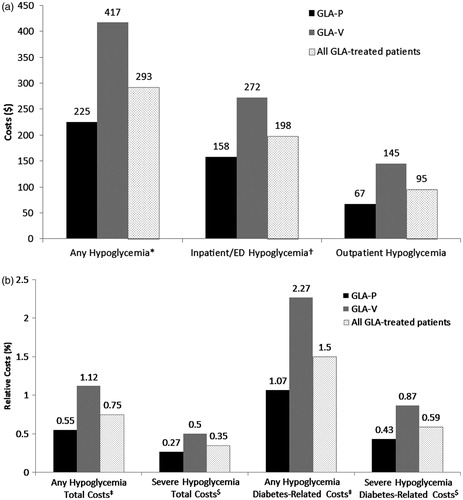
When considering only inpatient/ED hypoglycemia-related costs, the average annual cost associated with initiating insulin glargine was $198, which amounted to 0.35% of the total cost and 0.59% of the total diabetes-related cost. As for the overall hypoglycemia-related cost, inpatient/ED hypoglycemia-related costs were significantly lower in the GLA-P cohort compared with the GLA-V cohort ().
Compared with patients who only experienced outpatient hypoglycemia during the 1-year follow-up, patients with inpatient/ED hypoglycemia had higher overall and diabetes-related healthcare costs. This was mainly due to increased inpatients/ED costs. However, a higher frequency of inpatient/ED hypoglycemia did not correlate with higher healthcare costs.
Predictors of risk for hypoglycemia during 1-year follow-up
After adjusting for other confounding factors using logistic regression modeling, GLA-P patients were 26% less likely to have a hypoglycemic event during the 1-year follow-up (adjusted odds ratio [OR] = 0.74, 95% CI = 0.66–0.83; p < 0.0001), and 49% less likely to have an inpatient/ED hypoglycemic event (adjusted OR = 0.51, 95% CI = 0.42–0.61; p < 0.0001) than GLA-V patients.
Baseline characteristics that were associated with a significantly increased risk of any hypoglycemia were CCI, hypoglycemia, neuropathy, and severe mental illness (); CCI, neuropathy, and nephropathy also predicted a significantly increased risk of inpatient/ED hypoglycemia. In contrast, previous use of metformin (OR = 0.86; 95% CI = 0.75–0.99; p = 0.0307) predicted a significantly reduced risk of any hypoglycemia ().
Table 2. Logistic regression model for predictors of hypoglycemia.
Negative binomial regression analysis was used to determine any relationship between baseline characteristics and the number of hypoglycemic events. After adjusting for other confounding factors, GLA-P patients had significantly fewer hypoglycemia events compared with GLA-V patients: 0.14 vs 0.22 estimated hypoglycemic events per patient-year (p < 0.0001) and 0.02 vs 0.04 estimated inpatient/ED hypoglycemic events per patient-year (p < 0.0001).
Baseline characteristics that were significantly and positively correlated with the number of any hypoglycemic events were CCI, hypertension, retinopathy, and neuropathy (); CCI, retinopathy, and neuropathy were also positively correlated with the number of inpatient/ED hypoglycemic events.
Table 3. Negative binomial regression model of numbers of hypoglycemic events.
Baseline hypoglycemia was also significantly correlated with the number of any hypoglycemic events during follow-up. However, the severity of hypoglycemia at baseline only played a role when predicting the number of inpatient/ED hypoglycemic events during follow-up ().
Previous metformin and exenatide use were negatively correlated with the number of any hypoglycemic events as well as with the number of inpatient/ED hypoglycemic events, while previous sulfonylurea use showed a positive correlation with the number of any hypoglycemic events only ().
Discussion
This study evaluated the prevalence and event rates of hypoglycemia and related costs in real-world settings among patients initiating insulin therapy with GLA-P or GLA-V. Patient-level information was evaluated from six retrospective observational studies that each investigated the medical and economic outcomes of initiating insulin glargine in adult T2DM patients enrolled in US health plan administrative claims databases. Our findings show that patients initiating insulin glargine treatment had low rates of hypoglycemia, which contributed to just 0.75% of the cost of total health-related claims during 1-year follow-up, and 1.50% of the cost of diabetes-related health claims. Furthermore, initiating insulin glargine with a disposable pen device was found to be associated with significantly lower rates of hypoglycemia, and significantly lower hypoglycemia-related total and diabetes-related costs compared with vial-and-syringe. Importantly, these findings relate only to those hypoglycemic events and costs captured in the claims database. Under-reporting of hypoglycemia by patients may lead to reduced numbers of recorded hypoglycemic events in the claims databaseCitation23. Furthermore, mild hypoglycemic events are not captured, but may be associated with substantial economic consequences to patients, including time away from work and increased costs associated with glucose monitoring after the eventCitation10. As reported by Brod et al.Citation10, the economic burden of mild hypoglycemic events was estimated to be $55.16 in the US per event due to work absenteeism and productivity loss. The total average monthly out-of-pocket costs required to manage mild hypoglycemic events was estimated to be $35.36 per month for US patientsCitation10. Since we observed an association of the use of the pen device with reducing hypoglycemic events severe enough to be recorded in the claims database compared with vial-and-syringe, also milder events may be reduced with the improved glycemic control afforded when pen devices are used to administer insulin.
Unlike the individual studies that used propensity score matching to remove observed patient selection bias at baselineCitation14–19, this study pooled patient-level data from two unmatched cohorts of patients that, although broadly comparable, resulted in significant and potentially clinically relevant differences in baseline characteristics. Therefore, multivariate regression analyses were used to adjust for these differences. Both bivariate and multivariate analyses yielded similar results. Despite these differences, the pooled analysis revealed similar findings in relation to hypoglycemia prevalence and event rates and related costs to those observed in the individual studies (data not shown). In each of the six studies, initiating insulin glargine with a disposable pen was associated with greater treatment adherence and/or persistence without an increase in costs when compared with exenatideCitation17, FlexPenCitation14, and GLA-VCitation14,Citation17,Citation18. Moreover, the prevalence and event rates of hypoglycemia in GLA-P initiators was similar to exenatideCitation19 and FlexPenCitation16, and significantly lower than with GLA-VCitation14,Citation17,Citation18.
The large patient sample used in this analysis enabled investigation of the relationship between baseline characteristics in the overall population (i.e., GLA-P and GLA-V patients) and hypoglycemia. Baseline characteristics that were positively correlated with hypoglycemic events included CCI, retinopathy, and neuropathy. Of note, the high incidence of neuropathy and retinopathy at baseline (8.6% and 7.1%, respectively) in the sample may indicate advanced diabetes disease among the patients in the analysis, as does the high baseline HbA1c (9.34%). Based on these data, it would appear that patients who have already experienced microvascular complications due to inadequate glycemic control at the time of initiating insulin therapy may be at higher risk of hypoglycemia. This may point to possible clinical inertia in the treatment of T2DM in the US, which has also been associated with macrovascular complicationsCitation24. These findings are consistent with the findings from a previously published analysis of a large US administrative claims database in which the presence of individual micro- and macrovascular complications of diabetes increased the relative rate of hypoglycemiaCitation22. In addition, among patients who had both baseline and 1-year follow-up HbA1c data available, HbA1c reduction was associated with a significantly increased risk of hypoglycemia. Multivariate analysis in this sub-sample also showed that higher baseline HbA1c was associated with significantly increased hypoglycemia rates during the follow-up period (p = 0.023). Hypoglycemia at baseline also strongly predicted hypoglycemia during follow-up.
Interpretation of the data from the current analysis is limited by the use of unmatched cohorts, as discussed above. Because this is a retrospective analysis, causality between treatment delivery and differences in outcomes could not be established. Blood glucose data was not available, and identification of hypoglycemia events was based on ICD-9-CM codes in the claims data and was, therefore, subject to coding error. The use of ICD-9-CM codes may over- or under-estimate hypoglycemia and the associated costs; the ICD-9-CM codes for hypoglycemia used in all the pooled studies were based on those published by Zhao et al.Citation21, which were less stringent than the ICD-9-CM code-based algorithm published by Ginde et al.Citation25. Therefore, it is possible that our studies over-estimated the hypoglycemia rates. The true rate of hypoglycemia among the patients analyzed in our study may, however, be higher than that recorded in the claims database. Mild or self-treated events, for example, would not have been captured, and under-reporting of hypoglycemia by patients may also lead to reduced numbers of recorded hypoglycemic events in the claims databaseCitation23. It has been shown that observational studies rely on methods that are inadequate for identifying all possible adverse eventsCitation26, suggesting that hypoglycemia event rates reported from claims databases may not provide sufficient information on hypoglycemia events compared to clinical trials, in which all instances of hypoglycemia are captured. In our study, due to a lack of glucose reading, we used the setting of hypoglycemia diagnosis as proxy of severity, with inpatient/ED hypoglycemia indicating severe hypoglycemia. This may result in further under-reporting of severe hypoglycemia rates, and may explain why in this analysis higher frequency of inpatient/ED hypoglycemia was not significantly associated with a higher HbA1c reduction. In addition, since milder hypoglycemia and other adverse events are not captured by the claims database, and these may involve costs for the patient, these would not be included in the cost analyses either. Since HbA1c data were not available for all patients in the pooled analysis, an additional limitation is that the association between hypoglycemia and HbA1c levels could only be examined in a sub-group of the study population. Finally, information analyzed for this study was based on data collected from a US managed care population. As a result, these data may not be representative of other populations, and the conclusions may not be appropriately generalized to all patients with T2DM. In particular, the results of this analysis of US data may not apply to patients with T2DM in Europe where use of the pen devices for insulin injections is higherCitation27, where insulin is added to treatment regimens at an earlier stage, and reimbursement differences exist.
Conclusion
Patients initiating insulin glargine treatment showed low rates of hypoglycemia, especially when using a disposable pen device. Hypoglycemia-related costs were low, contributing a very small proportion to overall and diabetes-related healthcare costs. Certain baseline patient characteristics were associated with increased risk of hypoglycemia.
Transparency
Declaration of funding
Study funding provided by Sanofi US, Inc.
Declaration of financial/other relationships
WW is an employee of Sanofi US, Inc. LX and OB are employees of STATinMED Research which received funding to carry out this work from Sanofi US, Inc. CP is an employee of PRO Unlimited which received funding to carry out this work from Sanofi US, Inc.
Acknowledgments
The authors received writing/editorial support in the preparation of this manuscript provided by Rosalie Gadiot, PhD, of Excerpta Medica, funded by Sanofi US, Inc.
References
- Marrero DG. Overcoming patient barriers to initiating insulin therapy in type 2 diabetes mellitus. Clin Cornerstone 2008;9:63-70
- Meneghini L. Why and how to use insulin therapy earlier in the management of type 2 diabetes. South Med J 2007;100:164-74
- Goodall G, Sarpong EM, Hayes C, et al. The consequences of delaying insulin initiation in UK type 2 diabetes patients failing oral hyperglycaemic agents: a modelling study. BMC Endocr Disord 2009;9:19
- Brunton S. Initiating insulin therapy in type 2 diabetes: benefits of insulin analogs and insulin pens. Diabetes Technol Ther 2008;10:247-56
- Cuddihy RM, Borgman SK. Considerations for diabetes: treatment with insulin pen devices. Am J Ther 2011: published online July 15 2011, doi: 10.1097/MJT.0b013e318217a5e3
- American Diabetes Association. Standards of medical care in diabetes—2012. Diabetes Care 2012;35(1 Suppl):S11-63
- Fidler C, Elmelund Christensen T, Gillard S. Hypoglycemia: an overview of fear of hypoglycemia, quality-of-life, and impact on costs. J Med Econ 2011;14:646-55
- Ahrén B. Avoiding hypoglycemia: a key to success for glucose-lowering therapy in type 2 diabetes. Vasc Health Risk Manag 2013;9:155-63
- Quilliam BJ, Simeone JC, Ozbay AB, et al. The incidence and costs of hypoglycemia in type 2 diabetes. Am J Manag Care 2011;17:673-80
- Brod M, Christensen T, Thomsen TL, et al. The impact of non-severe hypoglycemic events on work productivity and diabetes management. Value Health 2011;14:665-71
- Bron M, Marynchenko M, Yang H, et al. Hypoglycemia, treatment discontinuation, and costs in patients with type 2 diabetes mellitus on oral antidiabetic drugs. Postgrad Med 2012;124:124-32
- Hammer M, Lammert M, Mejías SM, et al. Costs of managing severe hypoglycaemia in three European countries. J Med Econ 2009;12:281-90
- Dailey G, Strange P. Lower severe hypoglycemia risk: insulin glargine versus NPH insulin in type 2 diabetes. Am J Manag Care 2008;14:25-30
- Davis S, Wei W, Garg S. Clinical impact of initiating insulin glargine with disposable pen versus vial in patients with type 2 diabetes mellitus in a managed care setting. Endocr Pract 2011;17:845-52
- Xie L, Wei W, Pan C, et al. A real-world study of patients with type 2 diabetes initiating basal insulins via disposable pens. Adv Ther 2011;28:1000-11
- Du J, Wei W, Xie L, et al. Real-world outcomes of initiating two different basal insulin therapies via disposable pens among patients with type 2 diabetes in US employer-sponsored health plans. Value Health 2011;14:A476
- Garg SK, Wei W, Cao Z, et al. Clinical and economic outcomes among employees or their dependents with type 2 diabetes initiating insulin glargine via disposable pen or vial. J Gen Intern Med 2012;27(2 Suppl):S99-574
- Lin J, Ling J, Wei W, et al. Outcomes of initiating insulin glargine therapy with disposable pen or vial among patients with type 2 diabetes in a US managed care health plan. J Diabetes Sci Technol 2012;6:462-5, A1-A202
- Baser O, Wei W, Baser E, et al. Clinical and economic outcomes in patients with type 2 diabetes initiating insulin glargine disposable pen versus exenatide BID. J Med Econ 2011;14:673-80
- Rosenbaum PR, Rubin DB. The central role of the propensity score in observational studies for causal effects. Biometrika 1983;70:41-55
- Zhao Y, Campbell CR, Fonseca V, et al. Impact of hypoglycemia associated with antihyperglycemic medications on vascular risks in veterans with type 2 diabetes. Diabetes Care 2012;35:1126-32
- Simeone JC, Quilliam BJ. Predictors of emergency department and outpatient visits for hypoglycemia in type 2 diabetes: an analysis of a large US administrative claims database. Ann Pharmacother 2012;46:157-68
- Williams SA, Shi L, Brenneman SK, et al. The burden of hypoglycemia on healthcare utilization, costs, and quality of life among type 2 diabetes mellitus patients. J Diabetes Complications 2012;26:399-406
- Levy P. The current unmet need in type 2 diabetes mellitus: addressing glycemia and cardiovascular disease. Postgrad Med 2009;121:7-12
- Ginde AA, Blanc PG, Lieberman RM, et al. Validation of ICD-9-CM coding algorithm for improved identification of hypoglycemia visits. BMC Endocr Disord 2008;8:4
- Hakobyan L, Haaijer-Ruskamp FM, de Zeeuw D, et al. A review of methods used in assessing non-serious adverse drug events in observational studies among type 2 diabetes mellitus patients. Health Qual Life Outcomes 2011;9:83
- Da Costa S, Brackenridge B, Hicks D. A comparison of insulin pen use in the United States and the United Kingdom. Diabetes Educ 2002;28:52-60