Abstract
Objective:
Colorectal cancer (CRC) is the third most commonly diagnosed cancer in Canada (excluding non-melanoma skin cancers). Bevacizumab is a recombinant humanized monoclonal antibody that selectively binds to human vascular endothelial growth factor. A sub-study confirmed its effectiveness in KRAS wild-type patients. Recent evidence has shown clinical benefit from anti-epidermal growth factor treatments cetuximab and panitumumab in these patients. The cost-effectiveness, to the Canadian healthcare system, of fluoropyrimidine-based chemotherapy (FBC) in combination with bevacizumab, cetuximab, or panitumumab was assessed for first-line treatment of KRAS wild-type mCRC patients.
Methods:
A Markov model was developed and calibrated to progression-free/overall survival, using separately reported trial survival and adverse event results for each comparator. Health-state resource utilization was derived from published data and oncologist input. Utilities and unit prices were obtained from published literature and standard Canadian sources.
Results:
Results per patient are over a lifetime horizon, to a maximum of 10 years, with 5% annual discounting. Comparators are ordered by total cost and the incremental cost-effectiveness ratio (ICER) of each is determined against the previous non-dominated therapy. Compared to FBC alone, bevacizumab + FBC has an ICER of $131,600 per QALY gained. Compared to bevacizumab + FBC, panitumumab + FBC is dominated and cetuximab + FBC has an ICER of $3.8 million per QALY. In probabilistic sensitivity analysis, bevacizumab + FBC had ∼100%, ∼100%, and 98.9% probabilities of being more cost-effective than both of the other combination treatments at thresholds of $50,000/QALY, $100,000/QALY, and $200,000/QALY, respectively.
Conclusion:
For first-line treatment of KRAS-WT mCRC, bevacizumab + FBC is associated with substantially lower costs as compared to panitumumab + FBC or cetuximab + FBC. Key limitations were that survival curves and adverse event rates were taken from separate clinical trials and that an indirect comparison was not included. Given these findings, bevacizumab is likely to offer the best value for money for this patient population.
Introduction
Colorectal cancer (CRC) is the third most commonly diagnosed cancer in Canada (excluding non-melanoma skin cancers). CRC is also the second leading cause of death from cancer in men and the third leading cause of death from cancer in women in CanadaCitation1. It is expected that one in 14 Canadians will be diagnosed with CRC during their lifetime, with a 5-year relative survival rate of 63%Citation2. A relatively large proportion of colorectal cancer cases (i.e., ∼20%) are diagnosed at a metastatic stageCitation3.
Guidelines from the National Comprehensive Cancer Network (NCCN), Cancer Care Ontario (CCO), and the British Columbia Cancer Agency recommend bevacizumab (Avastin®) as first-line standard of care for treatment of metastatic colorectal cancer (mCRC)Citation4–6. Bevacizumab is a recombinant humanized monoclonal antibody that selectively binds to human vascular endothelial growth factor (anti-VEGF), inhibiting the binding of VEGF to its receptors, Flt-1 and KDR, on the surface of endothelial cellsCitation7. Neutralizing the biologic activity of VEGF reduces the vascularization of tumors, thereby inhibiting tumor growthCitation8. Key clinical results, from a phase III study by Hurwitz et al.Citation9 in previously untreated mCRC patients, report an additional 4.7 months overall survival (OS) when bevacizumab is added to fluoropyrimidine-based chemotherapy (FBC), specifically Irinotecan, Fluorouracil, and Leucovorin (IFL), as compared to FBC alone (median = 20.3 months vs 15.6 months, respectively; p < 0.001).
Recent evidence has also shown clinical benefit from use of anti-epidermal growth factor receptor (EGFR) treatments such as cetuximabCitation10 and panitumumabCitation11 in first-line treatment of patients who have tested negative for KRAS gene mutations (Wild Type, WT). Cetuximab in combination with FOLFIRI (irinotecan, 5-fluorouracil, leucovorin) has recently been approved by Health Canada for first-line mCRC KRAS-WT treatmentCitation12, while a sub-study from the Hurwitz et al.Citation13 2004 trial has confirmed the effectiveness of bevacizumab in the KRAS-WT sub-group of mCRC patients. Phase III head-to-head data comparing the efficacy of anti-EGFRs to bevacizumab in first-line mCRC have not yet been published. Although the clinical evidence has demonstrated benefits associated with targeted therapies such as cetuximab, panitumumab, and bevacizumab in mCRC, increasing the utilization of such therapies will impact the already significant economic burden associated with the treatment of this diseaseCitation14. Hence, it is of interest to reimburse decision-makers, healthcare funders, and physicians to understand the relative value of these first-line treatment strategies. The objective of this economic evaluation was, therefore, to assess the clinical outcomes, costs, and cost-effectiveness to the Canadian healthcare system of FBC in combination with bevacizumab, cetuximab, or panitumumab for first-line treatment of KRAS-WT mCRC patients.
Methods
Model overview
A cost-effectiveness model was developed to estimate costs and outcomes using separately reported trial survival and adverse event results for each comparator (FBC alone, bevacizumab + FBC, cetuximab + FBC, and panitumumab + FBC). The Markov Model was built in Microsoft Excel® and included three mutually exclusive health states: Pre-Progression, Progression, and Death (see ). Costs and utilities were assigned to each health state.
Figure 1. Markov model structure.
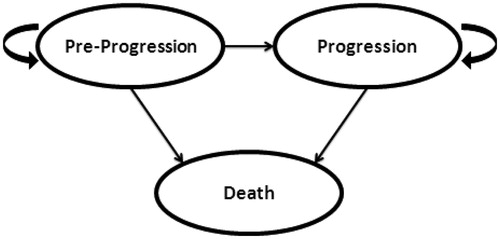
Movement through the model is governed by the probability of events occurring at the end of each 2-week Markov cycle. All patients started in the Pre-Progression health state and could either remain in that health state, transition to death, or progress based on fixed transition probabilities. From the Progression health state, based on fixed transition probabilities, patients could either remain or transition to death. Model outputs include total costs, life years (LYs), and quality-adjusted life years (QALYs).
We followed standard practice in cost-effectiveness analyses when interpreting resultsCitation15,Citation16. Incremental cost-effectiveness ratios (ICERs) were calculated by ranking treatments from the least to the most costly and calculating the ratio of incremental cost to incremental QALYs for increasingly costly treatments. Treatments that were less effective and more costly than another comparator were considered ‘dominated’ and no ICER was calculated. Treatments that were incrementally less cost-effective (higher ICER) than a more effective treatment were considered ‘weakly dominated’ and were excluded when calculating ICERs of non-dominated treatments.
Model parameters and data sources
The modeled target population was based on KRAS-WT patients from the study by Hurwitz et al.Citation9,Citation13. Eight hundred and thirteen patients with previously untreated metastatic colorectal cancer were included in the Hurwitz et al.Citation9 2004 trial and were randomly assigned to receive either IFL plus bevacizumab (5 mg per kilogram of body weight every 2 weeks) or IFL plus placebo. An exploratory analysis was later conducted including only patients with sufficient tumor tissue for molecular assessment of KRAS (230 of 813 patients (28%))Citation13. Of these 230 patients, 129 had been randomly assigned to receive IFL chemotherapy plus bevacizumab, and 101 had been randomly assigned to receive IFL chemotherapy plus placebo. The median ages in the groups were 62.0 and 58.0 years, respectively. All patients had a baseline Eastern Cooperative Oncology Group (ECOG) performance status of either 0 or 1, with 60.5% and 61.4% of patients in the groups, respectively, with a baseline ECOG performance status of 0. The demographic and baseline characteristics were similar in this sub-set of patients with available tumor tissue and the entire study population from the 2004 trial.
Model calibration
Probabilities of cancer progression and death were derived from separate clinical trial data for each comparator by calibrating the transition probabilities in the model to fit the published overall survival (OS) and progression-free survival (PFS) curves. The OS and PFS curves were extracted from KRAS-WT patient data as presented in for IFLCitation13, bevacizumab + IFLCitation13, cetuximab + FOLFIRICitation10, and panitumumab + FOLFOX4Citation11.
Table 1. Key clinical trials.
In the absence of head-to-head trials, the safety and efficacy of IFL, FOLFIRI, and FOLFOX4 were evaluated from published studies. Tournigand et al.Citation17 showed median survival to be equivalent between FOLFOX and FOLFIRI in the first-line treatment of mCRC (21.5 vs 20.6 months, p = 0.99). In this comparison, FOLFOX was associated with markedly higher risk of grade 3 or greater neutropenia and neurotoxicity but was counterbalanced by a reduced incidence of febrile neutropenia, mucositis, and nausea and vomiting compared to FOLFIRI. In the Phase III trial BICC-C, the median OS was not significantly different between the FOLFIRI vs modified IFL arm (23.1 vs 17.6 months, p = 0.09)Citation18. As such, the safety and efficacy of IFL, FOLFIRI, and FOLFOX4 were assumed equal for the purposes of this analysis and hereafter referred to as FBC in order to compare across regimens.
In order to calibrate the model, the model was run to generate OS and PFS curves. The transition probabilities governing these curves were calibrated using Solver in Microsoft Excel to minimize the mean squared differences between the model-generated curves and the OS and PFS curves from the trial. The restrictions imposed on the transition probabilities were as follows:
No transition probability may be less than 0 or greater than 1; and
The transition probability from progression-free to death cannot be higher than the transition probability from progression to death.
Kaplan-Meier survival and PFS estimatesCitation19 used as ‘targets’ for the calibration were generated using the extracted data and the following assumptions. First, it was assumed that all deaths observed between time points (t, t + 1) occurred just before time t + 1 (t measured in 2-week intervals). Second, no censoring of the times of patients’ deaths was assumed except for the final time point in which the survival time was assumed to be censored for all remaining patients.
Adverse events
Grade 3/4 adverse event rates for each comparator were obtained from separate clinical trials for FBCCitation13, bevacizumab + FBCCitation13, cetuximab + FBCCitation10, and panitumumab +FBCCitation11, and without adjustment for patient characteristics. Adverse events were included if there was a statistically significant difference between the rates in the bevacizumab/anti-EGFR arm of the trial and the FBC arm (thus excluding events due to FBC alone), and were identified by expert advisor input (NA, KC, JE) to be associated with significant cost.
Costs
The economic evaluation was conducted from the Canadian healthcare system perspective, and costs are reported in 2011 Canadian dollars. Costs not available in 2011 Canadian dollars were adjusted for inflation using the consumer price index for health and personal careCitation20. Base case model parameters are described below and reported in .
Table 2. Base case model parameters.
Costs for the Pre-Progression health state include study chemotherapy dosages and duration, treatment of toxicity, and chemotherapy administration and other supportive care for cancer. As per the study protocols, chemotherapy acquisition and administration as well as supportive care costs were included until progression. Treatment of toxicity was applied as a one-time cost for all patients in the first model cycle.
Chemotherapy regimen dosing and frequency were modeled as reported by the respective trials, which are consistent with CCO and British Columbia Cancer Agency protocols for each treatment armCitation21,Citation22. All regimens were administered every 2 weeks with the exception of cetuximab (weekly)Citation21,Citation22. Chemotherapy costs were obtained from IMS Brogan, CCO, and a 2010 Canadian pharmacoeconomic evaluation by Dranitsaris et al.Citation23 of bevacizumab in mCRC.
In line with the most commonly used regimen, FOLFIRI costs and dosages were assumed for the FBC alone and the bevacizumab-containing regimen. In a 2012 year end chart audit conducted by the Summit Strategy GroupCitation24, 17% of first line mCRC patients treated with palliative intent received FOLFOX as their backbone chemotherapy, whereas 65% received FOLFIRI as their backbone chemotherapy, suggesting a general preference for FOLFIRI in the Canadian marketplace. In addition, Health Canada approval for both cetuximab and bevacizumab in the first-line treatment of mCRC is based on phase III trials in combination with irinotecan-based chemotherapyCitation12,Citation25. In any case, there are no available data for the survival benefit of bevacizumab in combination with oxaliplatin-containing regimens (i.e., FOLFOX4) for KRAS-WT patients.
Canadian resource use for treatment of adverse events was estimated based on expert input from oncologists (NA, KC, JE) and unit prices from standard sources for CanadaCitation26–30 (Personal communication, JE, NA, KC). The total cost of treating each adverse event was calculated by multiplying the overall cost per adverse event by the proportion of patients experiencing each adverse event for each comparator.
Chemotherapy administration and pre-progression supportive care costs were obtained from Dranitsaris et al.Citation23 and were validated by advisor input (NA, KC, JE). These costs were specific to patients receiving either FOLFIRI or FOLFOX, and included standard pre-medication and entimetics; materials, supplies, personnel, chemotherapy unit stays, and physician visits; and standard laboratory and diagnostic tests. Additionally, a one-time cost for insertion of a port-line was included for all patients for adminitration of infusional fluorouracilCitation28. Costs for the progressing disease health state included subsequent treatments for advancing cancer and other supportive care for cancer. Upon progression, we assumed that 70% of patients would move on to second-line therapy, which was assumed to be a switch to either 3 months of FOLFOX or FOLFIRI monotherapy depending on the first-line treatment regimen (Personal communication, JE, NA).
Tournigand et al.Citation17 showed that patients receiving FOLFOX6 in second-line, following FOLFIRI in first-line, had a median of eight cycles of second line therapy (16 weeks) compared to only six cycles (3 months) of second-line FOLFIRI when FOLFOX6 was given in the first-line. In a recently published study of bevacizumab treatment in metastatic colorectal cancer, the patients receiving chemotherapy plus bevacizumab followed by chemotherapy alone arm reported median treatment duration of 3.2 months in second-lineCitation31.
Best supportive care costs were applied for each cycle in the Progression health state, as reported by Dranitsaris et al.Citation23, and included radiation therapy, blood transfusions, analgesics, and home care.
Quality-of-life
Utility values applied to the Pre-Progression and Progression health states were derived from a study of UK oncology nurses utilizing the Visual Analog Scale and Standard Gamble Technique for specified health statesCitation32. Modeled utilities are relative to values for perfect health (1) and death (0).
Discounting
As per Canadian guidelines, 5% annual discounting was applied to costs and outcomesCitation15. A lifetime time horizon was assumed to a maximum of 10 years in order to capture all costs and benefits for each comparator.
Analyses
Deterministic sensitivity analyses
We conducted deterministic sensitivity analyses to explore the sensitivity of the model to parameter variability and uncertainty within plausible ranges, and also to assess the impact of alternative assumptions on the outcomes of the analysis.
The costs of adverse events, supportive care, and subsequent chemotherapy for each treatment arm were varied from +20% to −20%. Utility values for the Pre-Progression and Progression health states were varied from +20% to −20%. We could not find a comprehensive data source of disutilities for all of the adverse events considered in the model. Therefore, a sensitivity analysis was performed with an aggressive assumption that adverse events were assumed to reduce utility by 10% from its baseline level separately for the bevacizumab, cetuximab, and panitumumab treatment arms. As per Canadian guidelines, alternative discounting rates of 3% and 0% were examinedCitation15.
In order to investigate the impact of changes in the values of the transition probabilities on the model results, estimates of sampling variability around the OS and PFS curves for the therapies were used in a range of calibrations. Confidence intervals were computed for the survival function at each time point based on a log-log transformation of the survival functionCitation33. A confidence level of 68.26% was used, corresponding to one standard error above and below the survival function point estimate. The lower confidence limit corresponds to higher mortality rates than in the base case (i.e., ‘worst case’), while the upper confidence limit corresponds to lower mortality rates than in the base case (i.e., ‘best case’).
Probabilistic sensitivity analysis
For probabilistic sensitivity analysis we applied beta distributions to the probabilities of progression and death at each time point in the PFS and OS functions, respectively, for each treatment. Monte Carlo sampling from these distributions was used to generate 1000 sets of PFS curves and OS curves for each treatment, which were used to generate 1000 sets of calibrated transition probabilities for the model. Results from the probabilistic sensitivity analysis are presented in cost-effectiveness acceptability curves showing the probabilities that each treatment is the most cost-effective option at ICER thresholds of $50,000, $100,000, and $200,000 per QALY.
Results
Model calibration
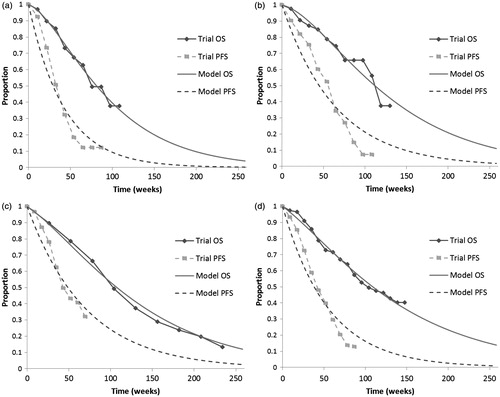
The fitted OS and PFS curves along with data from the clinical trial are illustrated in . Calibrated transition probabilities associated with the fitted curves are presented in .
Figure 2. Model calibration results—survival curves. (a) IFLCitation13; (b) Bevacizumab + IFLCitation13; (c) Cetuximab + FOLFIRICitation10; (d) Panitumumab + FOLFOXCitation11.
Base case results
Results per patient over a lifetime horizon, to a maximum 10 years with 5% discounting, are presented in . Comparators are ordered by total cost, and the incremental cost-effectiveness ratio (ICER) of each is determined against the next less costly non-dominated therapy. Compared to FBC alone, bevacizumab + FBC has an ICER of $131,600 per QALY gained. Compared to bevacizumab + FBC, panitumumab + FBC is dominated (more expensive and fewer QALYs), and cetuximab +FBC has an ICER of $3.8 million per QALY.
Table 3. Base case results (per patient)*.
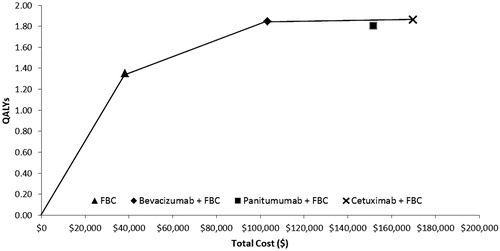
represents a plot of the four treatment strategies on the cost-effectiveness frontier. ICERs between two treatment strategies can be represented by the slope of the connecting line.
Figure 3. Cost-effectiveness frontier.
Sensitivity analysis results
Results were most sensitive to changes in patient survival based on varying the model transition probabilities over the range of sampling uncertainty in the data. The key results from the deterministic sensitivity analysis based on patient survival comparing bevacizumab + FBC against each of the comparators are summarized in . Results are shown under three scenarios: base-case survival and PFS for all regimens, best-case (upper-bound survival for bevacizumab + FBC, lower-bound survival for other regimens), and worst-case (lower-bound survival for bevacizumab + FBC, upper-bound survival for other regimens).
Table 4. Patient survival sensitivity analysis results: ICERs*.
Compared to the base case calibration of the FBC arm, bevacizumab + FBC is more expensive and has greater QALYs per patient for all three sets of bevacizumab + FBC transition probabilities tested, and is associated with a cost per QALY between $107,017–$145,597 compared to FBC alone, ). In the probabilistic sensitivity analysis, bevacizumab + FBC had ∼100%, ∼100%, and 98.9% probabilities of being more cost-effective than both of the other combination treatments, at thresholds of $50,000/QALY, $100,000/QALY, and $200,000/QALY, respectively (). The remaining variables tested had minimal impact on the ICERs and did not change the base case conclusions ().
Figure 4. Cost-effectiveness acceptability curves.
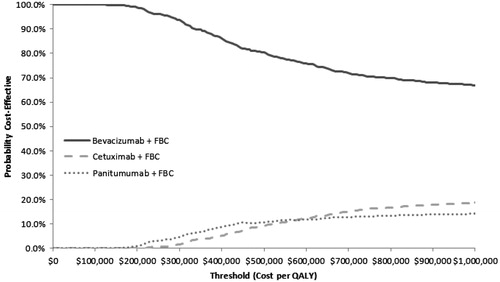
Table 5. Sensitivity analyses results: transition probabilities.
Table 6. One-way sensitivity analyses results.
Discussion
Recent evidence has emerged on the safety and efficacy of anti-EGFR regimens such as cetuximab + FBC and panitumumab + FBC for the first-line treatment of KRAS-WT mCRC patients. The current standard of care for first-line mCRC, regardless of KRAS status, bevacizumab + FBC, also has published evidence confirming its effectiveness in the KRAS-WT sub-group of mCRC. Published data from separate clinical trials (not head-to-head) suggests that bevacizumab-containing regimens are associated with an additional 4 months of progression-free and overall survival as compared to those receiving anti-EGFR containing regimens. The objective of this analysis was to evaluate the clinical outcomes, costs, and cost-effectiveness of FBC alone and in combination with bevacizumab, panitumumab, or cetuximab for first-line treatment of KRAS-WT mCRC patients.
In terms of total costs and costs per 2-week treatment cycle, bevacizumab + FBC costs substantially less than either anti-EGFR containing regimen. FBC alone is the least costly and least effective of the four regimens. Despite more time spent progression-free (and thus receiving longer treatment) as compared to the anti-EGFR containing regimens, total costs are less for patients receiving bevacizumab-containing regimens. While the cost for treating adverse events for bevacizumab-containing regimens is greater than that of the anti-EGFR containing regimens, the cost of treating adverse events is less than 1% of the total cost of therapy. Cetuximab-based regimens involve weekly infusions, resulting in additional administration costs to the healthcare system, yet total costs are still estimated to be lower than total costs for panitumumab-containing regimens.
Total QALYs were similar between the bevacizumab + FBC and anti-EGFR + FBC regimens, and greater than the FBC alone regimen. When treatment strategies were ordered by total cost and the ICER of each determined against the next less effective non-dominated therapy, bevacizumab + FBC is associated with an additional $131K per QALY as compared to FBC alone. Panitumumab + FBC is dominated by bevacizumab +FBC in that the bevacizumab regimen is estimated to be associated with less cost and additional QALYs per patient. Cetuximab + FBC is estimated to be associated with an additional $3.8 million per QALY as compared to bevacizumab + FBC.
Base case results were sensitive to variations in treatment-specific modeled transition probabilities. In the best-case scenario for bevacizumab + FBC, bevacizumab + FBC both saves money and improves quality-adjusted survival when compared to either anti-EGFR + FBC. In the worst-case scenario for bevacizumab + FBC, both cetuximab + FBC and panitumumab + FBC produced more QALYs than bevacizumab + FBC, but the ICERs were $387K and $535K, respectively, compared to bevacizumab + FBC. Through all sensitivity analyses investigated, bevacizumab + FBC was never dominated by either anti-EGFR + FBC. Probabilistic sensitivity analyses showed that bevacizumab + FBC was ∼100% or 98.9% likely to be more cost-effective than both panitumumab + FBC and cetuximab + FBC, assuming a willingness to pay up to $50,000 or $200,000, respectively, to gain one QALY.
In the context of recent literature, a recent publication has found cetuximab to be cost effective vs bevacizumab. However, in Asseburg et al.Citation34 the study population only included KRAS-WT mCRC patients for cetuximab and all patients for bevacizumab regardless of KRAS status. The efficacy of bevacizumab in KRAS-WT patients was grossly under-estimated for KRAS-WT patients and patient populations were not comparable.
In our current analysis, only KRAS-WT patients were included. However, a key limitation was that survival curves and adverse event rates were taken from separate clinical trials, and an indirect comparison was not included. Indirect comparisons were not feasible because of insufficient published data to adjust for important covariates, including different chemotherapy backbones for the separate trials. For each comparator, survival curves were extracted from published clinical trial results and were not based on patient-level data. As such, we extensively investigated the impact of changes in the values of the transition probabilities on the model results.
It should also be noted that the Hurwitz et al.Citation13 analysis specific to the KRAS sub-group was retrospective, and therefore tissue was not available for KRAS assessment for greater than 70% of the study population. As stated in the conclusion of the 2009 publication, an unintentional selection bias is possible, although patient and tumor characteristics were comparable between the KRAS sub-group and the overall study population.
For the first-line treatment of KRAS-WT mCRC, bevacizumab + FBC is associated with substantially lower costs as compared to panitumumab + FBC or cetuximab + FBC. In the base case and through all worst-case scenario survival analyses tested, introduction of either anti-EGFR + FBC for first line treatment of KRAS-WT mCRC is predicted to be dominated or associated with ICERs well beyond commonly accepted cost per QALY thresholds when compared to bevacizumab + FBC. Given these findings, bevacizumab + FBC is likely to offer the best value for money in this patient population.
Transparency
Declaration of funding
This study was sponsored by Hoffmann-LaRoche Ltd. Hoffmann-LaRoche Ltd reviewed and provided comment on the draft versions of the manuscript and also approved the final version.
Declaration of financial/other relationships
Donna Lawrence, Michael Maschio, Kevin J. Leahy, and Milton C. Weinstein are employees of OptumInsight. OptumInsight was funded by Hoffmann-La Roche to adapt the model and provide editorial support for the manuscript. The authors from OptumInsight did not receive individual payments from Hoffmann-La Roche for their involvement in this study. Simon Yunger is an employee of Hoffmann-La Roche and has stock or other ownership interest in Hoffmann-La Roche. Jacob C. Easaw is an employee of Tom Baker Cancer Center and has received honoraria and research funding from Hoffmann-La Roche. JME Peer Reviewers on this manuscript have no relevant financial or other relationships to disclose.
Acknowledgments
The authors thank Dr Natalie Aucoin (NA) and Dr Kelvin Chan (KC) for their input in Canadian resource utilization and recommendations for treatment of adverse events.
References
- Advisory Committee on Cancer Statistics. Canadian Cancer Statistics 2013. Toronto, ON: Canadian Cancer Society, 2013. http://www.cancer.ca/en/cancer-information/cancer-type/colorectal/statistics/. Accessed June 2013
- Canadian Cancer Society’s Steering Committee on Cancer Statistics. Canadian Cancer Statistics 2011. Toronto, ON: Canadian Cancer Society, 2011
- Howlader N, Noone AM, Krapcho M, et al. SEER Cancer Statistics Review, 1975-2009 (Vintage 2009 Populations). Bethesda, MD: National Cancer Institute. http://seer.cancer.gov/csr/1975_2009_pops09/, based on November 2011 SEER data submission, posted to the SEER website, 2012. Accessed August 2013
- Benson AB 3rd, Bekaii-Saab T, Chan E, et al. Metastatic colon cancer, version 3.2013: featured updates to the NCCN Guidelines. J Natl Compr Canc Netw 2013;11:141-52
- Jonker D, Biagi J, Haynes AE. The use of epidermal growth factor receptor inhibitors in advanced colorectal cancer. Toronto (ON): Cancer Care Ontario; 2008 Jul 9 [Archived 2012]. Program in Evidence-based Care CED-CCO Special Advice Report No.: 8 Archived
- British Columbia Cancer Agency. Cancer Management Guidelines: Colon. Treatment Options by Stage Based on Current Evidence. Revised 05 Sept 2012 Available at: http://www.bccancer.bc.ca/HPI/CancerManagementGuidelines/Gastrointestinal/05.Colon/5.6+Treatment+Options+by+Stage+Based+on+Current+Evidence.htm. [Last accessed August 2013]
- Presta LG, Chen H, O'Connor SJ, et al. Humanization of an anti-vascular endothelial growth factor monoclonal antibody for the therapy of solid tumors and other disorders. Cancer Res 1997;57:4593-9
- Kim KJ, Li B, Winer J, et al. Inhibition of vascular endothelial growth factor-induced angiogenesis suppresses tumour growth in vivo. Nature 1993;362:841-4
- Hurwitz H, Fehrenbacher L, Novotny W, et al. Bevacizumab plus irinotecan, fluorouracil, and leucovorin for metastatic colorectal cancer. NEJM 2004;350:2335-42
- Van Cutsem E, Köhne CH, Láng I, et al. Cetuximab plus irinotecan, fluorouracil, and leucovorin as first-line treatment for metastatic colorectal cancer: updated analysis of overall survival according to tumor KRAS and BRAF mutation status. J Clin Oncol 2011;29:2011-9
- Douillard JY, Siena S, Cassidy J, et al. Randomized, phase III trial of panitumumab with infusional fluorouracil, leucovorin, and oxaliplatin (FOLFOX4) versus FOLFOX4 alone as first-line treatment in patients with previously untreated metastatic colorectal cancer: the PRIME study. J Clin Oncol 2010;28:4697-705
- ImClone LLC. Erbitux Product Monograph. 2012
- Hurwitz H, Yi J, Ince W, et al. The clinical benefit of bevacizumab in metastatic colorectal cancer is independent of K-ras mutation status: analysis of a phase III study of bevacizumab with chemotherapy in previously untreated metastatic colorectal cancer. Oncologist 2009;14:22-8
- Song X, Zhao Z, Barber B, et al. Cost of illness in patients with metastatic colorectal cancer. J Med Econ 2011;14:1-9
- Canadian Agency for Drugs and Technologies in Health. Guidelines for the economic evaluation of health technologies: Canada. 3rd edn. Ottawa: Government of Canada, 2006
- Gold MR, Siegel JE, Russell LB, et al. Cost-effectiveness in health and medicine. New York: Oxford University Press, 1996
- Tournigand C, Andre T, Achille E et al. FOLFIRI followed by FOLFOX6 or the reverse sequence in advanced colorectal cancer: a randomized GERCOR study. J Clin Oncol 2004;22:229-37
- Fuchs CS, Marshall J, Mitchell E, et al. Randomized, controlled trial of irinotecan plus infusional, bolus, or oral fluoropyrimidines in first-line treatment of metastatic colorectal cancer: results from the BICC-C Study. J Clin Oncol 2007;25:4779-86
- Kaplan EL, Meier PL. Nonparametric estimation from incomplete observations. J Am Statist Assoc 1958;56:457-81
- Statistics Canada. CANSIM Table 326-0021. Consumer Price Index (CPI), 2009 basket. Ottawa: Government of Canada, 2013. Available at: http://www5.statcan.gc.ca/cansim/a26?lang=eng&retrLang=eng&id=3260021&pattern=326-0020..326-0022&tabMode=dataTable&srchLan=-1&p1=-1&p2=31. [Last accessed 20 February 2012]
- Cancer Care Ontario. Cancer Care Ontario Drug Formulary. 2011. Available at: https://www.cancercare.on.ca/toolbox/drugs/drugformulary/. [Last accessed November 2011]
- British Columbia Cancer Agency. Chemotherapy Protocols: Gastrointestinal. 2011. Available at: http://www.bccancer.bc.ca/HPI/ChemotherapyProtocols/default.htm. [Last accessed November 2011]
- Dranitsaris G, Truter I, Lubbe MS, et al. The application of pharmacoeconomic modelling to estimate a value-based price for new cancer drugs. J Eval Clin Pract 2012;18:343–51
- Hoffmann-La Roche Limited. Data on file. 2012
- Hoffmann-La Roche Limited. Avastin Product Monograph. 2012
- Ontario Ministry of Health and Long-Term Care. Ontario Drug Benefit Formulary/Comparative Drug Index. 2012. Available at: www.healthinfo.moh.gov.on.ca/formulary/index.jsp. [Last accessed January 2012]
- Régie de l'assurance maladie du Québec. List of Medications. Last Updated on 16 December 2011. Available at: www.prod.ramq.gouv.qc.ca. [Last accessed January 2012]
- Ontario Case Costing Initiative. Ontario guide to case costing. Province of Ontario, Canada: Ministry of Health and Long-Term Care, 2012. Available at: www.occp.com/mainPage.htm. [Last accessed February 2012]
- Ontario Ministry of Health and Long-Term Care. Schedule of Benefits: Physician Services under the Health Insurance Act. Ontario: 2012. Available at: www.health.gov.on.ca/english/providers/program/ohip/sob/physserv/a_consul.pdf [Last accessed January 2012]
- CanadaDrugs.com. 2012. Available at: www.canadadrugs.com. [Last accessed January 2012]
- Bennouna J, Sastre J, Arnold D, et al. Continuation of bevacizumab after first progression in metastatic colorectal cancer (ML18147): a randomised phase 3 trial. Lancet Oncol 2013;14:29-37
- Petrou S, Campbell N. Stabilisation in colorectal cancer. Int J Palliat Nurs 1997;3:275-80
- SAS Institute Inc. SAS/STAT® 9.2 User's Guide, Second Edition. The LIFETEST Procedure: Pointwise Confidence Limits in the OUTSURV= Data Set. Cary, NC: SAS Institute Inc. 2009. http://support.sas.com/documentation/cdl/en/statug/63033/HTML/default/viewer.htm#statug_lifetest_a0000000262.htm. [Last accessed 14 June 2012]
- Asseburg C, Frank M, Köhne CH, et al. Cost-effectiveness of targeted therapy with cetuximab in patients with K-ras wild-type colorectal cancer presenting with initially unresectable metastases limited to the liver in a German setting. Clin Ther 2011;33:482-97