
Abstract
Objective:
To estimate direct medical costs for patients with tuberous sclerosis complex (TSC) and surgical resection of subependymal giant-cell astrocytoma (SEGA).
Methods:
This retrospective cohort study selected patients who had SEGA surgery and TSC claims between 2000–2011 from three large US nationwide claims databases. Selected patients were age 35 or less and had continuous health insurance in the year before and the year after their first SEGA surgery claim. The study examined the patients’ demographic and clinical characteristics and estimated inpatient, outpatient, medication, and total medical costs paid by insurance companies for the pre-surgery year, post-surgery year, and other study periods, respectively. Repeated measures analysis and bootstrapping technique were used to assess the impact of the surgery on the direct medical costs.
Results:
Select patients (n = 47) had a mean baseline age of 11.6 years and 66% were male. Many had seizures (91.0%), hydrocephalus (59.6%), vision disorders (38.3%), stroke and hemiparesis (36.2%), and shunt (34.0%) in the pre-surgery year. The mean direct medical costs were $8543 (inpatient: $3770; outpatient: $3473; medication: $1300) for the pre-surgery year, and $85,397 (inpatient: $71,562; outpatient: $11,497; medication: $2338) for the post-surgery year. With the exclusion of the costs during the surgery month, the inpatient, outpatient, medication, and total costs in the post-surgery year were 1.6–4.3 times as much as the costs in the pre-surgery year (inpatient: 4.3:1; outpatient: 2.5:1; medication: 1.6:1; total: 3.1:1, p < 0.05). Repeated measures analysis with bootstrapping confirmed a link between the surgery and increases in direct medical costs (p < 0.05).
Conclusions:
SEGA surgery had a substantial impact on direct medical costs. TSC patients with the surgery experienced significant post-surgery increases in their inpatient, outpatient, and medication costs. Additional research should be conducted to examine the surgery’s cost-impact in a longer duration, or to compare the cost-effectiveness of the surgery vs other treatments.
Introduction
Tuberous sclerosis complex (TSC) is a rare genetic disorder that causes benign tumors to grow in the brain, kidneys, heart, lungs, liver, eyes and skinCitation1–10. It affects as many as 25,000–50,000 people in the US and 1–2 million people worldwideCitation8–11 through its clinical sequelae such as seizures, developmental delay, intellectual disability, autism, renal hemorrhage, and sudden deathCitation8–21.
Among TSC patients, 5–20% have subependymal giant-cell astrocytoma (SEGA)Citation2,Citation9,Citation22,Citation23, which is a glioneuronal brain tumor that arises near the foramen of MonroCitation24–27. As it increases in size, the tumor can obstruct spinal fluid flow, increase cerebral pressure, and cause headaches, blurred vision, or sudden death from acute hydrocephalusCitation8–11,Citation22–27.
Surgical resection has long been a traditional treatment for SEGACitation1,Citation2,Citation8–11,Citation22–27. Because of tumor depth, the surgery is often difficult and incomplete and results in complicationsCitation1,Citation26,Citation28–35. Previously published studies on SEGA surgery have mainly been anecdotal case reports due to the rarity of the diseaseCitation6,Citation26,Citation28–32,Citation34,Citation36,Citation37.
In 2012, we published a US nationwide retrospective study that not only confirmed the surgery’s associations with its complications and SEGA-related conditions, but also described significant numbers of repeat surgeriesCitation1,Citation2. However, direct post-surgery medical costs for patients with the surgery remain unknown, and the relationship between the surgery and patients’ direct medical costs continue to perplex patients, physicians, payers, and researchers. To address these issues, we conducted a US nationwide retrospective study that estimated direct inpatient, outpatient, medication, and total costs, and examined the impact of the surgery on these costs.
Methods
Data sources
Data sources for the study came from the following three large US nationwide health claims databases: MarketScan commercial claims databases (2000–2011), MarketScan Medicaid national claims databases (2004–2010) and Pharmetrics commercial claims databases (2000–2011). These databases contained electronically-encrypted inpatient, outpatient, and medication claims with enrollment records for ∼60 million patients in the US. Claims from these databases had diagnosis, procedure, and medication codes with payment and utilization information. Enrollment records from the databases gave us patients’ demographic and benefit coverage information. Together, they allowed us to determine clinical conditions and treatment, as well as healthcare utilization and costs for patients with disease.
Study design, duration, and sample selection
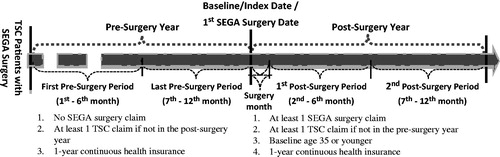
We used a retrospective cohort study design with TSC patients who had their first SEGA surgery claim between 2000–2011. Selected patients were 35 years of age or younger and had continuous health insurance for the year before and the year after their first SEGA surgery claim. To facilitate cross-period comparison, we divided the pre-surgery year into the first and last pre-surgery periods (each period was 6 months in length), and the post-surgery year into surgery month (the first post-surgery month), the first post-surgery period (from the 2nd through 6th post-surgery month), and the second post-surgery period (from the 7th through 12th post-surgery month). shows the study design, duration, and sample selection.
Figure 1. Study design, duration, and selection criteria.
Measurement
We used International Classification of Disease, 9th Revision, Clinical Modification (ICD-9CM) codes and current procedure terminology (CPT) codes to identify TSC (ICD-9CM: 759.5), SEGA (ICD-9CM: 225.0 or 237.5), and other related conditions. SEGA surgeries were identified through claims that simultaneously had TSC and SEGA diagnosis codes, as well as one of the following procedure codes: CPT code: 61510, 61512, 61518, 61519, 61520, 61521, 61526, 61530, 61545, 61546, 61548; ICD-9CM Procedure Code: 01.59, 02.2, 01.2, 01.24, 01.25.
We collected patients’ gender and baseline age as their demographic characteristics, and examined whether they had a healthcare claim with one of 21 SEGA-related conditions during any study period. These conditions included seizures, hydrocephalus, vision disorders, stroke and hemiparesis, autism, sleep disorders, and others. The Appendix presents corresponding ICD-9CM codes for these 21 conditions.
Direct medical costs were in 2010 US dollars with a 3% annual discount rate to convert costs from other years into 2010Citation38. These costs included inpatient, outpatient, and medication costs paid by insurance companies for the following study periods: the pre-surgery year, post-surgery year, last pre-surgery period (6 months), the surgery month, the first post-surgery period (from 2nd through 6th post-surgery month), and the second post-surgery period (from 7th through 12th post-surgery month).
Statistical analysis
Statistical analysis included the assessment of patients’ demographic and clinical characteristics, as well as their inpatient, outpatient, medication, and total medical costs for each study period. Analysis also involved the use of a paired sample dependent t-test for examining the pre–post differences in the prevalence rates of SEGA-related conditions. Finally, we employed repeated measures analysis and bootstrapping technique to determine the impact of the surgery on the prevalence of SEGA-related conditions and direct medical costs.
Results
Study sample and demographic characteristics
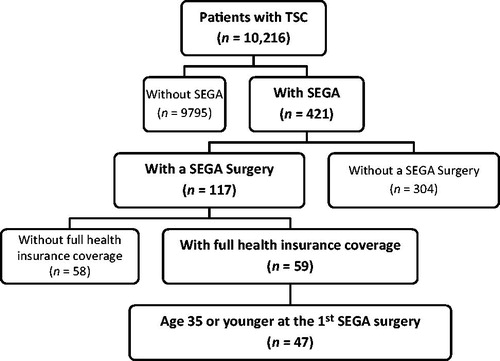
The three databases contained 10,216 TSC patients. Of these patients, 421 had SEGA (4.1%) and 117 had at least one SEGA surgery (27.8% of TSC-SEGA patients). After we had excluded patients without continuous health insurance or age greater than 35 years, 47 patients remained (). These patients had a mean baseline age of 11.6 years, and 66% were male.
Figure 2. Sample selection scheme.
SEGA-related conditions
Percentages of patients with a healthcare claim for individual SEGA-related conditions changed throughout the study periods. In the pre-surgery year, the percentages were 91.0% for seizures, 34% for shunt, 59.6% for hydrocephalus, 38.3% for vision disorders, and 36.2% for a stroke and hemiparesis. In the last six pre-surgery months, these percentages changed to 63.8% for seizure, 34.0% for hydrocephalus, 34.0% for vision disorders, and 27.7% for stroke or hemiparesis (). After the surgery, the percentages for the first and second post-surgery period increased significantly to 89.4% and 87.2% for seizure, 59.6% and 55.3% for hydrocephalus, 36.2% and 34.0% for stroke and hemiparesis, 70.2% and 72.3% for headaches, and 23.4% and 23.4% for autisms (p < 0.05 for all conditions). Repeated measures analysis with bootstrapping suggested a link (p < 0.05) between the surgery and increases in these conditions ().
Table 1. Percentages of patients with a claim for SEGA-related conditions in three different time periods.
Direct medical costs
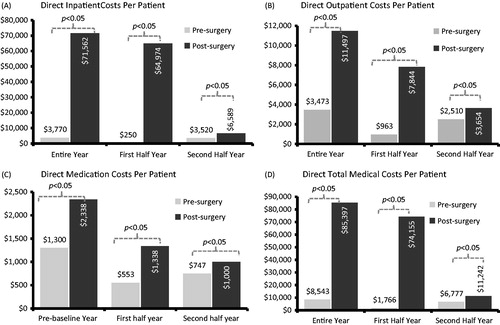
Mean total direct medical costs per patient increased from $8543 for the pre-surgery year to $85,397 for the post-surgery year. The majority of the increase came from inpatient care ($67,792 or 88.2% of the increase) and outpatient care ($8024 or 10.4% of the increase). Only a small portion of the increase came from medication ($1038 or 1.4% of the increase). presents the estimates of inpatient, outpatient, medication, and total direct medical costs per patient for the first half, second half, and full year before or after the surgery. Based on repeated measures analysis with bootstrapping technique, all pre–post comparisons of inpatient, outpatient, medication, and total direct medical costs were statistically significant (p < 0.05).
Figure 3. Cross-period comparison of direct medical costs by half and full years. All cross-period differences were statistically significant based on repeated measures analysis with bootstrapping.
presents the evolutionary trend in inpatient, outpatient, medication, and total direct medical costs from the last pre-surgery period through the second post-surgery period. Both inpatient and total direct medical costs per patient in the surgery month were 8–15 times as much as the costs in the last 6 pre-surgery months (inpatient: $55,486 vs $3520; total costs: $58.516 vs $6777; p < 0.05). However, outpatient and medication costs per patient in the surgery month were only slightly higher or lower than the costs in the last 6 pre-surgery months (outpatient: $2729 vs $2510; medication: $301 vs $747, p < 0.05). Finally, inpatient, outpatient, medication, and total direct medical costs per patient were 34–170% higher in the first or second post-surgery period than in the last pre-surgery period (p < 0.05). summarizes the mean estimates and standard deviations of inpatient, outpatient, medication, and total direct costs for individual study periods.
Figure 4. Cross-period comparison of direct medical costs by study period. All cross-period variations were statistically significant based on repeated measures analysis with bootstrapping. Also, the last pre-surgery period was 6 months before the surgery, the first post-surgery period was from the 2nd through 6th post-surgery month, and the second post-surgery period was from the 7th through 12th post-surgery month.
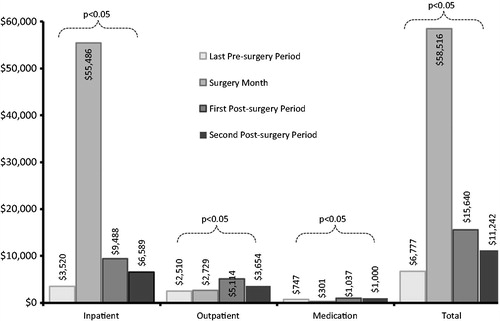
Table 2. Direct medical costs by types and study periods.
Discussion
SEGA with TSC is a very rare disease. This rarity imposes considerable challenges in conducting empirical studies that examine clinical and economic outcomes of SEGA surgery among TSC patients. By combining three large US national claims databases, the current study was able to identify a sufficiently large sample of TSC patients who had the surgery. By using repeated measures analysis with bootstrapping, we estimated and compared the direct inpatient, outpatient, medication, and total costs for and across different periods before and after the surgery.
The current study confirmed the link between SEGA surgery and significant increases in direct medical costs. Different from traditional pre–post medical cost comparison studies, our study not only compared direct medical costs between pre- and post-surgery years, but also compared the costs between non-surgery periods so that the effect of cost spike during the surgery month can be removed. Surprisingly, even with the exclusion of the costs during the surgery month, the inpatient, outpatient, medication and total direct medical costs in the first post-surgery year were still 1.6–4.3 times as much as the costs in the pre-surgery year (inpatient: 4.3:1; outpatient: 2.5:1; medication: 1.6:1; total: 3.1:1, p < 0.05). We surmise that both short-term and long-term complications associated with the surgery might have contributed to the cost increase, or that post-operative increases in clinical conditions such as seizure, hydrocephalus, headache, stroke or hemiparesis, and autism might have contributed to these increased costs. Although emerging evidence suggested the formerCitation1, additional research is needed to identify underlying drivers of the cost increases, and to assess how tumor size, surgical complications, or co-morbid conditions affected the post-operative costs. Further, it is necessary to point out that some complications occurred more frequently in our study than studies in other countriesCitation23.
Like most studies using healthcare claims databases, this study has limitations. First, the sample selection criteria have excluded patients without continuous health insurance over the study periods. Second, the claims databases used in the study were mainly from large US employers, state-specific Medicaid programs and small commercial health plans; therefore, the results may not be applicable to patients with other types of health insurance, such as Medicare and federal employee health insurance programs. Third, all clinical conditions, procedures and medications identified in the study were based on ICD-9CM diagnosis codes, CPT codes or NDC codes noted on healthcare claims and were not validated through medical chart review. Therefore, clinical conditions, procedures, or medications not recorded on healthcare claims were not included in these studies. Fourth, even with adequate study design and robust analytic methods, the study was not a randomized, controlled trial and did not adjust for many possible confounding factors. Hence, robust causality between the SEGA surgery and the cost increases has yet to be established. Finally, because of data source limitation, the current study only compared the direct medical costs in the year before and after the surgery, it did not take account of long-term costs, indirect costs, or the quality adjusted life years. Therefore, future research should be conducted to examine the long-term costs, indirect costs, quality adjusted life years, and the relationship between the cost increases and surgery-related morbidity.
Conclusions
Although SEGA surgery remains a useful treatment option for TSC patients with SEGA, it was associated with significant increases in inpatient, outpatient, medication, and total direct medical costs.
Transparency
Declaration of funding
The funding of this project was provided by Novartis Pharmaceutical Corporation.
Declaration of financial/other relationships
PS is employed by Kailo Research Group, which received unrestricted research grants from Novartis. ZL is employed by Novartis and owns company stocks. MK & DK are consultants to Novartis.
Acknowledgments
The authors acknowledge the feedback from reviewers.
References
- Sun P, Kohrman M, Liu J, et al. Outcomes of resecting subependymal giant cell astrocytoma (SEGA) among patients with SEGA-related tuberous sclerosis complex: a national claims database analysis. Curr Med Res Opin 2012;28:657-63
- Sun P, Krueger D, Liu J, et al. Surgical resection of subependymal giant cell astrocytomas (SEGAs) and changes in SEGA-related conditions: a US national claims database study. Curr Med Res Opin 2012;28:651-6
- Ahmad Z, Rauf F, Azad NS, et al. Subependymal giant cell astrocytoma. J Pak Med Assoc Oct 2006;56:463-5
- Kumar R, Singh V. Subependymal giant cell astrocytoma: a report of five cases. Neurosurg Rev 2004;27:274-80
- Di Rocco C, Iannelli A, Marchese E. On the treatment of subependymal giant cell astrocytomas and associated hydrocephalus in tuberous sclerosis. Pediatr Neurosurg 1995;23:115-21
- Sinson G, Sutton LN, Yachnis AT, et al. Subependymal giant cell astrocytomas in children. Pediatr Neurosurg 1994;20:233-9
- Sugita Y, Taguchi A, Miyagi J, et al. The cystic growth of a subependymal giant-cell astrocytoma with tuberous sclerosis. Kurume Med J 1992;39:123-8
- Hallett L, Foster T, Liu Z, et al. Burden of disease and unmet needs in tuberous sclerosis complex with neurological manifestations: systematic review. Curr Med Res Opin 2011;27:1571-83
- Krueger DA, Care MM, Holland K, et al. Everolimus for subependymal giant-cell astrocytomas in tuberous sclerosis. N Engl J Med 2010;363:1801-11
- Kwiatkowski D, Whittenmore V, Thiele E, eds. Tuberous sclerosis complex: genes, clinical features and therapeutics. New York, NY: Wiley-BlackWell, 2010
- NINDS. Tuberous Sclerosis Fact Sheet. 2010. http://www.ninds.nih.gov/disorders/tuberous_sclerosis/detail_tuberous_sclerosis.htm#one. Accessed June 22, 2010
- Yates JR. Tuberous sclerosis. Eur J Hum Genet 2006;14:1065-73
- Chung TK, Lynch ER, Fiser CJ, et al. Psychiatric comorbidity and treatment response in patients with tuberous sclerosis complex. Ann Clin Psychiatry Off J Am Acad Clin Psychiatrists 2011;23:263-9
- Tsai P, Sahin M. Mechanisms of neurocognitive dysfunction and therapeutic considerations in tuberous sclerosis complex. Curr Opin Neurol 2011;24:106-13
- de Vries PJ, Hunt A, Bolton PF. The psychopathologies of children and adolescents with tuberous sclerosis complex (TSC): a postal survey of UK families. Eur Child Adolesc Psychiatry 2007;16:16-24
- Rok P, Kasprzyk-Obara J, Domanska-Pakiela D, et al. Clinical symptoms of tuberous sclerosis complex in patients with an identical TSC2 mutation. Med Sci Mon Int Med J Exp Clin Res 2005;11:CR230-4
- Neumann HP, Schwarzkopf G, Henske EP. Renal angiomyolipomas, cysts, and cancer in tuberous sclerosis complex. Sem Pediatr Neurol 1998;5:269-75
- Rodriguez JA, Evans RL, Daiger SP, et al. Molecular analysis of the human vitamin D binding protein (group specific component, Gc) in tuberous sclerosis complex (TSC). J Med Genet 1997;34:509-11
- Ruggieri M, Carbonara C, Magro G, et al. Tuberous sclerosis complex: neonatal deaths in three of four children of consanguineous, non-expressing parents. J Med Genet 1997;34:256-60
- Curatolo P. Neurological manifestations of tuberous sclerosis complex. ChNS Off J Int Soc Pediatr Neurosurg 1996;12:515-21
- Neumann HP, Bruggen V, Berger DP, et al. Tuberous sclerosis complex with end-stage renal failure. Nephrol Dial Transplant 1995;10:349-53
- Franz DN, Belousova E, Sparagana S, et al. Efficacy and safety of everolimus for subependymal giant cell astrocytomas associated with tuberous sclerosis complex (EXIST-1): a multicentre, randomised, placebo-controlled phase 3 trial. Lancet 2013;381:125-32
- Amin S, Carter M, Edwards RJ, et al. The outcome of surgical management of subependymal giant cell astrocytoma in tuberous sclerosis complex. EJPN Off J Eur Paediatr Neurol Soc 2013;17:36-44
- Berhouma M. Management of subependymal giant cell tumors in tuberous sclerosis complex: the neurosurgeon's perspective. World J Pediatr 2010;6:103-10
- Chan JA, Zhang H, Roberts PS, et al. Pathogenesis of tuberous sclerosis subependymal giant cell astrocytomas: biallelic inactivation of TSC1 or TSC2 leads to mTOR activation. J Neuropathol Exp Neurol 2004;63:1236-42
- Goh S, Butler W, Thiele EA. Subependymal giant cell tumors in tuberous sclerosis complex. Neurology 2004;63:1457-61
- Ozek MM, Ozek E, Pamir MN, et al. Subependymal giant cell astrocytomas in tuberous sclerosis. Turk J Pediatr A 1993;35:145-50
- Park KJ, Kano H, Kondziolka D, et al. Gamma Knife surgery for subependymal giant cell astrocytomas. Clinical article. J Neurosurg 2011;114:808-13
- Ekici MA, Kumandas S, Per H, et al. Surgical Timing of the Subependymal Giant Cell Astrocytoma (SEGA) with the Patients of Tuberous Sclerosis Complex. Turk Neurosurg 2011;21:315-24
- Pascual-Castroviejo I, Pascual-Pascual SI, Velazquez-Fragua R, et al. [Subependymal giant cell astrocytoma in tuberous sclerosis complex. A presentation of eight paediatric patients]. Neurologia 2010;25:314-21
- Cai R, Di X. Combined intra- and extra-endoscopic techniques for aggressive resection of subependymal giant cell astrocytomas. World Neurosurg 2010;73:713-18
- Bongiorni L, Arroyo HA, Lubienicki F. [Subependymal nodules-sudependymal giant cell astrocytoma complex in children with tuberous sclerosis]. Medicina (B Aires) 2009;69:8-14
- Phi JH, Park SH, Chae JH, et al. Congenital subependymal giant cell astrocytoma: clinical considerations and expression of radial glial cell markers in giant cells. ChNS Off J Int Soc Pediatr Neurosurg 2008;24:1499-503
- de Ribaupierre S, Dorfmuller G, Bulteau C, et al. Subependymal giant-cell astrocytomas in pediatric tuberous sclerosis disease: when should we operate? Neurosurgery 2007;60:83-9; discussion 89–90
- Sharma M, Ralte A, Arora R, et al. Subependymal giant cell astrocytoma: a clinicopathological study of 23 cases with special emphasis on proliferative markers and expression of p53 and retinoblastoma gene proteins. Pathology 2004;36:139-44
- Kim SK, Wang KC, Cho BK, et al. Biological behavior and tumorigenesis of subependymal giant cell astrocytomas. J Neurooncol 2001;52:217-25
- Levine NB, Collins J, Franz DN, et al. Gradual formation of an operative corridor by balloon dilation for resection of subependymal giant cell astrocytomas in children with tuberous sclerosis: specialized minimal access technique of balloon dilation. Minim Invasive Neurosurg 2006;49:317-20
- Severens JL, Milne RJ. Discounting health outcomes in economic evaluation: the ongoing debate. Value Health J Inte Soc Pharmacoecon Outcomes Res 2004;7:397-401