
Abstract
Objective:
To estimate cost per patient-year in response during 2 years following biologic initiation among patients with rheumatoid arthritis (RA).
Methods:
Adults newly initiating biologics for RA (etanercept, abatacept, adalimumab, certolizumab, golimumab, or infliximab) between January 2009 and July 2011 were identified in the MarketScan Commercial Database. Eligible patients were continuously enrolled 6 months before (pre-index) and 24 months after (post-index) their first (index) biologic claim. Biologic effectiveness was assessed using six criteria during 2-year follow-up: treatment adherence ≥80%, no biologic dose escalation, no biologic switch, no new disease-modifying anti-rheumatic drug, no new/increased glucocorticoid dose, and limited intra-articular joint injections (≤2). After a 90-day period of non-response for a treatment failure, effectiveness or failure of subsequent treatment was assessed again for the index biologic or new biologic (after switching). Post-index RA-related medical, pharmacy, and drug administration costs were attributed to the index biologic. Cost per patient-year in response was calculated as RA-related costs divided by duration of response.
Results:
Overall, 15.0% of patients (1229/8193) did not fail any criterion for 2 years and were effectively treated. Mean duration of response was highest for etanercept (538.3 days), followed by golimumab (537.0 days; p = 0.864), adalimumab (534.7 days; p = 0.301), certolizumab (524.0 days; p = 0.165), infliximab (480.0 days; p < 0.001), and abatacept (482.3 days; p < 0.001). Total disease-related cost per patient-year in response was lower for patients initiated on etanercept ($25,086) than for patients initiated on adalimumab ($25,960), certolizumab ($26,339), golimumab ($26,332), abatacept ($35,581), or infliximab ($36,107).
Limitations:
This study was limited to employer-paid commercial insurance. Database analyses cannot determine reasons for failing criteria. The algorithm was not designed and validated for 2 years of follow-up.
Conclusions:
An effectiveness algorithm estimated that initiating etanercept was the most effective treatment during 2 years of follow-up, with the lowest cost per patient-year in response.
Introduction
Approximately 1.3 million adults in the US are affected by rheumatoid arthritis (RA)Citation1. In 2010, the total annual societal costs of RA in the US were estimated to be $39.2 billion in 2005 dollars, including $8.4 billion in excess healthcare costs, $10.9 billion of other RA consequences (work loss, adaptations to home and work environments, lost productivity, informal and hired care/household help, and job turnover costs), and $19.9 billion of intangible costs due to reduced quality-of-life and premature mortalityCitation2. Thus, there is a clear need to identify RA treatments that are not only clinically effective but also cost-effective. The American College of Rheumatology (ACR) recommends the use of an anti-tumor necrosis factor (anti-TNF) biologic with or without methotrexate in patients who have early RA with high disease activity and poor prognostic featuresCitation3,Citation4. Per their product labels, abatacept, adalimumab, certolizumab, and etanercept can be used with or without methotrexateCitation5–8; golimumab and infliximab should only be used in combination with methotrexateCitation9,Citation10. The ACR guidelines also recommend adding or switching to an anti-TNF biologic or abatacept or rituximab in patients with established RA and moderate or high disease activity after 3 months of methotrexate monotherapy or disease-modifying anti-rheumatic drug (DMARD) combination therapyCitation3,Citation4.
Systematic reviews and meta-analyses of clinical studiesCitation11–14 have concluded that biologics generally have comparable efficacy in the treatment of RA. Long-term biologic therapy in RA may have continued benefits, including the inhibition of structural damage over timeCitation15–19. Over time, formation of neutralizing antibodies to adalimumab and infliximab may lead to loss of clinical response with these biologics in RACitation20,Citation21. Long-term safetyCitation22 and rates of treatment persistenceCitation23 may also differ between biologics. Neutralizing antibodies have not been seen with etanercept.
Although many prospective studies of biologic efficacy in RA have been conducted, only a handful have directly compared two or more biologicsCitation24. Due to the inherent challenges and costs associated with large, long-term, prospective comparative studies, most of the studies that compared biologic efficacy in RA were restricted to the evaluation of only two or three biologics in a few hundred patients over a period of 1 year or lessCitation25–29. To our knowledge, the largest and longest prospective, comparative study of biologic treatment for RA used a registry of more than 2000 patients and examined clinical effectiveness over 24 months, but only three biologics (adalimumab, etanercept, or infliximab) were included in the comparisonCitation30. In that study, no differences in rates of drug response or remission were observed among the three biologicsCitation30.
Retrospective claims database analyses can be used to compare all of the available treatments, and many previous analyses of claims data have compared biologic therapy based on cost, treatment persistence, or dosing patterns in clinical practiceCitation31–45. However, effectiveness of biologic treatment is not recorded directly in claims databases. Thus, an effectiveness algorithm was developed and validated in a Veteran’s Administration databaseCitation46 and was further evaluated in commercially insured patientsCitation47 to examine biologic effectiveness from commercial claims. The algorithm categorizes a biologic as effective if the patient satisfies six criteria throughout the follow-up period. Each criterion can be determined from pharmacy and medical claims; they include assessments of adhering to the index biologic (i.e., the initial biologic treatment), using glucocorticoids and DMARDs, increasing the biologic dose, or switching to another biologic. An additional advantage of using the effectiveness algorithm is that costs can be determined directly from the claims database, so it is possible to evaluate both costs and effectiveness in the same patients.
Recent claims-based analyses using that algorithm have suggested there may be some differences in effectiveness in clinical practiceCitation48,Citation49. However, a common limitation of those analyses was that they only looked at effectiveness of the initial biologic regimen and did not consider effectiveness of the index biologic after an initial treatment failure.
The goal of this retrospective observational cohort study was to describe the cost per patient-year in response among patients initiating an RA biologic agent. In doing so, this study estimated effectiveness according to the algorithm, total duration of response, total healthcare costs, RA-related healthcare costs, and costs (medication costs and RA-related costs) per patient-year in response. This study builds on the previous work by considering effectiveness during 2 years of follow-up and effectiveness of subsequent treatment after algorithm failure events.
Patients and methods
Patient selection criteria
Data were analyzed from the Truven Health Analytics MarketScan Commercial Claims and Encounters Databases from July 1, 2008 through June 30, 2013. The index event was the first claim for a biologic approved for first-line RA treatment (etanercept, abatacept, adalimumab, certolizumab, golimumab, or infliximab) during the patient selection window between January 1, 2009 and July 1, 2011. Patients were required to be adults aged ≥18 to <63 years as of the index date and have at least one diagnosis of RA (ICD-9-CM 714.0x) in any position on medical claims during the 180 days before and including the study index date (‘pre-index’). Patients were required to be continuously enrolled in a health plan with medical and pharmacy benefits both pre-index and the 2 years (730 days) following the index date (‘post-index’).
Patients were excluded from the analysis if they received any of the biologics studied (etanercept, abatacept, adalimumab, certolizumab pegol, golimumab, or infliximab) pre-index (not including the index date) or they received any biologic indicated only for second-line treatment of RA (tocilizumab, rituximab, anakinra) pre-index (including the index date). Patients with a claim for more than one biologic on the index date or a claim for ustekinumab at any time during the study period were excluded from the analysis. Patients could not have a claim for a biologic for RA before its FDA approval date for first-line treatment of RA: certolizumab before May 2009, golimumab before April 2009, or tocilizumab before January 2010. Patients were excluded if they had a Healthcare Common Procedure Coding System (HCPCS) Level II J-Code claim for a biologic administered via subcutaneous (SC) injection (etanercept, adalimumab, certolizumab, and golimumab), suggesting an in-office administration or a National Drug Code (NDC) for a biologic administered via intravenous (IV) infusion (abatacept or infliximab) at any time during the study period. Patients were also excluded if they had any of the following diagnoses pre-index (including the index date) for other non-RA conditions that any of the biologics are used to treat:
Plaque psoriasis: ICD-9-CM 696.1x;
Psoriatic arthritis: ICD-9-CM 696.0x;
Ankylosing spondylitis: ICD-9-CM 720.0x;
Juvenile idiopathic arthritis: ICD-9-CM 714.3x;
Crohn’s disease: ICD-9-CM 555.xx;
Ulcerative colitis: ICD-9-CM 556.xx;
Non-Hodgkin’s lymphoma: ICD-9-CM 200.xx, 202.xx; and
Chronic lymphocytic leukemia: ICD-9-CM 204.1x.
Application of the effectiveness algorithm
The original biologic effectiveness algorithm was developed and validated in a Veteran’s Administration database during 1 year of follow-upCitation46. This analysis applied the algorithm to 2 years of follow-up and allowed patients to fail the algorithm multiple times (i.e., patients could have multiple failure events within or across the failure criteria). For patients who failed a criterion, each algorithm failure event was assigned a 90-day non-response period. Subsequent failures during an ongoing non-response period reset the 90-day non-response period without appending the non-response time (i.e., 90-day non-response periods could overlap for subsequent failures). A non-response period could not extend beyond the end of the 730-day post-index period; thus, if an algorithm failure event occurred after day 640, the non-response period for that failure ended on day 730. For each patient, the duration of response was calculated as the total duration of follow-up minus the sum of the durations of the non-response periods. Sensitivity analysis was conducted, varying the non-response penalty from 90 days to 30 days or 180 days attributed to each failure event.
The index biologic was considered to be effective for the entire study period if all six of the following criteria were achieved throughout the 730-day post-index period.
Criterion 1 (adherence)
Adherence was based on a medication possession ratio (MPR) of ≥80% post-index. The MPR was calculated as the total days’ supply for the SC biologics or total duration of benefit based on the longest recommended treatment interval in the US prescribing information for the IV biologics (28 days for each abatacept claimCitation7, 56 days for each infliximab claimCitation9), divided by the total follow-up days. If a patient refilled an SC biologic before the previous supply ran out, days' supply was extended for up to 14 days (allowing for 14 days of overlap). There was no extension of benefit duration given to the IV agents (i.e., the duration of clinical benefit was not appended to account for early administration of the product). The date of treatment failure was assigned as the date on which the MPR could not remain above the 80% threshold (e.g., missed 73 days of therapy within a 1-year period). Cumulative gap days were calculated as the sum of the number of days' between the end of days supply (or duration of benefit) of one claim before the start of the next.
For the analysis of multiple algorithm failures, when a patient reached the gap of 73 days the gap counter was reset starting from the restart date for the index drug. The date of each treatment failure was assigned as the date where each cumulative gap of 73 days was reached. If the patient had too few infusions, the date of treatment failure was assigned as the date of the last claim for an IV biologic plus its estimated duration of benefit (28 days for abatacept, 56 days for infliximab).
Criterion 2 (no increase in biologic dose)
The first increase in biologic dose for an SC biologic was measured by calculating a daily dose (strength multiplied by quantity, divided by days' supply) for every claim for the index drug over 2 years and comparing that value to the daily dose of the index claim. If a subsequent claim had a daily dose that was >10% greater than that of the index claim, the patient was flagged as having increased dose. The first date of treatment failure due to index biologic dose increase was set as the date of the claim that had a daily dose >10% greater than that of the index claim. If a patient had at least one SC biologic dose increase then the new dose became the baseline to which all subsequent dose increases were assessed. The date of each subsequent dose increase was set as the date of the claim that met the 10% threshold. Each patient could fail the dose increase criterion up to 10 times. If days' supply for an SC biologic was missing or invalid it was imputed using the estimated duration of benefit of each dose supplied, which was 7 days for etanercept, 14 days for adalimumab and certolizumab, and 28 days for golimumab.
For IV biologics, if the number of claims exceeded the upper bound of the permissible dosing schedule (36 infusions for abatacept and 20 infusions for infliximab) then the patient was flagged as having a dose increase. The date of treatment failure due to index biologic dose increase was the date of the infusion that exceeded the upper bound of the permissible dosing schedule. IV biologic dose escalation was also assessed using the paid amount on IV biologic, defined as a paid amount of >10% greater than at baseline. If a patient had at least one IV biologic dose increase then the new dose became the baseline to which all subsequent dose increases were assessed. Up to 10 IV biologic dose increases were measured for each patient.
Criterion 3 (no biologic switch)
A switch was flagged each time a patient had a claim for a biologic post-index that was different from the index biologic. The date of each treatment failure due to switch was defined as the date of the claim for each switched drug. The biologics that were used to determine a switch in therapy included either allowed index biologics (etanercept, abatacept, adalimumab, certolizumab, golimumab, or infliximab) or second-line biologics (tocilizumab, rituximab or anakinra). If a patient switched to another one of the index biologics then treatment effectiveness of the new drug was evaluated and the switch date was reset as a new start date to implement the algorithm. Treatment effectiveness for the new biologic was captured for the first switch and the second switch. Follow-up ended if the patient switched a third time because less than 3% of the population switched more than twice and there was too little follow-up time after the third switch for evaluation. If a patient switched to tocilizumab, rituximab, or anakinra then follow-up ended and there was no further evaluation because these were not included in the list of allowed index biologics.
Criterion 4 (no new DMARD)
Patients were flagged as initiating or having added a DMARD if they had a claim for leflunomide, methotrexate, sulfasalazine, or hydroxychloroquine after the first 90 days of follow-up that they did not have pre-index through the first 90 days of follow-up. The date of each treatment failure due to adding or initiating a DMARD was defined as the date of the first claim for each new DMARD. Each DMARD addition or initiation was captured in the analytic file and a patient could fail up to four times (once for each of the four DMARDs).
Criterion 5 (no new/increased oral glucocorticoid)
If patients had no prescriptions for an oral glucocorticoid pre-index they were flagged as adding or initiating an oral glucocorticoid if they had >30 days of cumulative oral glucocorticoid use between day 91 and the end of follow-up (730 days). The first date of treatment failure due to adding or initiating an oral glucocorticoid was defined as the date where 30 days’ supply was first reached. Subsequent failures for adding or initiating an oral glucocorticoid were flagged if a patient had more than 60, 90, and 120 days of cumulative oral glucocorticoid use during the remainder of the follow-up period. A patient could fail a maximum of four times for this event. Oral glucocorticoids included in this analysis were cortisone, hydrocortisone, prednisone, prednisolone, triamcinolone, methylprednisolone, dexamethasone, and betamethasone.
Dose increase of oral glucocorticoid was measured in patients that had any claim for an oral glucocorticoid pre-index. Dose increase was defined by capturing the cumulative dose of all glucocorticoid claims pre-index and comparing it to the last 6 months of the first year, the first 6 months of the second year, and the last 6 months of the second year. A dose increase was flagged if the cumulative dose of any of the three 6-month periods was ≥120% of the cumulative dose pre-index. The date of treatment failure due to dose increase of an oral glucocorticoid was the date of the claim where the patient reached the 120% threshold. A patient could fail a maximum of three times for this event. Cumulative dose was captured as the sum of total milligrams per claim (strength multiplied by quantity) for every glucocorticoid claim using a prednisone dose equivalent.
Criterion 6 (intra-articular joint injections)
If patients had >1 procedure code for a joint injection (on different days) between day 91 and the end of 1 year, or >2 procedure codes for joint injections between day 91 and the end of 2 years, they were flagged as failing for having excessive joint injections. The date of the second (or third) code for a joint injection was the date attributed to the first treatment failure. Subsequent joint injection failure events were flagged for the date of every joint injection that occurred after the date of the first failure. Up to 10 failures for joint injections were allowed for each patient.
Statistical methods
Continuous measures were presented as means and standard deviations. Categorical measures were presented as counts and percentages. Data were stratified by index biologic and were also combined for all patients in the analysis.
Analyses of demographic and clinical characteristics were as follows: on the index date: age, sex, geographic region of residence and index year; pre-index not including the index date: Deyo-Charlson Comorbidity Index (DCI)Citation50,Citation51, prior DMARD use, and prior oral glucocorticoid use; during the first 90 days post-index including the index date: concomitant DMARD use and concomitant oral glucocorticoid use.
Descriptive analyses for the overall population and each index biologic included the number and percentage of effectively treated patients according to the algorithm (i.e., patients who satisfied all of the criteria throughout the 730 days post-index), the total number of algorithm failures per patient, the time to first algorithm failure, and the duration of response.
All post-index costs were assigned to the index biologic. Total healthcare costs were calculated as the costs of all medical and pharmacy claims post-index. Total RA-related costs were calculated as the costs of all non-diagnostic medical and pharmacy claims with an ICD-9-CM code of 714.0x in the primary position on the claim. RA-related medical treatment costs consisted of all HCPCS code claims for biologics and DMARDs. RA-related pharmacy treatment costs consisted of all NDC code pharmacy claims for biologics and for DMARDs. Cost per patient-year in response for each index biologic was calculated as the total cost divided by the response duration at the index cohort level. Bootstrapping (1000 replications per cohort) was used to estimate the 95% confidence intervals. Bootstrapping was also used to calculate the 95% confidence interval around the incremental difference compared to etanercept. All costs were adjusted to January 2013 dollars based on the medical care component of the Consumer Price Index (CPI). Continuous outcomes were assessed using a series of t-tests for each index agent compared with etanercept.
Results
Index biologic
A total of 8193 patients met the study selection criteria (). Etanercept (n = 3532; 42%) was the most frequently used index biologic, followed by adalimumab (n = 2595; 32%), infliximab (n = 989; 12%), abatacept (n = 553; 7%), golimumab (n = 340; 4%), and certolizumab (n = 184; 2%) ().
Table 1. Patient selection and attrition reasons.
Table 2. Demographics.
Demographics and clinical characteristics
Patient demographics are provided in . The mean age of patients was 49.0 (SD = 9.6) years and most patients (78.2%) were female. Patient age and gender were comparable across index biologics. Nearly half of the patient population (48.8%) initiated biologic treatment in 2009.
Clinical characteristics are provided in . The mean DCI score for comorbidity pre-index was 1.3 (SD = 0.7) overall and was comparable across index biologics. A majority of patients had a pre-index claim for a DMARD (63.3% methotrexate, 23.7% hydroxychloroquine, 12.4% leflunomide, 8.2% sulfasalazine) and the rates of concomitant use (first 90 days of follow-up) were similar to the pre-index rates of DMARD use. More than half (57.5%) of the patients used an oral glucocorticoid pre-index and slightly more than one third (36.5%) received a glucocorticoid during the first 90 days of follow-up. As shown in , pre-index use of a DMARD and pre-index use of any oral glucocorticoid (range = 55.8–59.1%) were substantively similar across index biologics.
Table 3. Clinical characteristics.
Effectiveness over 2 years of follow-up
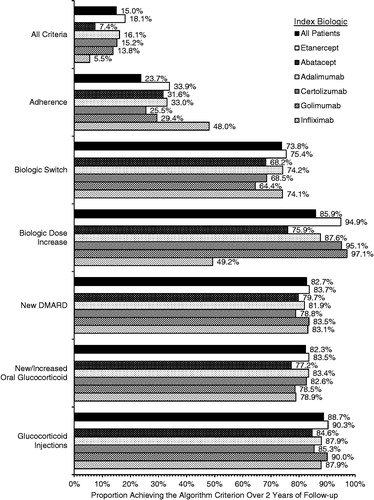
Overall, 15.0% of patients satisfied all of the criteria for effectiveness over the full 2 years of follow-up (), ranging from 5.5% (patients initiated on infliximab) to 18.1% (patients initiated on etanercept). High adherence was the least commonly achieved criterion (23.7% overall), ranging from 25.5% (patients initiated on certolizumab) to 48.0% (patients initiated on infliximab); all other criteria were achieved by 73.8% (biologic switch) to 99.2% (addition or initiation of an oral glucocorticoid) of patients overall. The proportion of patients achieving each individual criterion was comparable across index biologics, except for the rates of no increase in biologic dose, which ranged from 87.6–97.1% for patients initiated on the SC biologics, compared with 49.2% for patients initiated on infliximab and 75.9% for patients initiated on abatacept.
Figure 1. Treatment effectiveness over 2 years of follow-up.
Treatment failure events and response duration are summarized in . The percentage of patients that had any treatment failure event (with p-value relative to etanercept) was lowest for patients initiated on etanercept (81.9%), followed by patients initiated on adalimumab (83.9%; p = 0.044), certolizumab (84.8%; p = 0.317), golimumab (86.2%; p = 0.048), abatacept (92.6%; p < 0.001), and infliximab (94.5%; p < 0.001). The mean number of failure events overall (with p-value relative to etanercept) was lowest for patients initiated on etanercept (2.95 events), followed by patients initiated on golimumab (3.04 events; p = 0.483), adalimumab (3.06 events; p = 0.070), certolizumab (3.33 events; p = 0.030), infliximab (4.20 events; p < 0.001), and abatacept (4.35 events; p < 0.001). The rank order was similar in a sensitivity analysis that determined the mean number of failure events among patients with at least one treatment failure. The mean duration of response was 526 days (SD = 137) overall. Mean duration of response (with p-value relative to etanercept) was highest for patients initiated on etanercept (538.3 days), followed by patients initiated on golimumab (537.0 days; p = 0.864), adalimumab (534.7 days; p = 0.301), certolizumab (524.0 days; p = 0.165), infliximab (480.0 days; p < 0.001), and abatacept (482.3 days; p < 0.001).
Table 4. Treatment failures and response duration.
As expected, the overall duration of response was higher in the sensitivity analysis that used a 30-day window for non-response (mean = 642.9 days, SD = 60.9 days) and lower in the sensitivity analysis that used a 180-day window for non-response (mean = 425.0 days, SD = 196.5 days). However, etanercept continued to have the highest mean value for duration of response in each sensitivity analysis and the rank orders for the other agents were similar to the analysis with a 90-day window for non-response.
Healthcare costs over 2 years of follow-up
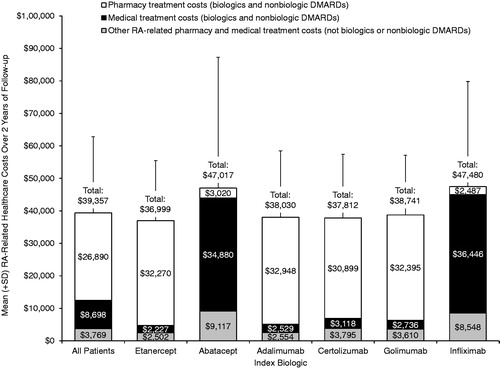
Average total RA-related costs over 2 years were $39,357 overall (). The lowest total RA-related healthcare costs were observed for patients initiated on etanercept ($36,999), followed by patients initiated on certolizumab ($37,812), adalimumab ($38,030), golimumab ($38,741), abatacept ($47,017), and infliximab ($47,480). Total RA-related costs were driven primarily by costs of biologics and DMARDs, which were $35,588 for the pharmacy treatment costs and medical treatment costs combined. The RA-related pharmacy treatment costs predominated for patients initiated on SC biologics (range = $30,889–$32,948) and the RA-related medical treatment costs predominated for the patients initiated on IV biologics (range = $34,880–$36,446).
Figure 2. Mean (+SD) RA-related healthcare costs over 2 years of follow-up. Includes medical and pharmacy claims with a primary diagnosis of RA (ICD 714.0x).
Average total healthcare costs over 2 years were $64,697 overall. The lowest total healthcare costs were observed for patients initiated on etanercept ($60,222), followed by patients initiated on adalimumab ($62,299), golimumab ($66,055), certolizumab ($67,709), infliximab ($75,973), and abatacept ($82,529).
Biologic costs over 2 years of follow-up
The cost of the index biologic was the major contributor to biologic costs over 2 years of follow-up, but non-index biologics (i.e., biologics that were used after a patient switched) contributed >$5000 to the total biologic costs for each index biologic (). The total costs of non-index biologic treatment that were attributed to the index biologic were as follows (by index biologic): infliximab, $5626; adalimumab, $5915; etanercept, $5941; certolizumab, $7824; golimumab, $7943; and abatacept, $8189.
Table 5. Mean (±SD) biologic costs over 2 years of follow-up.
Average cost per patient-year in response
presents the average medication cost per patient-year in response, and the average disease-related cost per patient-year in response.
Figure 3. Average (+95% CI) cost per patient-year in response by index biologic. *p < 0.05 vs etanercept.
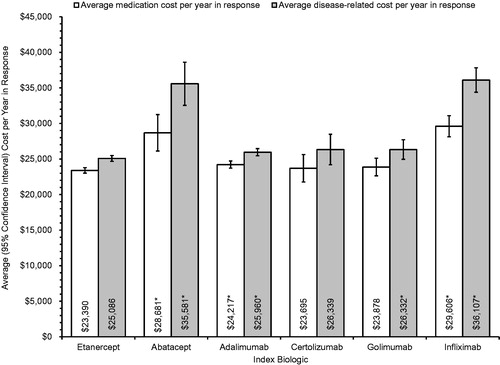
Patients initiated on etanercept had the lowest average medication cost per patient-year in response ($23,390; 95% CI = $23,030–$23,773); patients initiated on abatacept ($28,681; 95% CI = $26,560–$31,245; p < 0.05), adalimumab ($24,217; 95% CI = $23,688–$24,715; p < 0.05), and infliximab ($29,606; 95% CI = $28,110–$31,101; p < 0.05) had significantly higher average medication costs. Patients initiated on certolizumab ($23,695; 95% CI = $21,944–$25,630; p > 0.05) and golimumab ($23,878; 95% CI = $22,701–$25,112; p > 0.05) also had higher costs, but the differences from patients initiated on etanercept were not statistically significant, possibly due to the smaller sample sizes for these biologics.
Patients initiated on etanercept also had the lowest disease-related cost per patient-year in response ($25,086; 95% CI = $24,690–$25,493); patients initiated on abatacept ($35,581; 95% CI = $33,084–$38,611; p < 0.05), adalimumab ($25,960; 95% CI = $25,404–$26,459; p < 0.05), golimumab ($26,332; 95% CI = $25,002–$27,711; p < 0.05), and infliximab ($36,107; 95% CI = $34,415–$37,825; p < 0.05) had significantly higher disease-related cost per patient-year in response. Patients initiated on certolizumab had higher disease-related cost per patient-year in response ($26,339; 95% CI = $24,421–$28,482; p > 0.05), but the difference from patients initiated on etanercept was not statistically significant, possibly due to the smaller sample size for patients initiated on certolizumab.
Discussion
In this analysis, etanercept was the most frequently used biologic for the treatment of RA and it had the highest effectiveness in terms of treatment failure events and response duration during 2 years of follow-up according to a claims-based algorithm. Overall, only 15.0% of all patients were categorized as effectively treated with the index biologic throughout 2 years of follow-up and the rates ranged from 5.5% (infliximab) to 18.1% (etanercept). Patients initiated on etanercept had the lowest total healthcare costs and lowest total RA-related costs. Costs (medications or RA-related) per patient-year in response according to the algorithm were significantly lower for patients initiated on etanercept than for patients initiated on most of the other biologics. Certolizumab had higher costs per patient-year in response than etanercept, but neither of the differences was statistically significant, possibly because the number of responses to certolizumab according to the algorithm was small (n = 28) and the confidence intervals were large (±$1751 for medication costs and ±$2143 for disease-related costs).
Reasons why a patient failed an algorithm criterion and clinical measures of response are not available in a claims database. Despite these potential limitations, the original algorithm was validated against clinician-reported outcomes in a previous studyCitation46, and a separate comparison of the algorithm to clinician review of medical records demonstrated that the positive predictive value with the algorithm was 85% or greater for the three biologics in that analysis (etanercept, adalimumab, and infliximab)Citation47. Previous studies reported higher rates of effectiveness over 1 year according to the algorithm, including ∼20% for infliximab and 30% for other biologicsCitation48,Citation49. Lower rates of effectiveness overall in this study were expected because the algorithm was applied to 2 full years of treatment instead of 1 year.
In each of the previous studies that used the RA effectiveness algorithmCitation48,Citation49 to examine clinical effectiveness and costs from commercial claims, biologic cost per effectively treated patient, as defined in the algorithm, was lowest for etanercept. Thus, the findings of this study were consistent with those of previous analyses, but a few key distinctions should be noted. The previous studies only examined the cost of the index biologic without including other RA-related costs (such as non-biologic medication costs or RA-related medical costs). One of the previous studies only included effectiveness and costs during the first year, and each of the studies considered a patient to have failed a biologic therapy permanently after the first criterion failure. To our knowledge, this was the first study to estimate duration of response from the effectiveness algorithm. After patients failed one of the algorithm criteria, they were assigned a 90-day non-response period and they could experience multiple failures (including multiple failures of the same criterion) during the 2-year follow-up period. This approach made it possible to estimate the total duration of response for each patient; thus, the cost per patient-year in response could be determined to measure cost-effectiveness.
Using this approach, the mean number of treatment failures during 2 years of treatment was 3.24 overall, ranging from <3 treatment failures for etanercept to >4 treatment failures for each of the intravenously administered biologics. The mean duration of response, after removing 90 days for each treatment failure, was 526 days overall, or ∼1.4 years of treatment response overall during a 2-year period. These findings suggest that, although most patients fail the effectiveness algorithm at least once by increasing the dose of the biologic, switching to another biologic, and/or adding or increasing concomitant therapy with a DMARD or glucocorticoid, these treatment modifications may enable patients to achieve durable treatment responses thereafter.
Before initiating treatment with an index biologic, patients may have differed in important ways that could not be identified or measured in the data source; however, the analysis was not intended to differentiate baseline disease severity across index biologics. In a recent study that also applied this algorithm to a commercial claims databaseCitation52, available baseline data such as patient age, region, baseline DMARD use, and baseline healthcare cost were each statistically significantly associated with effectiveness, but the inclusion of these (and other) baseline variables in a multivariable analysis resulted in predicted rates of effectiveness that were comparable to the observed rates that did not adjust for baseline differences.
This study was limited to individuals with employer-paid commercial insurance and their dependents; the results may not be generalizable to other patient populations (e.g., Medicare, Veterans Health Administration, state Medicaid) or populations without health insurance. It was not possible to apply the adherence criterion to a pharmacy claim for an IV biologic (because it did not include an administration date) or to a medical claim for an SC biologic (because it did not provide days’ supply), and, thus, patients were excluded from the analysis if they had either of these claims. However, the total RA-related healthcare costs of SC biologics included ∼$2000–$3000 for medical treatment costs and those for the IV biologics included ∼$2500–$3000 for pharmacy treatment costs; these costs resulted from attributing the cost of other biologics and DMARDs to the total cost of the index biologic. Overall, non-index biologic treatment (both SC and IV combined) contributed >$5000 to the total biologic costs for each index biologic. Since the total RA-related pharmacy and medical treatment costs were ∼$35,000 overall, the contribution of indirect costs for other biologic and DMARD treatments was substantial and it was important to include these costs in the total costs. The cost analyses did not include costs of medications for which a claim was not submitted, such as over-the-counter medications, medication samples, or other free products. Certolizumab and golimumab each comprised less than 5% of the index biologic use in this study, but they were not approved for first-line use in the US until May and April 2009, respectively, and nearly half of the study population initiated biologic treatment in 2009. Likewise, the study period for this analysis precluded the use of subcutaneous abatacept; as a result, caution should be exercised when interpreting the results for abatacept, particularly regarding adherence. The original algorithm was validated using a registry database that included physician assessments of treatment response during 1 year of follow-up using the gold standard for effectiveness, a Disease Activity Score using 28 joint counts (DAS28) ≤3.2 units or improvement in DAS28 >1.2 unitsCitation46. The validation of the algorithm included neither application of the criteria to 2 years of follow-up nor estimation of the duration of response by evaluating effectiveness after a 90-day period of non-response for each failure event.
Conclusions
In this analysis of a national commercial database including ∼30 million covered lives annually, initiation of etanercept was estimated to be the most cost effective, with the lowest RA-related cost per patient-year in response among biologics approved for first-line treatment of RA in the US. This analysis built upon previous research in the area by including all RA-related costs rather than just the biologic costs. Further, it used a dynamic approach to assess treatment effectiveness whereby a single patient could have multiple failure events within the six failure criteria and then achieve subsequent effectiveness after a 90-day non-response period for each treatment failure. Using this approach provided an estimate of cost per patient-year in response for each index biologic that is likely to be broadly generalizable to commercially insured patients in the US.
Transparency
Declaration of funding
This work was funded by Immunex Corporation, a wholly owned subsidiary of Amgen Inc., and by Wyeth, which was acquired by Pfizer Inc. in October 2009.
Declaration of financial/other relationships
MB, BHJ, and NP are employees of Truven Health Analytics, which received financial support from Amgen Inc. to conduct the analyses. NS and DJH are employees and stockholders of Amgen Inc.
Acknowledgments
Jonathan Latham of PharmaScribe, LLC (whose work was funded by Amgen Inc.) and Dikran Toroser of Amgen Inc. provided assistance with the drafting and submission of the manuscript. Portions of this work were presented at the 2014 meeting of the International Society For Pharmacoeconomics and Outcomes Research (ISPOR) and the 2014 meeting of the European League Against Rheumatism (EULAR).
References
- Helmick CG, Felson DT, Lawrence RC, et al. Estimates of the prevalence of arthritis and other rheumatic conditions in the United States. Part I. Arthritis Rheum 2008;58:15-25
- Birnbaum H, Pike C, Kaufman R, et al. Societal cost of rheumatoid arthritis patients in the US. Curr Med Res Opin 2010;26:77-90
- Saag KG, Teng GG, Patkar NM, et al. American College of Rheumatology 2008 recommendations for the use of nonbiologic and biologic disease-modifying antirheumatic drugs in rheumatoid arthritis. Arthritis Rheum 2008;59:762-84
- Singh JA, Furst DE, Bharat A, et al. 2012 update of the 2008 American College of Rheumatology recommendations for the use of disease-modifying antirheumatic drugs and biologic agents in the treatment of rheumatoid arthritis. Arthritis Care Res (Hoboken) 2012;64:625-39
- Enbrel® (etanercept) Prescribing Information. Thousand Oaks, CA: Immunex Corporation; 2013
- Humira® (adalimumab) Prescribing Information. North Chicago, IL: Abbott Laboratories; 2014
- ORENCIA® (abatacept) Prescribing Information. Princeton, NJ: Bristol-Myers Squibb Company; 2014
- CIMZIA® (certolizumab pegol) Prescribing Information. Smyrna, GA: UCB, Inc.; 2013
- Remicade® (infliximab) Prescribing Information. Malvern, PA: Centocor Ortho Biotech, Inc.; 2013
- SIMPONI® (golimumab) Prescribing Information. Horsham, PA: Janssen Biotech, Inc.; 2014
- Kristensen LE, Christensen R, Bliddal H, et al. The number needed to treat for adalimumab, etanercept, and infliximab based on ACR50 response in three randomized controlled trials on established rheumatoid arthritis: a systematic literature review. Scand J Rheumatol 2007;36:411-17
- Donahue KE, Gartlehner G, Jonas DE, et al. Systematic review: comparative effectiveness and harms of disease-modifying medications for rheumatoid arthritis. Ann Intern Med 2008;148:124-34
- Alonso-Ruiz A, Pijoan JI, Ansuategui E, et al. Tumor necrosis factor alpha drugs in rheumatoid arthritis: systematic review and metaanalysis of efficacy and safety. BMC Musculoskelet Disord 2008;9:52
- Singh JA, Christensen R, Wells GA, et al. A network meta-analysis of randomized controlled trials of biologics for rheumatoid arthritis: a Cochrane overview. CMAJ 2009;181:787-96
- Morgan CL, Emery P, Porter D, et al. Treatment of rheumatoid arthritis with etanercept with reference to disease-modifying anti-rheumatic drugs: long-term safety and survival using prospective, observational data. Rheumatology (Oxford) 2014;53:186-94
- Keystone E, Landewe R, van Vollenhoven R, et al. Long-term safety and efficacy of certolizumab pegol in combination with methotrexate in the treatment of rheumatoid arthritis: 5-year results from the RAPID 1 trial and open-label extension. Ann Rheum Dis 2014;73:2094-100
- Burmester GR, Matucci-Cerinic M, Mariette X, et al. Safety and effectiveness of adalimumab in patients with rheumatoid arthritis over 5 years of therapy in a phase 3b and subsequent postmarketing observational study. Arthritis Res Ther 2014;16:R24
- Nash P, Nayiager S, Genovese MC, et al. Immunogenicity, safety, and efficacy of abatacept administered subcutaneously with or without background methotrexate in patients with rheumatoid arthritis: results from a phase III, international, multicenter, parallel-arm, open-label study. Arthritis Care Res (Hoboken) 2013;65:718-28
- Buch MH, Bingham SJ, Bryer D, et al. Long-term infliximab treatment in rheumatoid arthritis: subsequent outcome of initial responders. Rheumatology (Oxford) 2007;46:1153-6
- Krieckaert CL, Jamnitski A, Nurmohamed MT, et al. Comparison of long-term clinical outcome with etanercept treatment and adalimumab treatment of rheumatoid arthritis with respect to immunogenicity. Arthritis Rheum 2012;64:3850-5
- Pascual-Salcedo D, Plasencia C, Ramiro S, et al. Influence of immunogenicity on the efficacy of long-term treatment with infliximab in rheumatoid arthritis. Rheumatology (Oxford) 2011;50:1445-52
- Atzeni F, Sarzi-Puttini P, Botsios C, et al. Long-term anti-TNF therapy and the risk of serious infections in a cohort of patients with rheumatoid arthritis: comparison of adalimumab, etanercept and infliximab in the GISEA registry. Autoimmun Rev 2012;12:225-9
- Sakai R, Tanaka M, Nanki T, et al. Drug retention rates and relevant risk factors for drug discontinuation due to adverse events in rheumatoid arthritis patients receiving anticytokine therapy with different target molecules. Ann Rheum Dis 2012;71:1820-6
- Estellat C, Ravaud P. Lack of head-to-head trials and fair control arms: randomized controlled trials of biologic treatment for rheumatoid arthritis. Arch Intern Med 2012;172:237-44
- Schiff M, Keiserman M, Codding C, et al. Efficacy and safety of abatacept or infliximab vs placebo in ATTEST: a phase III, multi-centre, randomised, double-blind, placebo-controlled study in patients with rheumatoid arthritis and an inadequate response to methotrexate. Ann Rheum Dis 2008;67:1096-103
- Weinblatt ME, Schiff M, Valente R, et al. Head-to-head comparison of subcutaneous abatacept versus adalimumab for rheumatoid arthritis: findings of a phase IIIb, multinational, prospective, randomized study. Arthritis Rheum 2013;65:28-38
- Kume K, Amano K, Yamada S, et al. Tocilizumab monotherapy reduces arterial stiffness as effectively as etanercept or adalimumab monotherapy in rheumatoid arthritis: an open-label randomized controlled trial. J Rheumatol 2011;38:2169-71
- van Vollenhoven RF, Fleischmann R, Cohen S, et al. Tofacitinib or adalimumab versus placebo in rheumatoid arthritis. N Engl J Med 2012;367:508-19
- Gabay C, Emery P, van Vollenhoven R, et al. Tocilizumab monotherapy versus adalimumab monotherapy for treatment of rheumatoid arthritis (ADACTA): a randomised, double-blind, controlled phase 4 trial. Lancet 2013;381:1541-50
- Greenberg JD, Reed G, Decktor D, et al. A comparative effectiveness study of adalimumab, etanercept and infliximab in biologically naive and switched rheumatoid arthritis patients: results from the US CORRONA registry. Ann Rheum Dis 2012;71:1134-42
- Bullano MF, McNeeley BJ, Yu YF, et al. Comparison of costs associated with the use of etanercept, infliximab, and adalimumab for the treatment of rheumatoid arthritis. Manag Care Interface 2006;19:47-53
- Etemad L, Yu EB, Wanke LA. Dose adjustment over time of etanercept and infliximab in patients with rheumatoid arthritis. Manag Care Interface 2005;18:21-7
- Gilbert TD Jr., Smith D, Ollendorf DA. Patterns of use, dosing, and economic impact of biologic agent use in patients with rheumatoid arthritis: a retrospective cohort study. BMC Musculoskelet Disord 2004;5:36
- Ollendorf DA, Klingman D, Hazard E, et al. Differences in annual medication costs and rates of dosage increase between tumor necrosis factor-antagonist therapies for rheumatoid arthritis in a managed care population. Clin Ther 2009;31:825-35
- Carter CT, Changolkar AK, Scott McKenzie R. Adalimumab, etanercept, and infliximab utilization patterns and drug costs among rheumatoid arthritis patients. J Med Econ 2012;15:332-9
- Harrison DJ, Huang X, Globe D. Dosing patterns and costs of tumor necrosis factor inhibitor use for rheumatoid arthritis. Am J Health Syst Pharm 2010;67:1281-7
- Tang B, Rahman M, Waters HC, et al. Treatment persistence with adalimumab, etanercept, or infliximab in combination with methotrexate and the effects on health care costs in patients with rheumatoid arthritis. Clin Ther 2008;30:1375-84
- Wu E, Chen L, Birnbaum H, et al. Cost of care for patients with rheumatoid arthritis receiving TNF-antagonist therapy using claims data. Curr Med Res Opin 2007;23:1749-59
- Weycker D, Yu EB, Woolley JM, et al. Retrospective study of the costs of care during the first year of therapy with etanercept or infliximab among patients aged > or = 65 years with rheumatoid arthritis. Clin Ther 2005;27:646-56
- Bonafede MM, Gandra SR, Watson C, et al. Cost per treated patient for etanercept, adalimumab, and infliximab across adult indications: a claims analysis. Adv Ther 2012;29:234-48
- Schabert VF, Watson C, Gandra SR, et al. Annual costs of tumor necrosis factor inhibitors using real-world data in a commercially insured population in the United States. J Med Econ 2012;15:264-75
- Zeidler J, Mittendorf T, Müller R, et al. Biologic TNF inhibiting agents for treatment of inflammatory rheumatic diseases: dosing patterns and related costs in Switzerland from a payers perspective. Health Econ Rev 2012;2:20
- Schabert VF, Bruce B, Ferrufino CF, et al. Disability outcomes and dose escalation with etanercept, adalimumab, and infliximab in rheumatoid arthritis patients: a US-based retrospective comparative effectiveness study. Curr Med Res Opin 2012;28:569-80
- Bonafede M, Joseph GJ, Princic N, et al. Annual acquisition and administration cost of biologic response modifiers per patient with rheumatoid arthritis, psoriasis, psoriatic arthritis, or ankylosing spondylitis. J Med Econ 2013;16:1120-8
- Bonafede MM, Gandra SR, Fox KM, et al. Tumor necrosis factor blocker dose escalation among biologic naive rheumatoid arthritis patients in commercial managed-care plans in the 2 years following therapy initiation. J Med Econ 2012;15:635-43
- Curtis JR, Baddley JW, Yang S, et al. Derivation and preliminary validation of an administrative claims-based algorithm for the effectiveness of medications for rheumatoid arthritis. Arthritis Res Ther 2011;13:R155
- Curtis JR, Chastek B, Becker L, et al. Further evaluation of a claims-based algorithm to determine the effectiveness of biologics for rheumatoid arthritis using commercial claims data. Arthritis Res Ther 2013;15:404
- Curtis JR, Schabert VF, Harrison DJ, et al. Estimating effectiveness and cost of biologics for rheumatoid arthritis: application of a validated algorithm to commercial insurance claims. Clin Ther 2014;36:996-1004
- Curtis JR, Schabert VF, Yeaw J, et al. Use of a validated algorithm to estimate the annual cost of effective biologic treatment for rheumatoid arthritis. J Med Econ 2014;17:555-66
- Charlson ME, Pompei P, Ales KL, et al. A new method of classifying prognostic comorbidity in longitudinal studies: development and validation. J Chronic Dis 1987;40:373-83
- Deyo RA, Cherkin DC, Ciol MA. Adapting a clinical comorbidity index for use with ICD-9-CM administrative databases. J Clin Epidemiol 1992;45:613-19
- Curtis JR, Chastek B, Becker L, et al. Cost and effectiveness of biologics for rheumatoid arthritis in a commercially insured population. J Manag Care Pharm. [in press]