
Abstract
Objective:
To characterize the burden of idiopathic painful peripheral neuropathy with small fiber involvement (idiopathic SFN) by pain severity in the US.
Methods:
One hundred previously diagnosed idiopathic SFN subjects were enrolled during routine office visits. Subjects completed a one-time questionnaire, and investigators reported clinical characteristics and healthcare resource use, based on 6 month retrospective chart review. Annualized direct and indirect costs were estimated. Results were stratified across pain severity groups.
Results:
Mean age was 63.5 years; 53.0% were female; 76.0% had moderate or severe pain. Most common comorbidities were sleep disturbance/insomnia (37.0%), anxiety (34.0%), and depressive symptoms (33.0%). Overall mean health status (0.59; −0.11–1.00 scale), physical and mental health (31.7 and 45.6, respectively, 0–100 scale), sleep index (45.1; 0–100 scale), and pain interference with function (5.0; 0–10 scale) differed by pain severity, with worse outcomes among those with greater pain (all p < 0.002). 84.0% were prescribed ≥1 SFN medication. 16.0% were employed; mean overall work impairment was 36.9%. Annualized average adjusted direct and indirect costs per subject ($8055 and $13,733, respectively) differed by pain severity.
Conclusions:
Idiopathic SFN subjects with pain experience moderate or severe pain, which negatively impacts health status, function, and productivity, and leads to substantial direct and indirect costs.
Introduction
Small fiber neuropathy (SFN) is a relatively common disorder of peripheral nerves, primarily affecting small somatic fibers, autonomic fibers, or bothCitation1,Citation2. The clinical presentation is characteristically dominated by the onset of neuropathic pain and autonomic symptoms usually in adulthood, with relative preservation of most large fiber functions (i.e., relatively normal strength, tendon reflexes, position sense, and vibration sense), and normal nerve conductionCitation1,Citation2. Small fiber neuropathy can be caused by a variety of disorders, including glucose intolerance, lupus erythematosus, scleroderma, inflammatory bowel disease, celiac disease, human immunodeficiency virus (HIV), and toxin or toxic drug exposure, among others; however, in approximately half of the cases (5 to 8 million people in the USCitation3) no cause can be establishedCitation1,Citation2. Such patients are diagnosed as having idiopathic SFN and may complain of tingling, numbness, burning pain, or sensitivity/pain to touch in the feet, usually with sensory loss on the skinCitation4.
Small fibers are not specifically assessed by traditional neurophysiological investigations, and thus SFN can be difficult to diagnose with conventional testing, such as nerve conduction studies and electromyography. The diagnosis of painful idiopathic SFN in clinical practice remains a clinical diagnosis based upon a history of pain starting in the feet (i.e., length-dependent polyneuropathy) and examination findings of hypoalgesia, hyperalgesia, or allodynia without signs or symptoms of large fiber diseaseCitation5. Development of newer diagnostic tools, quantitative sensory testing (QST), and quantifiable nerve fiber density testing via skin biopsy can confirm the presence of SFN in a reliable fashion with good sensitivity and specificityCitation6–8. Skin biopsy can be instrumental in helping to establish an SFN diagnosis among individuals with no known etiology for their neuropathyCitation9; however, these tools are not commonly used in clinical practiceCitation10.
A number of publications have provided evidence that neuropathic pain leads to high levels of pain, impaired quality of life, lost productivity, and increased costsCitation11–14. However, painful idiopathic SFN remains under-studied compared with neuropathic pain populations of comparable size, such as painful diabetic peripheral neuropathy. To our knowledge, no studies have assessed both the humanistic and economic burden of painful idiopathic SFN.
The objective of this study was to comprehensively assess the humanistic and economic burden, by pain severity, of painful idiopathic SFN in the US by capturing sociodemographic and clinical characteristics, as well as the impact of idiopathic SFN on health status, normal function and activities, productivity, healthcare resource use (HRU), and direct and indirect costs.
Patients and methods
Study design and subjects
This cross-sectional, observational study recruited previously diagnosed idiopathic SFN subjects when they presented for routine office visits between September 2011 and March 2012 at one of 16 community-based US physician practices, including 5 general practitioners, 5 pain specialists, 4 neurologists, 1 endocrinologist, and 1 rheumatologist. Study sites screened all subjects with neuropathic pain who presented for office visits during the study period to assess eligibility.
Eligibility criteria for enrollment required subjects to be 18 years or older; to be able to read and understand English; and to have been diagnosed with idiopathic SFN at least 6 months prior to enrollment. Subjects were also required to have been managed at the participating physician’s practice for at least 6 months and to have experienced symptoms due to neuropathy (e.g., pain) for at least 3 months prior to the survey. Subjects were not eligible if they participated in an investigational drug study in the 6 months prior to enrollment, had a serious or unstable medical or psychological condition that would compromise participation in the study, or had a concomitant illness unrelated to idiopathic SFN that may confound the assessment of the subject’s painful idiopathic SFN.
While investigators confirmed subjects had been previously diagnosed with painful idiopathic SFN, diagnosis in the clinical setting was likely based upon history and physical exam, rather than by confirmation by QST or skin biopsy. Individuals with SFN of known cause, including HIV, shingles, diabetes, or other hereditary forms of small fiber involvement were not considered for this sample.
This cross-sectional, observational study was conducted according to the Recommendations Guiding Physicians in Biomedical Research Involving Human Subjects contained in the Declaration of HelsinkiCitation15 and a central Institutional Review Board (IRB), Concordia Clinical Research (Cedar Knolls, NJ), approved this study.
Data collection
Upon enrollment, subjects completed a one-time questionnaire, including items related to demographics, symptom duration, nonprescription treatments, out-of-pocket costs (in the past 4 weeks) related to idiopathic SFN pain treatments, employment status and productivity, as well as the following validated patient-reported outcomes (PRO) measures:
Brief Pain Inventory–Short Form (BPI-SF), an 11 item measure of pain severity (at its worst, at its least, on average, and currently) and pain interference with function (general activity, mood, walking ability, normal work, relations with other people, sleep, and enjoyment of life) (0–10 scale; higher scores indicate worse outcomes)Citation16;
12-item Short-Form Health Survey version 2 (SF-12v2), 1 week recall, a 12 item measure of physical and mental health status via eight domains (physical functioning, role limitations due to physical health, bodily pain, general health perceptions, vitality, social functioning, role limitations due to emotional problems, and mental health) and a physical and mental component score (0–100 scale; higher scores indicate better outcomes)Citation17;
EuroQol 5-dimensions, 3 levels (EQ-5D-3L), a 5 item general health status and utility measure (−0.11 to 1.00 scale; higher scores indicate better outcomes)Citation18;
Medical Outcomes Study Sleep Scale (MOS-SS), a 12 item measure of sleep outcomes, including 6 subscales (sleep disturbance, snoring, awakening short of breath or with a headache, sleep adequacy, somnolence, and sleep quantity) as well as the Sleep Problems Index (0–100 scale; higher scores indicate more sleep problems)Citation19; and
Work Productivity and Activity Impairment (WPAI) due to idiopathic SFN, a 6 item measure used to quantify overall work impairment (comprising absenteeism and presenteeism) and daily activity impairment (scores expressed as impairment percentages; higher scores indicate more productivity loss and greater impairment)Citation20.
The participating physician or site coordinator reviewed the subject’s medical chart for clinical characteristics, such as idiopathic SFN diagnosis date, duration of idiopathic SFN, and comorbidities, as well as idiopathic SFN prescription treatments and other idiopathic SFN-related HRU over the past 6 months.
Costing algorithms
Standard costing algorithms were used to assign ‘per-unit’ costs (2012 US$) to units of HRU and lost productivity to calculate costs.
Indirect costs included work-related lost productivity due to absenteeism, presenteeism and changes in employment status (i.e., disability; unemployment; early retirement; and reduced work schedule) due to idiopathic SFN. Indirect costs were calculated by applying (1) the average hourly wage values, obtained through the Bureau of Labor StatisticsCitation21, to absenteeism and presenteeism from the WPAI as described by Lofland et al.Citation22, and subject-reported time since change in employment status due to idiopathic SFN; as well as (2) the average monthly disability payment from the Social Security Administration to subject-reported time disabled due to idiopathic SFNCitation23.
Direct costs attributable to idiopathic SFN included costs to payers for physician and other healthcare provider visits; prescription medications; transcutaneous electrical nerve stimulation (TENS) device; outpatient tests and procedures; emergency room visits; hospital outpatient visits; and hospitalizations; as well as out-of-pocket costs to subjects for medical care and nonmedical resources (child care, help with house and/or yard work, and help with activities of daily living) related to idiopathic SFN.
Direct costs were calculated using per-unit costs obtained from the 2012 Red Book, discounted average wholesale price (AWP) (plus a dispensing fee)Citation24, the fiscal year (FY) 2012 Medicare Physician Fee Schedule (MPFS), the FY 2012 Medicare Hospital Outpatient Prospective Payment System (OPPS), and the FY 2012 Medicare Hospital Inpatient Prospective Payment System (IPPS). Costing algorithms assigned a per-unit cost (2012 US$) to HRU to calculate direct costs, with the exception of subject-reported out-of-pocket costs, which did not need to be monetized, and per subject costs were then annualized.
Statistical methods
Data analysis was performed using PC-SAS version 9.1.3 (SAS Institute, Cary, NC). To describe the sample, summary statistics were reported, and average pain severity scores on the BPI-SF were used to classify subjects into one of three pain severity groups based on established cut-points for individuals with neuropathic pain (0–3, mild; 4–6, moderate; and 7–10, severe)Citation25,Citation26. To evaluate the association between pain severity and outcomes, the Kruskal–Wallis (continuous variables) and chi-square or Fisher’s exact (categorical variables) tests were applied.
Multiple (adjusted) linear regression was used to examine the association between pain severity and costs. For the adjusted model, the following pool of covariates was introduced for the forward stepwise regression using SAS default entry and exit criteria of 0.15: age, sex, race, ethnicity, pain severity, employment status, ability to walk, insurance coverage, idiopathic SFN prescription drug coverage, worker’s compensation, time since diagnosis, and comorbid conditions (see for a list of comorbid conditions). Details about the components of the final models can be found in . Statistical significance was evaluated at the 0.05 level.
Results
Demographic and clinical characteristics
One hundred idiopathic SFN subjects were enrolled in the study; presents the demographic and clinical characteristics of the entire sample overall and by pain severity. The mean (SD) age was 63.5 (14.6) years in the sample, and a majority (53.0%) of subjects were female. The mean (SD) subject-reported pain severity score was 5.2 (2.4) overall; using aforementioned established cut-points, 76.0% of subjects were classified as having moderate or severe pain. Severe pain was more common among females. A majority (78.0%) of subjects reported suffering (moderately – 21.0%, strongly – 39.0%, or very strongly – 18.0%) from a burning sensation (data not shown). Similarly, the majority (78.0%) of subjects reported suffering (moderately – 22.0%, strongly – 42.0%, or very strongly – 14.0%) from a tingling or prickling sensation in the area of their pain (data not shown).
Table 1. Demographic and clinical characteristics, overall and by average pain severity*.
Subjects had an average (SD) of 3.3 (2.1) comorbid conditions, and the most frequently reported in our sample included sleep disturbance/insomnia (37.0%), anxiety (34.0%), and depressive symptoms (33.0%). Restless leg syndrome and headache/migraine were also reported by more than one-quarter of the sample. Only anxiety differed across the pain severity groups (p = 0.0111).
On average (SD), subjects had been diagnosed with idiopathic SFN 7.3 (5.4) years prior to enrollment in the study (), and it took idiopathic SFN subjects 5.2 months from first experiencing neuropathic pain symptoms to see a healthcare professional (HCP) for their neuropathic pain symptoms (). The majority of subjects reported being diagnosed by a neurologist (39.0%) or pain specialist (14.0%), with the remaining 47.0% of subjects being diagnosed by a primary care physician (27.0%), endocrinologist (6.0%), orthopedist (4.0%), rheumatologist (2.0%), surgeon (2.0%), podiatrist (2.0%), neurosurgeon (1.0%), physiatrist/physical medicine and rehabilitation specialist (1.0%), or other physician (2.0%) (data not shown). On average, it took nearly 1 year from the first neuropathic pain visit to receive an idiopathic SFN diagnosis (). In total, the mean time from subjects’ first experience of idiopathic SFN symptoms to the time of physician diagnosis was 1.3 years.
Health status and function
The mean (SD) BPI-SF pain interference index was 5.0 (2.7) overall; a statistically significant difference was observed across pain severity groups (p < 0.0001) and pain interference with function increased with pain severity (). In the overall sample, 5 of the 7 pain interference with function domains had (mean) scores >5.0: sleep (5.8), walking ability (5.5), normal work (5.5), general activity (5.2) and enjoyment of life (5.2) (data not shown). Significant differences across pain severity groups were observed for each of the seven pain interference with function domains (all p < 0.0001), with higher scores among those with higher pain severity ().
Figure 1. Brief Pain Inventory–Short Form (BPI-SF) Pain Interference Index scores stratified by BPI-SF average pain severity score (mild = 0–3, moderate = 4–6, and severe = 7–10). One subject did not respond to all required items needed to calculate an average pain severity score and thus was not included in any analysis by pain severity. The BPI-SF Pain Interference Index scored on a 0–10 scale. p < 0.0001 across pain severity groups.
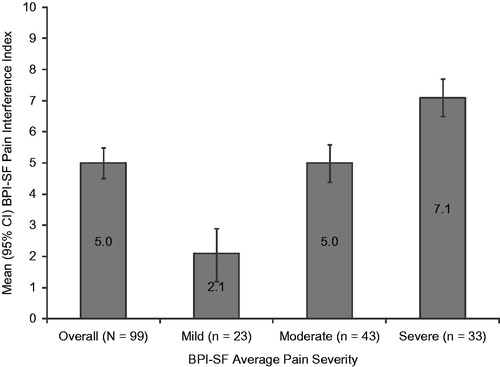
Table 2. Patient-reported pain interference with function, physical and mental health status, and sleep, by average pain severity*.
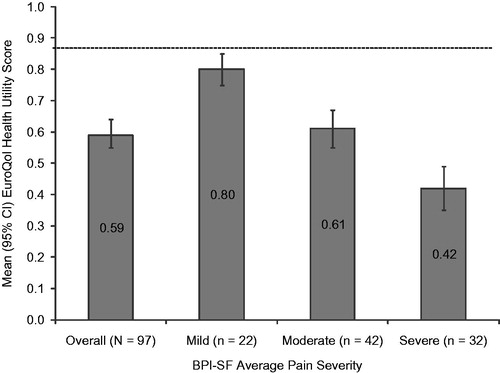
The mean (SD) SF-12v2 Physical Component Summary (PCS) and Mental Component Summary (MCS) were 31.7 (11.4) and 45.6 (12.2), respectively. In the overall sample, the SF-12v2 domains most impacted with (mean) scores <40.0 were physical functioning (29.3), vitality (36.1), bodily pain (37.8) and role physical (38.0) (data not shown). A statistically significant difference was observed in health status across pain severity levels for the PCS (p < 0.0001) and MCS (p = 0.0010; ), as well as for each of the eight individual domains (all p < 0.002), with lower scores among those with higher pain severity (). The mean (SD) EQ-5D-3L health state utility was 0.59 (0.23) overall and decreased as pain severity increased. Similar to the PCS and MCS, a statistically significant difference across pain severity levels was observed in health status measured by the EQ-5D-3L (p < 0.0001; ).
Figure 2. Summary scale scores on the 12 item Short Form Health Survey stratified by Brief Pain Inventory–Short Form (BPI-SF) average pain severity score (mild = 0–3, moderate = 4–6, and severe = 7–10). One subject did not respond to all required items needed to calculate an average pain severity score and thus was not included in any analysis by pain severity. Summary scores are scored on a 0–100 scale (higher scores indicate better health status); population norms are indicated by the broken horizontal line. Physical Component Summary: p < 0.0001 and Mental Component Summary: p = 0.0010 across pain severity groups.
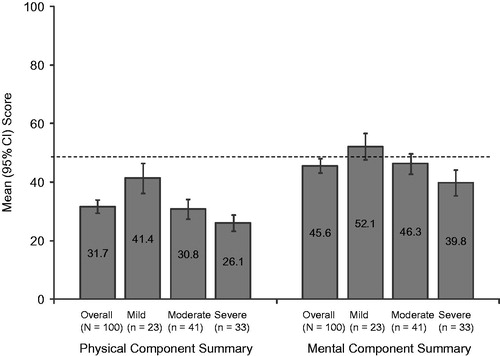
Figure 3. EuroQol health state utility scores stratified by Brief Pain Inventory–Short Form (BPI-SF) average pain severity score (mild = 0–3, moderate = 4–6, and severe = 7–10). One subject did not respond to all required items needed to calculate an average pain severity score and thus was not included in any analysis by pain severity. EuroQol is scored on a −0.11 to 1.00 scale (higher scores indicate better health status); population norm is indicated by the broken horizontal line. p < 0.0001 across pain severity groups.
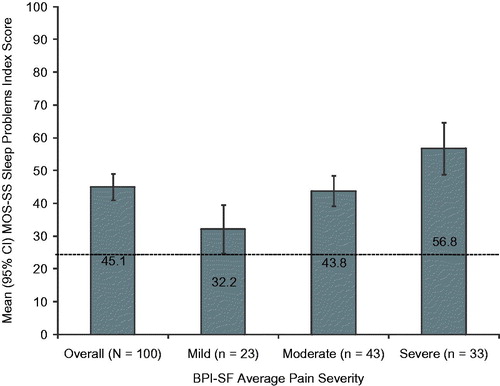
The mean MOS-SS Sleep Problems index score was 45.1 (20.3); sleep problems worsened at increasing levels of pain (p < 0.0001; ). The sleep domains most affected were sleep disturbance, sleep adequacy, and sleep somnolence (means 47.5, 43.8 and 42.5, respectively; data not shown). In each of the sleep domains measured by the MOS-SS, subjects with severe pain had the worst mean scores (). A statistically significant difference was observed across pain severity levels for sleep disturbance, sleep adequacy, sleep somnolence, and shortness of breath or headache (all p < 0.02; ).
Figure 4. Medical Outcomes Study Sleep Scale (MOS-SS) Sleep Problems Index score stratified by Brief Pain Inventory–Short Form (BPI-SF) average pain severity score (mild = 0–3, moderate = 4–6, and severe = 7–10). One subject did not respond to all required items needed to calculate an average pain severity score and thus was not included in any analysis by pain severity. The MOS-SS Sleep Problems Index is scored on a 0–100 scale (higher score indicates greater sleep problems); population norm is indicated by the broken horizontal line. p < 0.0001 across pain severity groups.
Lost productivity and changes in employment status
The majority of subjects were not employed for pay. Nearly half (49.0%) were retired, 23.0% were disabled, and less than a quarter (16.0%) were employed; employment status differed significantly by pain severity (p = 0.0138, ). Overall, approximately a quarter of the sample reported that SFN had negatively impacted their employment status, and this impact differed by pain severity (p = 0.0296), with a greater impact among severe subjects (). For example, 95.7% of mild subjects reported no change in employment status due to SFN compared to 60.6% of severe subjects, and 4.3% of mild subjects reported being disabled due to SFN compared to 27.3% of severe subjects.
Figure 5. Overall employment status among the study subjects (N = 100). Employment status differed significantly by pain severity (p = 0.0138), with 26.1% of mild, 20.9% of moderate, and 3.0% of severe subjects employed for pay; 4.3% of mild, 18.6% of moderate, and 42.4% of severe subjects disabled; 56.5% of mild, 48.8% of moderate, and 42.4% of severe subjects retired; and 8.7% of mild, 7.0% of moderate, and 6.1% of severe subjects unemployed. Two moderate subjects and one severe subject selected ‘other’, and one mild subject and one severe subject had missing data.
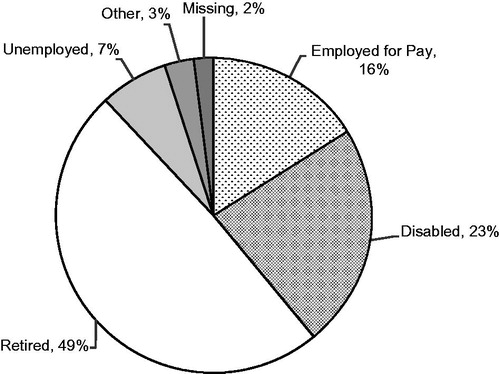
Table 3. Impact on employment status, work productivity, and activity impairment due to small fiber neuropathy, overall and by average pain severity*.
WPAI scores for overall work impairment, which consists of absenteeism and presenteeism, and overall activity impairment are presented in . Among employed subjects (n = 16), mean (SD) WPAI overall work impairment due to idiopathic SFN was 36.9% (31.3%). Across all subjects, mean (SD) WPAI activity impairment due to idiopathic SFN was 51.9% (29.6%); the difference was statistically significant (p < 0.0001) across pain severity groups and worsened at increasing levels of pain.
Healthcare resource use
The mean (SD) number of idiopathic SFN-related physician office visits per subject in the 6 months prior to enrollment was 2.7 (2.2), and the mean (SD) number of office-based tests and procedures performed in the same 6 months was 0.6 (1.4; ). However, no significant difference in use of these resources was observed across the pain severity groups ().
Table 4. Healthcare resource utilization for small fiber neuropathy, overall and by average pain severity*.
A majority (84.0%) of subjects were prescribed at least one medication for the management of their idiopathic SFN in the 6 months prior to enrollment, and approximately half (51.0%) of the subjects reported taking nonprescription medications for their idiopathic SFN in the 4 weeks prior to enrollment (data not shown). The mean (SD) number of medications prescribed per subject over the past 6 months was 1.7 (1.3) overall, and for nonprescription medications, patients reported a mean of 1.0 (1.3) medications over the past 4 weeks (). Statistical significance was observed across the pain severity groups for prescription medications (p = 0.0117) but not for nonprescription medications (p = 0.1099; ).
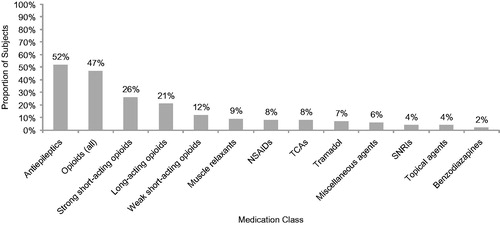
shows that the most frequently prescribed medication classes were antiepileptics (52.0%) and opioids (47.0%). Among antiepileptics, gabapentin (67.3% of those taking an antiepileptic) and pregabalin (32.7% of those taking an antiepileptic) were the most commonly prescribed (data not shown). Opioids were further classified into strong short-acting, weak short-acting, and long-acting classes; the most commonly prescribed of the opioid classes were strong short-acting opioids (). The most frequently taken nonprescription medications were vitamins (27.0%), ibuprofen (21.0%), and acetaminophen (18.0%; data not shown).
Figure 6. Pain-related medications prescribed for small fiber neuropathy (N = 100). Figure includes all reported classes with ≥2% of subjects prescribed one or more medications in the class. Opioids (all) include strong short-acting opioids, long-acting opioids, and weak short-acting opioids. NSAIDs, nonsteroidal antiinflammatory drugs; SNRIs, serotonin–norepinephrine reuptake inhibitors; TCAs, tricyclic antidepressants.
Costs
The unadjusted total indirect and direct costs and cost components are presented in . The unadjusted mean (95% confidence interval [CI]) annualized indirect cost per subject for the overall sample was $13,459 ([$9158, $17,759]). The indirect per subject costs were highest among those with moderate and severe pain, although the difference across pain severity groups was not statistically significant (mild: $5819; moderate: $16,043; severe: $15,824; p = 0.2348). The primary driver of indirect costs was lost productivity due to idiopathic SFN disability (53.6%; data not shown). The unadjusted mean (95% CI) annualized direct cost per subject for the overall sample was $8055 ($5440, $10,671) and increased as pain severity increased (mild: $3375; moderate: $8085; severe: $11,481; p = 0.0100). The primary driver of direct costs was prescription drugs (68.4%), followed by out-of-pocket medical costs to subjects (17.8%; data not shown).
Table 5. Annual per-patient direct, indirect, and total costs, overall and by average pain severity*.
Results from the regression analysis can be found in . A subset of comorbidities were predictive of direct costs; similarly, certain comorbidities and covariates related to employment were predictive of indirect costs. Total average annualized adjusted direct costs per subject were $6501 for mild, $7855 for moderate, and $9602 for severe, and for indirect costs, the values were $7574, $16,871, and $13,522 for mild, moderate and severe, respectively. There was a statistically significant difference in annualized adjusted indirect costs per subject for subjects with mild and moderate pain severity (p = 0.0360; ).
Figure 7. Mean adjusted annualized direct and indirect costs stratified by Brief Pain Inventory–Short Form (BPI-SF) average pain severity score (mild = 0–3; moderate = 4–6; and severe = 7–10). One subject did not respond to all required items needed to calculate an average pain severity score and thus was not included in any analysis by pain severity. p < 0.0001 across pain severity groups for both direct and indirect costs. Values are least squares mean estimates from multiple linear regression adjusted for confounding demographic and clinical variables. Specifically, covariates for direct costs: pain severity (mild/moderate/severe only) and comorbidities (headache/migraine, fibromyalgia [mild/moderate/severe only], restless leg syndrome, anxiety, other); and for indirect costs: age, pain severity (mild/moderate/severe only), workers’ compensation, employment status (overall only), and comorbidities (headache/migraine, Raynaud’s syndrome, other).
![Figure 7. Mean adjusted annualized direct and indirect costs stratified by Brief Pain Inventory–Short Form (BPI-SF) average pain severity score (mild = 0–3; moderate = 4–6; and severe = 7–10). One subject did not respond to all required items needed to calculate an average pain severity score and thus was not included in any analysis by pain severity. p < 0.0001 across pain severity groups for both direct and indirect costs. Values are least squares mean estimates from multiple linear regression adjusted for confounding demographic and clinical variables. Specifically, covariates for direct costs: pain severity (mild/moderate/severe only) and comorbidities (headache/migraine, fibromyalgia [mild/moderate/severe only], restless leg syndrome, anxiety, other); and for indirect costs: age, pain severity (mild/moderate/severe only), workers’ compensation, employment status (overall only), and comorbidities (headache/migraine, Raynaud’s syndrome, other).](/cms/asset/8b527319-09f1-4fb4-ad05-55f6ad557e4d/ijme_a_909439_f0007_b.jpg)
Table 6. Model coefficients for adjusted annual costs.
Discussion
This is the first study to comprehensively evaluate the burden of painful idiopathic SFN with respect to health status, function, lost productivity, and costs among US adults. We found significant associations between pain severity and burden, with worse subject-reported health status and function and greater adjusted direct and indirect costs at increasing levels of pain.
Although subjects were actively managed, results suggest subjects with idiopathic SFN, particularly those with more severe pain, experienced substantially poorer health status than the general US population, as reflected by lower scores on the SF-12 MCS and PCS and EQ-5D-3L relative to US normative values: 49.5, 49.7, and 0.87, respectively (shown in and )Citation27,Citation28. Decrements in health status among those with severe pain were also seen across all the individual SF-12 domains. Subject-reported physical and mental health status in this study was comparable to subjects with painful diabetic peripheral neuropathy (pDPN)Citation14. In both the idiopathic SFN sample in the current study and the pDPN sample described by Gore et al., physical functioning and bodily pain were among the SF-12 domains most negatively affectedCitation14.
Sleep outcomes were also significantly worse among subjects with greater pain severity. Compared with US normative data of 25.8 on the MOS-SS Sleep Problems IndexCitation13,Citation19, idiopathic SFN subjects had substantially higher (i.e., worse) scores (shown in ). Similar findings have been reported for pDPN subjects; Gore et al.Citation14 reported that subjects with pDPN have worse sleep outcomes compared with the general US population.
Indirect costs due to lost productivity associated with idiopathic SFN accounted for the majority of total costs across pain severity groups, although the contribution of indirect costs to the total cost per subject was most pronounced among those with moderate and severe pain. Notably, indirect costs were driven largely by the impact of idiopathic SFN on employment status, and more specifically by disability due to idiopathic SFN, rather than by absenteeism and presenteeism among those employed. Subjects also showed significant increase in overall activity impairment and pain interference with function with increasing pain severity, establishing a clear relationship between pain and activities of daily living and function in this patient population. Overall, idiopathic SFN subjects in our sample reported that pain substantially interfered with normal work and they appeared to experience similar levels of absenteeism and presenteeism compared to data previously reported for pDPN subjectsCitation13,Citation14.
Prescription medications and other HRU related to idiopathic SFN resulted in substantial total direct costs per subject attributable to this condition. This study’s findings suggest that the direct costs of idiopathic SFN may be higher than those of other peripheral neuropathy conditions. While not a direct comparison, a recent claims analysis found that the mean all-cause annual direct costs for Medicare subjects with various types of peripheral neuropathic pain, other than diabetic peripheral neuropathy, were approximately $9800 once patients had the diagnosis for 6 monthsCitation29. Our study estimates total annual direct costs to be close to this number, although our study sample was younger than the Medicare population, and our study estimated direct costs specific to idiopathic SFNCitation29. Given the marked comorbidity profile seen among idiopathic SFN subjects, future research of the incremental humanistic and economic burden associated with common comorbidities is warranted.
The second leading cause of high direct costs was out-of-pocket medical costs to subjects. Although the vast majority of subjects reported having both health insurance and prescription coverage, these results suggest that subjects incur high out-of-pocket costs for prescription medication co-pay costs and/or the purchase of over-the-counter treatments to manage their pain. Over half of the subjects in the study were supplementing their prescribed medications with over-the-counter treatments. Yet, on average, subjects reported high levels of pain and impaired health status, suggesting an ongoing unmet need in this patient population.
Limitations
Several limitations are inherent to the cross-sectional study design and are important to acknowledge. Subjects were actively seeking care (presented at a routine office visit) and were required to have a diagnosis of idiopathic SFN for at least 6 months in order to capture HRU. As such, findings presented may not be generalizable to other individuals with idiopathic SFN who are not seeking treatment, who do not regularly visit their physician. Finally, individuals with SFN of known cause were not included in this population, and thus the findings of this study may not be generalizable to all SFN conditions.
Study sites were made aware of the study sponsor prior to contracting. Though unlikely, the potential for selection bias among the study sites also should be acknowledged. This cross-sectional study required a 6 month retrospective review of subjects’ medical records, which likely led to underreporting of HRU. The subject’s medical record may not include all visits to other physicians, HCPs, or facilities, including idiopathic SFN-related tests and procedures, and medications prescribed outside of the study site.
Costs were assigned to HRU using standard algorithms, which may have over- or under-estimated costs. Finally, since lost productivity and out-of-pocket costs were based on subject recall, recall bias may have resulted in cost over- or under-estimation.
Conclusion
Despite receiving active management, the majority of subjects with painful idiopathic SFN in this study reported moderate or severe pain, on average, and suboptimal levels of overall health status, function, and well-being. Outcomes worsened among subjects with higher pain severity. Further, the economic burden, particularly indirect costs, of painful idiopathic SFN was substantial. These findings indicate that idiopathic SFN subjects with pain experience comparable burden to other more commonly studied neuropathic pain conditions and highlight the unmet need for more effective management of idiopathic SFN.
Transparency
Declaration of funding
This study was funded by Pfizer Inc.
Declaration of financial/other relationships
A.S. and B.P. have disclosed they are paid employees of Pfizer Inc. C.S., R.M., and S.D. have disclosed that they are employees of Covance Market Access Services Inc., a company that received funding from Pfizer for its role in conducting the study and developing the manuscript. S.N. and A.A. have disclosed that they were paid investigators for the study but were not financially compensated for their publication-related activities. B.R.S., M.T., and E.N. have disclosed that they have no significant relationships with or financial interests in any commercial companies related to this study or article.
JME peer reviewers on this manuscript have no relevant financial or other relationships to disclose.
Acknowledgments
The authors acknowledge Gergana Zlateva PhD, an employee of Pfizer, as well as Felicia Bergstrom MSPH and Rebecca Baik BS, employees of Covance, for their contributions to the study.
References
- Faber CG, Hoeijmakers JG, Ahn HS, et al. Gain of function Nav1.7 mutations in idiopathic small fiber neuropathy. Ann Neurol 2012;71:26-39
- Estacion M, Han C, Choi JS, et al. Intra- and interfamily phenotypic diversity in pain syndromes associated with a gain-of-function variant of NaV1.7. Mol Pain 2011;7:1-10
- Singer MA, Vernino SA, Wolfe GI. Idiopathic neuropathy: new paradigms, new promise. J Peripher Nerv Syst 2012;17(Suppl 2):43-9
- Ho TW, Backonja M, Ma J, et al. Efficient assessment of neuropathic pain drugs in patients with small fiber sensory neuropathies. Pain 2009;141:19-24
- Tavee J, Zhou L. Small fiber neuropathy: a burning problem. Cleve Clin J Med 2009;76:297-305
- Lauria G, Lombardi R, Camozzi F, et al. Skin biopsy for the diagnosis of peripheral neuropathy. Histopathology 2009;54:273-85
- McArthur JC, Stocks EA, Hauer P, et al. Epidermal nerve fiber density: normative reference range and diagnostic efficiency. Arch Neurol 1998;55:1513-20
- Devigili G, Tugnoli V, Penza P, et al. The diagnostic criteria for small fibre neuropathy: from symptoms to neuropathology. Brain 2008;131(Pt 7):1912-25
- Holland NR, Crawford TO, Hauer P, et al. Small-fiber sensory neuropathies: clinical course and neuropathology of idiopathic cases. Ann Neurol 1998;44:47-59
- Backonja MM, Attal N, Baron R, et al. Value of quantitative sensory testing in neurological and pain disorders: NeuPSIG consensus. Pain 2013;154:1807
- Galluzzi KE. Management of neuropathic pain. J Am Osteopath Assoc 2005;105(9 Suppl 4):S12-19
- Ritzwoller DP, Ellis JL, Korner EJ, et al. Comorbidities, healthcare service utilization and costs for patients identified with painful DPN in a managed-care setting. Curr Med Res Opin 2009;25:1319-28
- daCosta DiBonaventura M, Cappelleri JC, Joshi AV. A longitudinal assessment of painful diabetic peripheral neuropathy on health status, productivity, and health care utilization and cost. Pain Med 2011;12:118-26
- Gore M, Brandenburg NA, Dukes E, et al. Pain severity in diabetic peripheral neuropathy is associated with patient functioning, symptom levels of anxiety and depression, and sleep. J Pain Symptom Manag 2005;30:374-85
- Declaration of Helsinki. Adopted by the 18th World Medical Assembly (WMA) General Assembly H, Finland, 1964; amended by the 29th WMA General Assembly in Tokyo, Japan in 1975, the 35th WMA General Assembly in Venice, Italy in 1983, the 41st WMA General Assembly in Hong Kong in 1989, the 48th WMA General Assembly in Somerset West, Republic of South Africa in 1996, and the 52nd WMA General Assembly in Edinburgh, Scotland, 2000. Available at: http://www.wma.net/en/30publications/10policies/b3/index.html [Last accessed 14 November 2013]
- Cleeland CS, Ryan KM. Pain assessment: global use of the Brief Pain Inventory. Ann Acad Med Singapore 1994;23:129-38
- Ware JJ, Kosinski M, Keller SD. A 12-item short-form health survey: construction of scales and preliminary tests of reliability and validity. Med Care 1996;34:220-33
- Rabin R, de Charro F. EQ-5D: a measure of health status from the EuroQol Group. Ann Med 2001;33:337-43
- Hays RD, Martin SA, Sesti AM, et al. Psychometric properties of the Medical Outcomes Study Sleep measure. Sleep Med 2005;6:41-4
- Reilly MC, Zbrozek AS, Dukes EM. The validity and reproducibility of a work productivity and activity impairment instrument. Pharmacoeconomics 1993;4:353-65
- United States Department of Labor United States Bureau of Labor Statistics. May 2011 National Occupational Employment and Wage Estimates United States. 2012. Available at: http://www.bls.gov/oes/2011/may/oes_nat.htm [Last accessed 26 July 2012]
- Lofland JH, Pizzi L, Frick KD. A review of health-related workplace productivity loss instruments. Pharmacoeconomics 2004;22:165-84
- United States Social Security Administration Office of Retirement and Disability Policy. 2011 Annual Statistical Supplement. Old-Age, Surviviors, and Disability Insurance. Table 5.D1. Available at: http://www.ssa.gov/policy/docs/statcomps/supplement/2011/5d.html [Last accessed 23 April 2012]
- Pharmacy Benefit Management Institute. 2011–2012 Prescription Drug Benefit Cost and Plan Design Report. Pharmacy and Drug Manufacturer Reimbursement. Available at: http://www.benefitdesignreport.com/PharmacyReimbursement/tabid/66/Default.aspx [Last accessed 25 April 2012]
- Zelman D, Dukes E, Brandenburg N, et al. Classification of mild, moderate and severe pain due to diabetic peripheral neuropathy based on levels of functional disability [abstract]. J Pain 2004;5(Suppl 1):114
- Zelman D, Dukes E, Brandenburg N, et al. Identification of cut-points for mild, moderate and severe pain due to diabetic peripheral neuropathy. Pain 2005;115:29-36
- Ware JE, Kosinski M, Turner-Bowker DM, et al. User's Manual for the SF-12v2 Health Survey Second Edition. QualityMetric Incorporated, 2009
- Luo NJJ, Shaw JW, Feeny D, et al. Self-reported health status of the general adult US population as assessed by the EQ-5D and health utilities index. Med Care 2005;43:1078-86
- Callaghan B, McCammon R, Kerber K, et al. Tests and expenditures in the initial evaluation of peripheral neuropathy. Arch Intern Med 2013;172:127-32