
Abstract
Objective:
This retrospective cohort analysis was conducted to examine the cost components of administering IV chemotherapy to peripheral T-cell lymphoma (PTCL) patients in the US to inform decision makers.
Methods:
Patients diagnosed with PTCL (ICD-9 code 202.7X) between 1 October 2007 and 30 September 2012 were identified from a US administrative claims database. Costs for patients receiving at least one NCCN recommended IV chemotherapy were assessed using the allowed payment from claim line items, categorized into cost components (study drug costs, IV administration costs and other visit-related services).
Results:
The mean costs to the payer for IV cancer therapy administration in a PTCL patient population averaged about $5735 per visit and $9356 per member per month (PMPM). Across all therapies, mean IV administration costs accounted for $127–$794 per visit and $594–$1808 PMPM, contributing an additional 2–32% to the total costs of the drug alone. Mean other visit-related services costs for treating PTCL accounted for $70–$2487 per visit and $444–$3094 PMPM, contributing an additional 2–74% to the total costs. Combined, these additional costs represent an additional mean cost of $220–$3150 per visit and $1193–$4609 PMPM to the base price of the drug alone.
Limitations:
This study used a convenience sample to identify PTCL patients and only included visits where at least one NCCN recommended IV chemotherapy was administered.
Conclusions:
The costs of IV administration and other visit-related services add measurable costs to the total cost of IV therapy for treating PTCL. When considering the cost of the drug, these additional costs can represent a substantial proportion of the overall costs and must be considered when evaluating the costs of IV treatment options for PTCL.
Introduction
Lymphoma is a cancer of the white blood cells, namely lymphocytes, which constitute the lymphatic system. Peripheral T-cell lymphoma (PTCL) comprises a group of rare and aggressive non-Hodgkin lymphomas that develop from T-cells in different stages of maturityCitation1. According to recent SEER estimates, T-cell lymphomas account for about 4% of all yearly cases of non-Hodgkin lymphoma in the United StatesCitation2. PTCL generally affects people over the age of 55 and is diagnosed in slightly more men than women. In the United States, 5 year relative survival rates for PTCL remain poor, ranging from 0% to 67% depending on subtype and other factorsCitation3.
For most subtypes of PTCL, frontline therapy primarily consists of intravenously administered agents used in combination such as CHOP (cyclophosphamide, doxorubicin, vincristine and prednisone), EPOCH (etoposide, vincristine, doxorubicin, cyclophosphamide and prednisone) and Hyper-CVAD (cyclophosphamide, doxorubicin, vincristine and dexamethasone), as indicated in the National Comprehensive Cancer Network (NCCN) guidelinesCitation4.
Relapsed PTCL patients are also commonly treated with combination chemotherapy regimens such as ICE (ifosfamide, carboplatin and etoposide), DHAP (dexamethasone, cytarabine and cisplatin) and ESHAP (etoposide, methylprednisolone, cytarabine and cisplatin) with autologous stem cell transplantation considered if a sufficient response is achieved with chemotherapyCitation4. Gemcitabine as a single agent is effective in treating PTCL in the relapsed setting and is also given in combination with other chemotherapies, including oxaplatin in a regimen called GemOx or in combination with vinorelbine and doxorubicin in the regimen referred to as GNDCitation5. The use of these regimens for PTCL derives largely from their observed activity in B-cell lymphomas as well as smaller sets of data in PTCL patientsCitation6,Citation7. In addition to the use of chemotherapy regimens, several new IV agents have been approved in the US as treatments for PTCLCitation8.
Many of these therapies can be administered by intravenous infusion in a clinic or hospital outpatient setting and in the inpatient hospital setting. However, infusion costs obtained from the inpatient setting can be challenging to isolate from the total inpatient cost. For care received in the outpatient setting, patients can be required to make multiple visits per chemotherapy cycle, and/or undergo treatments which are associated with long infusion times, both of which are likely to increase medical costs and impact patient convenience, quality of life and caregiver burdenCitation9. Moreover, in addition to the acquisition costs of these intravenous agents, there are costs associated with their administration in the outpatient setting, for instance, associated pharmacy and nursing time, storage and labeling of the drug, equipment and diluents necessary to administer the drug and any other medications given in addition to the chemotherapy drugs.
Although the cost burden of IV cancer therapy (i.e., cost of IV administration and the cost of IV drugs) has been studied for specific cancer types (e.g., breast, small cell lung cancer)Citation10,Citation11, and other conditions such as rheumatoid arthritisCitation12, to date, no study on the cost breakdown of IV cancer therapy administration has been performed on a PTCL population. These earlier analyses also addressed the cost of administration in single agent therapies, as in the case of rheumatoid arthritis and breast cancer. In contrast, PTCL is a rare condition where numerous therapies are recommended by the NCCN, with the potential for a large number of therapies and drug regimens to be assessed for this analysis. As new oral drugs become available for PTCL patients, it would be valuable for decision makers to understand the costs associated with traditional IV therapy which may be avoided with these new therapies.
In this study, we performed a retrospective longitudinal cohort database analysis to evaluate the cost burden in a real-world setting to the payers of IV cancer therapy administered in the outpatient setting for PTCL patients in the US. The primary objective was to estimate the total and component costs associated with IV cancer therapy administration in patients with PTCL from the health care system perspective. Costs were examined both at the administration visit and per member per month (PMPM) level.
Methods
Data source
Data for this study were obtained from the Experian Healthcare database (previously known as Medical Present Value), which maintains a contract and claims management system that supports 350 general/oncology clinics in the United States. These clinics are represented by a mixture of larger centers (e.g. academic centers) and mid-sized practice groups, providing representation from a range of practice perspectives. The database contains a history of diagnoses (ICD-9-CM codes), procedures, and drug therapies received by both publicly and privately insured patients within the clinics, as well as patient demographics (e.g., age, gender, and geographic region) and insurance type (e.g., managed care, indemnity, Medicare, and Medicaid). For every patient clinic visit, Experian records the service dates, total charged, total contracted payments, and total allowed, with individual services, procedures, and IV drugs broken out by line item using Current Procedural Terminology, Fourth Edition (CPT-4) and Healthcare Common Procedure Coding System (HCPCS) codes.
PTCL treatments
The selection of PTCL treatments for this study was based on NCCN guideline recommended therapy, version 3.2012Citation4. Of the 18 IV therapies recommended by NCCN guidelines for treating PTCL, ten were combination therapies and eight were single-agent therapies. To ensure all NCCN recommended therapies of interest were included, the combination regimens were decomposed into their components to create a list of 24 individual drugs (comprising regimen components and single-agent therapies) that could be identified in the claims data ().
Table 1. Codes for chemotherapy regimen components and single agent treatments, as described in PTCL NCCN Guidelines v3.2012.
The treatment regimens that consisted of all IV components were clearly identified in the data. However, Experian data only captures drugs that are intravenously injected during a patient clinic visit and results in a line item on the clinic claim. Thus, oral agents received from a pharmacy are not included in the clinic claim from Experian. In the treatment of PTCL, CHOP and HyperCVAD are distinguished by the use of prednisone or dexamethasone, respectively, both of which can be administered orally and obtained from a pharmacy. For this reason, cyclophosphamide–doxorubicin–vincristine was identified when administered, but assigning it as either CHOP or HyperCVAD was not possible. Thus, the combination of cyclophosphamide–doxorubicin–vincristine was included in the analysis as ‘CHO’, inferring that it could represent either HyperCVAD or CHOP or simply CHO alone (in limited examples CHOP could be identified when prednisone was administered intravenously).
Patient sample
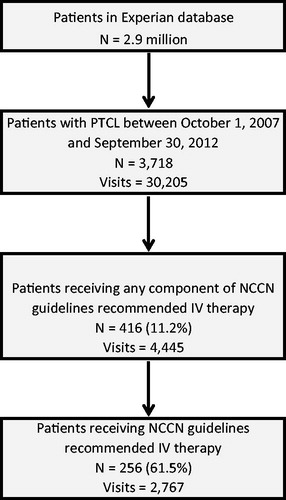
This study employed a retrospective, longitudinal cohort design. Patients (all ages) with a single diagnosis of PTCL (ICD-9-CM 202.7X) between 1 October 2007 and 30 September 2012 were identified for the study. PTCL patients were further required to have at least one visit after the index PTCL diagnosis in which an NCCN guideline recommended therapy for treating PTCL was administered (). A total of 3718 patients (30,205 claims) were identified using PTCL ICD-9 codes, of whom 416 patients (4445 claims) received at least one component of an NCCN recommended IV chemotherapy combination or single agent after the index PTCL diagnosis date. Some of these excluded patients may have been treated in a clinic setting outside the Experian dataset or enrolled in a clinical trial. Since this study was limited to NCCN recommended therapies, patients that did not receive at least one IV single agent or a complete combination therapy as included in the NCCN guidelines were excluded from the study, resulting in a total of 256 patients (2767 claims) being included in this current analysis.
Figure 1. Selection of patients with PTCL receiving NCCN Guideline recommended IV therapy.
All claims and demographic characteristics for these patients were obtained from the Experian dataset. Insurance type was defined at the time of the index PTCL diagnosis and was held constant during the study period. Age was calculated as patient age in 2009 and categorized into five age groups. Geographic location was aggregated into five regions in the US.
Treatment costs
Costs
Treatment costs were estimated using the contracted allowed payment for a claim, as opposed to the practice charges, based on adjudication of the claim by the patient’s third-party insurance plan. The contracted allowed payment in the Experian dataset is defined as the amount that the provider is eligible to receive from all parties, including primary and secondary payers and the patient, based on the contractual agreement with the payer. Because the contracted payment represents the actual payment to providers from payers, it depicts a more accurate and detailed view of the true economic burden of IV cancer therapy administration to payers.
Reporting of costs – per visit and PMPM
Costs were calculated using two methods: mean cost per IV administration visit and mean cost per member per month (PMPM). Costs per visit included all costs incurred on dates of service where an NCCN recommended regimen was administered. The total costs can result in the inclusion of costs for non-recommended therapies and other services that the patient received on the same day that the NCCN regimen was administered. Costs were categorized as IV cancer therapy drug costs (from NCCN recommended therapy list), IV cancer therapy administration procedure costs, and costs associated with other visit-related drugs and services provided on the day of the IV cancer therapy visit (based on CPT codes). Cost data was adjusted based on the medical consumer price index (CPI) and reported in 2012 US dollars.
As the cost per IV administration visit reports only costs that were generated during a single visit in which chemotherapy administration occurred, it does not take into account the length of therapy or frequency of visits. PMPM costs accounts for length and frequency of chemotherapy visits by dividing aggregated costs by aggregated months. Reporting patient PMPM costs is an approach commonly used in non-experimental study settings to account for different lengths of observation periods among study patients, while clinicians and payers may find the costs per visit to be more informative.
Classification of treatment regimens
As treatment regimens consisting of multiple study drugs can be administered either in a single visit or over multiple visits over the course of a cycle, a consistent definition of each regimen was applied on a per visit or per month basis. Per visit costs were reported based on the exact IV chemotherapy drug(s) that the patients received during the visit. However, for the PMPM cost analysis, since patients may receive drugs at different visits for the same combination drug regimen, patients were classified into drug regimens based on what therapies they received over a period of time. For example, a patient receiving CHOP may receive cyclophosphamide and doxorubicin at visit 1, followed by vincristine and prednisone in visit 2. While the visit analysis classifies each of these visits separately and would not account for a CHOP therapy being received on a single visit, the PMPM classifies this patient as receiving CHOP over the therapy window. Due to this classification difference, six patients in the PMPM analysis were excluded from the per IV visit analysis due to receiving the complete recommended therapy over multiple visits.
Classification of therapies in the PMPM analysis was complicated by the fact that patients did not always receive the complete NCCN recommended combination regimen subsequent to the initial exposure. For example, a patient being treated with an EPOCH regimen may receive the complete combination during the first cycle, but then may omit vincristine in a subsequent cycle (a clinical reason could be to manage toxicities). Therefore, to classify costs of administration to a particular regimen, if a patient received a complete NCCN recommended regimen at one point in time (referred to as the ‘parent regimen’), visits in which a patient subsequently received either a) one of the three chemotherapy agents or b) two of the four chemotherapy agents of the parent regimen (e.g. agents not supportive care alone in nature) were classified as receiving that regimen for the purposes of PMPM. Supportive care agents were defined from this set as prednisone, methylprednisolone, mesna (except in the MINE regimen), and dexamethasone (when administered in the absence of an active agent). All of the other NCCN listed drugs were considered ‘chemotherapy agents’ for the definition described here.
Therapy durations
For the PMPM analysis, therapy durations were calculated based on patient–therapy windows. The observation period for each patient–therapy window began at the visit where an IV cancer therapy is administered and ended with either the last IV cancer therapy administration (if the patient only remains on one therapy) or the last visit of that IV cancer therapy before a patient switches to a different IV cancer therapy, plus a therapeutic effect. The therapeutic effect for patients that do not switch therapies is the average interval across the entire dataset for that particular IV cancer therapy. For patients that switch IV cancer therapies, the therapeutic effect is defined as the minimum of either the time between the last visit of that therapy and the start of the new therapy or average therapy interval across the entire dataset.
Statistical analysis
Patients’ baseline characteristics were reported for the overall cohort of patients that met the study inclusion criteria via summary statistics. Frequencies and percentages were reported for categorical variables and means, standard deviations, and medians were reported for continuous variables. Per visit and PMPM costs were reported for the PTCL patient sample using medians, means, and standard deviations. The total and component IV administration costs for NCCN recommended therapies are reported and further subdivided into costs by managed care and Medicare patients. Therapies that were received by five or fewer patients were combined into the classification of ‘other’.
All statistical analyses were performed using SAS 9.3 statistical software (SAS Institute Inc., Cary, NC, USA).
Results
Patient characteristics
Patient characteristics for the PTCL sample (256 patients) are presented in . PTCL occurs more often in older adults with a median age of 62 for all PTCL patients, although this varies among PTCL subtypesCitation13. Consistent with this, almost half (48.8%) of the sample were older than age 65. Accordingly, almost half of the patients were covered by Medicare, with about another third of patients receiving insurance coverage through managed care. The South is the most represented geographic region, comprising about half (54.7%) of the patient sample, with fewer sample patients residing in the Northeast (5.5%) and Midwest (6.6%).
Table 2. Patient characteristics (N = 256).
Total cost and major cost categories
Costs per visit where an anticancer agent was administered intravenously are presented in . The mean cost per visit across the entire PTCL patient sample was $5735 (SD $4873). Mean study drug treatment cost was $4588 (SD $4902) and represented 80.0% of the total cost of the visit. Administration costs represented 6.5% of total costs with a mean cost of $374 (SD $251) per visit. More than three-quarters (80.7%) of the administration costs were associated with direct administration (e.g. infusion time) of the cancer therapy ($302, SD $222), with the remaining costs associated with hydration administration (0.4%) and therapeutic, diagnostic, and prophylactic administration (18.9%).
Table 3. PTCL IV visit and PMPM allowables by cost category.
The remaining 13.5% of the visit costs ($772, SD $1839) were attributed to other visit-related services; 93.9% of these other visit-related costs were other IV drugs and specially administered oral drugs. Non-NCCN recommended chemotherapy comprised the largest part (68.7%) of these other drugs with a mean cost of $498 (SD $1705). Drugs for related symptoms and side-effects included the cost of anti-emetic drugs (mean cost of $176 per visit, SD $202) and colony-stimulating factor (mean cost of $33 per visit, SD $278). Evaluation and management office visits, supplies and equipment, and other miscellaneous administration comprised a small part of the other visit related services category with a mean cost of $47 (6.2% of other visit-related services).
Total mean PMPM cost for the patient sample was $9356 (SD $11,426). Mean IV administration costs were 9.8% of total PMPM costs at $918 PMPM (SD $763), of which 81.0% ($744, SD $605) was due to chemotherapy administration (e.g. infusion time), 18.3% ($168, SD $180) was due to therapeutic, diagnostic, and prophylactic administration, and 0.7% ($6, SD $52) was due to hydration administration. Mean PMPM cost per study drug was $6196 (SD $11,122) and other visit-related costs were $2242 (SD $3233). Supplies/equipment, evaluation and management office visits, and miscellaneous administration costs accounted for about $80 PMPM (3.5%). The highest cost miscellaneous drugs administered during the visits were monoclonal antibody agents ($1472 PMPM, SD $3189). Other administered drugs were related to controlling side effects, including anti-emetic drugs ($470 PMPM, SD $505) and colony-stimulating factors ($136 PMPM, SD $710).
Costs by IV therapy
Total costs per visit by administered therapy are presented in . Mean total per visit costs by drug or combination regimen ranged from $1368 to $11,065. Cyclophosphamide–doxorubicin–vincristine (CHO), inferred as a backbone of CHOP or Hyper-CVAD, was the most commonly administered regimen, received by 65.6% of patients with an average total cost of $2738 (SD $2926). Administration costs for CHO regimens represented 19.7% ($540, SD $315) of the total visit costs and other visit-related services represented 70.9% ($1942, SD $2681) of total visit costs. The cost of the CHO regimen itself represented little (9.3%) of the total cost per visit. The other most commonly administered chemotherapies were: single agent gemcitabine (14.4% of patients), romidepsin (11% of patients), and pralatrexate (11% of patients). Single agent gemcitabine was one of the lower costing therapies to administer with a total cost per visit of $1368 (SD $614) with 16.6% ($227, SD $69) of costs due to IV administration and 11.8% ($162, SD $196) of costs due to other visit-related services. Romidepsin and pralatrexate were among the higher cost therapies with total costs of $7614 (SD $3924) and $11,065 (SD $4031), respectively. Romidepsin administration costs were $365 (4.8% of total visit costs) and other visit-related services costs were $359 (4.7% of total visit costs), while pralatrexate administrative costs were $221 (2.0% of total visit costs) and other visit-related services costs were $253 (2.3% of total visit costs).
Table 4. PTCL IV visit and PMPM allowables by drug.
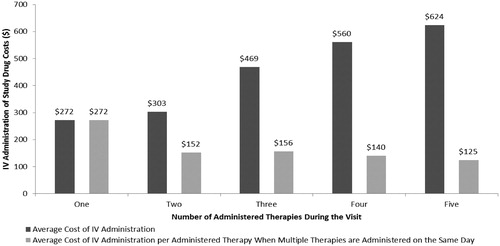
Administration costs per visit varied widely across therapies ranging from $127 for bortezomib to $794 for CHOP. One explanation for this variation in cost of therapy administration may be due to cumulative administration time of combinations of multiple agents, which may take longer to infuse than a single agent and thus be more costly. shows the administration costs per visit based on the number of administered agents. Average cost of administration increases in a step-like fashion from $272 for visits where one agent was administered to $624 for visits where five agents were administered. Normalizing these costs by the number of administered agents shows that the average cost per administered agent declines from $272 for one therapy to $125 for each therapy when five are administered. These findings indicate that administering a multi-agent chemotherapy over several days will likely cost more than if it were administered on a single visit alone.
Figure 2. PTCL IV costs by number of administered therapies during a visit.
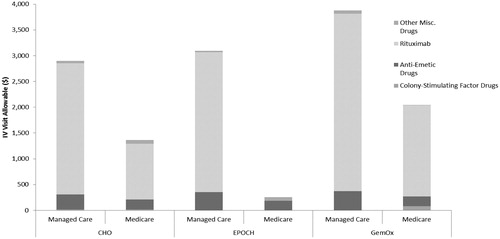
Other visit-related costs per visit also showed considerable variation between therapies from $70 to $2487, with EPOCH, GemOx, and CHO reporting the highest costs. Further examination of these therapies with high other visit-related costs are shown in . For these therapies, the high other visit-related costs were driven largely by off-label use of rituximab and, to a lesser extent, anti-emetic drugs in these patients.
Figure 3. ‘Other visit-related costs’ per visit for managed care and Medicare patients.
Total mean PMPM cost by study drug regimen varied greatly from $4082 to $40,074 PMPM (). Similar to the IV visit analysis, CHO was the most commonly administered regimen with mean IV administration costs of $775 (19.0% of total PMPM costs) and other visit-related services of $2929 (71.7% of total PMPM costs). Gemcitabine was the second most commonly administered drug with mean IV administration costs of $749 (12.3% of total PMPM costs) and other visit-related services of $444 (7.3% of total PMPM costs). Mean PMPM cost of IV administration varied greatly across therapies from $594 to $1808. The most expensive drugs to administer were EPOCH and denileukin diftitox, as opposed to pralatrexate and bortezomib which were least expensive to administer. Other visit-related services also ranged broadly across therapies from $444 to $3094. The drugs with the most expensive other visit-related services in absolute terms were EPOCH and GemOx. In terms of analyzing the other visit related services as a percentage of total costs, CHO and EPOCH represented this category as >50% of the total costs, primarily due to the use of rituximab in combination with these therapies.
Cost by insurance type
Cost components by study drug for the most commonly used therapies are presented in for visits and for PMPM by insurance type (managed care and Medicare). The ratio of managed care to Medicare costs varied greatly depending on the study drug from −10% to 334%. The most commonly administered drugs were CHO, gemcitabine, and romidepsin. IV administration costs for CHO were almost double for managed care patients ($772, SD $323) compared to Medicare patients ($397, SD $177) and other visit-related costs for CHO were more than double for managed care patients ($2901, SD $3273) compared to Medicare patients ($1367, SD $1998). Total costs for gemcitabine were 92% higher for managed care patients compared to Medicare patients, with 43% higher IV administration costs and 92% higher other visit-related costs. Similarly, romidepsin costs were 42% higher cost managed care patients compared to Medicare patients, with 113% higher IV administration costs and 16% higher other visit-related costs.
Table 5. (a) PTCL IV visit allowables by managed care and Medicare breakdown by drug. (b) PTCL PPPM allowables by managed care and Medicare breakdown by drug.
Similar trends were observed in the PMPM analysis by insurance type. The ratio of managed care to Medicare costs varied from −48% to 380% for total costs and −70% to 266% for IV administration. For CHO, IV administration costs were 87% higher for managed care patients ($1040, SD $457) compared to Medicare patients ($556, SD $309) and other visit-related costs were 61% higher for managed care patient ($3491, SD $4457) compared to Medicare patients ($2164, SD $2896).
Discussion
The goal of this study was to assess the various costs associated with IV administration of chemotherapy drugs in PTCL patients. Across all therapies, mean IV administration costs per visit were $374 and ranged between $127 for single agent bortezomib and $794 for CHOP. Expressed as PMPM, the mean cost of administration for all therapies was $918, ranging from $594 for single agent pralatrexate to $1535 for EPOCH. These costs can represent a significant proportion of the total costs associated with the use of intravenous therapies for PTCL.
In addition to the IV administration costs, ‘other visit-related services’ costs also contributed to the total costs in varying amounts with a mean cost per visit of $772, ranging from $70 to $2487 depending on administered therapy. This magnitude of ‘other visit related’ costs for this cohort of patients represents an unexpected finding, accounting for about 24% of total costs on a PMPM basis, with that percentage varying between 3.5% to 71.7% depending on the therapy. In particular, other visit related costs for CHO (representing either CHOP or HyperCVAD therapies depending on the unidentified oral component that the patient received) and EPOCH were highest at 71.7% and 60.5% of the total PMPM cost, representing an unexpected additional $2929 and $3074 dollars, respectively. Further analysis revealed that a large part of these costs was due to rituximab use, which was classified within the ‘other IV drugs/specialty’ as it is not labeled or recommended by the NCCN for use in PTCL. Rituximab was administered in 27.6% of CHO claims in this study. While using rituximab in this indication is not recommended by the NCCN guidelines, there is discussion in the PTCL literature of rituximab use in this patient populationCitation14. The use of rituximab in this patient population may signify that physicians are willing to try various non-recommended therapies for these patients, signifying the high unmet medical need.
Among study drug regimens, the total cost and the percentage of IV administration and other visit-related costs varies widely. IV administration costs varied over a seven-fold range revealing that some study drugs were much more expensive to administer than others. Single agent therapies were often cheaper to administer, in part due to the increased costs to administer the multiple drugs in combination regimens. Administration of multiple-agent regimens were found to be incrementally more costly than single agents as the number of agents increased, even with the cost per agent dropping as more drugs were administered during the same visit. Thus, not only are multiple agents more expensive to administer compare to single agents, but any reason for the patients to make multiple visits to receive therapy, for example due to tolerance reasons, increases the cost of chemotherapy administration on a PMPM basis.
This study highlights several issues of real-world chemotherapy treatment that differs from NCCN guided recommendations. First, the patient selection in this study found that a proportion of PTCL patients receive therapy that is not recommended by NCCN guidelines. Of the 416 PTCL patients that received at least one component of an NCCN guideline recommended therapy, only 256 (62%) patients received a complete NCCN recommended therapy during a single visit. The most common non-NCCN recommended therapies included single agent dexamethasone and vincristine. This gap in claims data for therapy could be potentially explained by patient participation in clinical trials or their receiving therapy at another site or in a hospital setting. Second, previous literature and lymphoma guidelines suggest that some therapies, like HyperCVAD, EPOCH, and romidepsin (based on US prescribing information), have long IV administration timesCitation9. However, an analysis of IV administration codes used in these therapies showed similar administration CPT codes across therapies. For example, a comparison between romidepsin and pralatrexate, where romidepsin is expected to have longer infusion times based on the US prescribing information, most visits for pralatrexate and romidepsin included both an initial chemotherapy administration code (96413 or 96409) and codes for additional hours of administration (96415 or 96375), and longer IV administration codes for romidepsin were not observed. This opens a question about how these drugs are being administered and/or reimbursed in the real world setting.
This study only examined direct healthcare-system-related cost of IV cancer therapy administration in a PTCL patient sample, understating the true cost of IV therapy to the patient. Indirect costs associated with patient and caregiver time, such as travel time and lost productivity, were not included, and can represent a significant cost to patients and societyCitation15. For these reasons, these costs should be considered a lower bound of the total cost to patients for receiving chemotherapy to treat PTCL and future research should examine these broader societal costs. Previous research has shown that patients prefer oral chemotherapy in part because it avoids many of the objectionable aspects of receiving IV therapy, such as the office visit, the inconvenience associated with transportation and parking, time spent waiting in the office, and time lost during intravenous set up and infusionCitation16.
This study has the potential for several limitations. As with all retrospective studies using claims data, identification of PTCL patients relies on the accuracy of diagnosis coding. To help address this issue and identify patients who would be eligible to receive PTCL therapy, we required that patients also receive a chemotherapy treatment that was NCCN guideline recommended for PTCL. We found that 3718 unique patients were identified from the PTCL patient count and reduced to 256 patients when including this criterion. The exclusion of the remaining patients may be a result of a variety of reasons including: patients not receiving NCCN-recommended therapies for any reason, patient participation in clinical trials, change to a provider not in the Experian network, patient death, or a mistake in the diagnosis coding. An additional study limitation is the limited information about patient enrollment. Patients appear in the dataset through clinic visits but no data was available to determine the date of initial diagnosis or if the reason for the lack of additional visits results from no need for additional treatment, the patient switched to receive care at a different clinic, or the patient was deceased. To address this concern, we measured costs using two methods (per visit and per month), with the per visit costs relying less on capturing the full patient treatment history. Also, due to the lack of enrollment data, it was not possible to evaluate patient disease status (at the index IV administration visit in a clinic, patients may be at different stages of disease progression).
Other study limitations include health care utilization on non-administration days, the unavailability of oral drug costs from the pharmacy, and the high prevalence of clinical trial participation which is highly recommended for this patient population. Costs related to IV cancer therapy administration were identified from clinic claims based on the date of the chemotherapy administration. This method could result in a conservative estimate of medical infusion costs because medical costs related to delayed infusion reactions and/or complications that require medical care on days following the infusion are not be captured in this study. Costs of oral drugs or inpatient health care resources were also not included in the cost estimates. The lack of oral therapies in the Experian database limited differentiation between NCCN recommended therapies that differ only by an oral agent component. Finally, NCCN guidelines recommend clinical trials in all lines of therapy for PTCL due to the suboptimal outcomes associated with available therapies. Patients referred to clinical trials are not captured within this dataset, potentially creating an unknown bias.
Conclusion
The cost burden to payers of IV cancer therapy for PTCL patients in the US is a current gap in the literature. Results from this study found that the costs to the payer for IV cancer therapy administration in a PTCL patient population averaged about $5735 per visit and $9356 PMPM. Across all therapies, mean IV administration costs accounted for $127–$794 per visit and $594–$1808 PMPM, contributing an additional 2–32% to the total costs of the drug alone. Mean other visit-related services costs for treating PTCL accounted for $70–$2487 per visit and $444–$3094 PMPM, contributing an additional 2–74% to the total costs. Combined, these additional costs represent an additional mean cost of $220–$3150 per visit and $1193–$4609 PMPM to the base price of the drug alone. When considering the total cost of the drug, these additional costs can represent a substantial proportion of the overall costs and must be considered when evaluating the costs of IV treatment options for PTCL.
Transparency
Declaration of funding
This analysis was supported by Millennium: The Takeda Oncology Company.
Declaration of financial/other relationships
M.H.P. has disclosed that she is an employee and owns stock/stock options of Millennium: The Takeda Oncology Company. G.B.K., S.S., and B.J.W. have disclosed that they received consultancy fees from Millennium: The Takeda Oncology Company for this study.
JME peer reviewers on this manuscript have no relevant financial or other relationships to disclose.
Acknowledgments
The authors acknowledge Dr. Virginia Kelly for clinical discussions and manuscript review.
References
- O’Conner OA. Getting the Facts: Peripheral T-Cell Lymphoma. Lymphoma Research Foundation, July 2009
- Howlader N, Noone AM, Krapcho M, et al. (eds). SEER Cancer Statistics Review, 1975-2010, Bethesda, MD, National Cancer Institute. Table 19.26, non-Hodgkin lymphoma section. Available at: http://seer.cancer.gov/csr/1975_2009_pops09/browse_csr.php?sectionSEL=19&pageSEL=sect_19_table.26.html [Last accessed 21 February 2014]
- Abouyabis AN, Shenoy PJ, Lechowicz MJ, et al. Incidence and outcomes of the peripheral T-cell lymphoma subtypes in the United States. Leuk Lymphoma 2008;49:2099-107
- NCCN Guidelines v3.2012. Available at: http://www.nccn.org/professionals/default.aspx [Last accessed October 2012]
- Zinzani PL, Venturini F, Stefoni V, et al. Gemcitabine as single agent in pretreated T-cell lymphoma patients: evaluation of the long-term outcome. Ann Oncol 2010;21:860-3
- Foss FM, Zinzani PL, Vose JM, et al. Peripheral T-cell lymphoma. Blood 2011;117:6756-67
- Savage KJ. Therapies for peripheral T-cell lymphomas. Hematology 2011;(1):515-24
- Howman RA, Prince HM. New drug therapies in peripheral T-cell lymphoma. Expert Rev Anticancer Ther 2011;11:457-72
- Thomas DA, O’Brien S, Cortex J. Outcome with the hyper-CVAD regimens in lymphoblastic lymphoma. Blood 2004;104:1624-30
- Kruse GB, Amonkar MM, Smith G, et al. Analysis of costs associated with administration of intravenous single-drug therapies in metastatic breast cancer in a U.S. population. J Manag Care Pharm 2008;14:844-57
- Duh MS, Weiner JR, Lefebvre P, et al. Costs associated with intravenous chemotherapy administration in patients with small cell lung cancer: a retrospective claims database analysis. Curr Med Res Opin 2008;24:967-74
- Wong BJ, Cifaldi MA, Roy S, et al. Analysis of drug and administrative costs allowed by U.S. private and public third-party payers for 3 intravenous biologic agents for rheumatoid arthritis. J Managed Care Pharm 2011;17:313-20
- Vose JM, Neumann M, Harris ME. International peripheral T-cell and natural killer/T-cell lymphoma study: pathology findings and clinical outcomes. J Clin Oncol 2008;26:4124-30
- Kamata M, Sugaya M, Miyagaki T, et al. A case of CD20-positive peripheral T-cell lymphoma treated with rituximab and multiagent chemotherapy. Int J Dermatol 2014;53(1):e24-6
- Kim P. Cost of cancer care: the patient perspective. J Clin Oncol 2007;25:228-32
- Weingart SN, Brown E, Bach PB, et al. NCCN Task Force Report: oral chemotherapy. J Natl Compr Canc Netw 2008;6(Suppl 3):S1-14