
Abstract
Objective:
To evaluate long-run cost-effectiveness in a Swedish setting for liraglutide compared with sulphonylureas (glimepiride) or sitagliptin, all as add-on to metformin for patients with type 2 diabetes insufficiently controlled with metformin in monotherapy.
Methods:
The IHE Cohort Model of Type 2 Diabetes was used to evaluate clinical and economic outcomes from a societal perspective. Model input data were obtained from two clinical trials, the Swedish National Diabetes Register and the literature. Cost data reflected year 2013 price level. The robustness of results was checked with one-way-sensitivity analysis and probability sensitivity analysis.
Results:
The cost per QALY gained for liraglutide (1.2 mg) compared to SU (glimepiride 4 mg), both as add-on to metformin, ranged from SEK 226,000 to SEK 255,000 in analyzed patient cohorts. The cost per QALY for liraglutide (1.2 mg) vs sitagliptin (100 mg) as second-line treatment was lower, ranging from SEK 149,000 to SEK 161,000. Costs of preventive treatment were driving costs, but there was also a cost offset from reduced costs of complications of ∼20%. Notable cost differences were found for nephropathy, stroke, and heart failure. The predicted life expectancy with liraglutide increased the cost of net consumption for liraglutide.
Limitations:
The analysis was an ex-ante analysis using model input data from clinical trials which may not reflect effectiveness in real-world clinical practice in broader patient populations. This limitation was explored in the sensitivity analysis. The lack of specific data on loss of production due to diabetes complications implied that these costs may be under-estimated.
Conclusions:
Treatment strategies with liraglutide 1.2 mg improved the expected quality-of-life and increased costs when compared to SU and to sitagliptin for second-line add-on treatments. The cost per QALY for liraglutide was in the range considered medium by Swedish authorities.
Introduction
Type 2 diabetes is a chronic and progressive disease characterized by hyperglycemia (high blood glucose levels) with disturbances of carbohydrate, fat, and protein metabolism resulting from a defect in insulin secretory on the background of insulin resistance. Continuous medical care and ongoing patient self-management are required for glycemic control and the reduction of risk of long-term microvascular and macrovascular complicationsCitation1. The long-run glycemic level measured by HbA1c has been shown to be associated with the development of microvascular and macrovascular complicationsCitation2, including stroke, myocardial infarction, end-stage renal disease, neuropathy, retinopathy and peripheral vascular disease. Type 2 diabetes is also a major cause of premature mortalityCitation3.
There is currently no cure for type 2 diabetes. While lifestyle changes, for example dietary recommendations, increasing physical activity, and smoking cessation programmes, are an essential feature of good disease management, most patients cannot adequately control their blood glucose levels over time without the addition and gradual intensification of drug therapy. Following current recommendations issued jointly by the European Association for the Study of Diabetes (EASD) and the American Diabetes association (ADA), metformin is considered the first drug of choice in patients that tolerate itCitation4. Over time, however, disease progression leads to requirements for treatment intensification where second-line treatment involves combining metformin with another glucose-controlling agent. Sulphonylurea (SU) is an agent that has been available for half a century and may be used either in monotherapy or in combination with other glucose lowering treatments. However, SU has side-effects including modest weight gain and risk of hypoglycemia (low blood glucose level).
New pharmaceuticals with the aim of improving blood glucose control and reducing side-effects have been introduced in the recent decade as alternatives when blood glucose levels are insufficiently controlled with metformin as monotherapy. As described by a schematic table in EASD/ADA position statement, each of the available pharmaceutical compounds for second-line treatment in combination with metformin may be characterized by efficacy in terms of HbA1c control, risk of hypoglycemia, impact on weight, associated major side effect(s) and costs. Two more recently introduced anti-diabetic drugs are sitagliptin (Januvia) and liraglutide (Victoza) that were granted market authorization in the European Union in March 2007 and June 2009, respectively. In the Swedish setting, liraglutide and sitagliptin are subsidized and have been included in the high-cost threshold since June 2007 and January 2010, respectively, as second-line therapy for patients with insufficient blood glucose control on metformin, SU, or insulin, or when none of the latter agents are suitable following decision by the Swedish Dental and Pharmaceutical Benefits Agency (TLV).
The aim of this study was to obtain long-run cost-effectiveness results in a Swedish setting for liraglutide 1.2 mg as second-line treatment compared with sulphonylureas (glimeperid 4 mg) and sitagliptin (100 mg), for patients with type 2 diabetes.
Materials and methods
Design
We used data on treatment effects as shown in two randomized controlled trials, the LEAD-2 trial (ClinicalTrials.gov Identifier: NCT00318461)Citation5,Citation6 and the 1860-LIRA-DPP4 trial (ClinicalTrials.gov Identifier: NCT00700817)Citation7,Citation8, and the IHE Cohort model of Type 2 Diabetes to analyse the cost-effectiveness for society in life-time perspective (40 years) of liraglutide (1.2 mg) as add-on to metformin compared to SU (glimepiride 4 mg) or sitagliptin (100 mg), respectively, both as add-on to metformin. We applied the societal perspective in the analysis and discounted costs and quality-adjusted life years (QALYs) by 3% in accordance with guidelines from the TLV and the Swedish National Board of Health and Welfare. To produce results for a current Swedish setting, year 2013 prices were obtained from Swedish national and local data sources.
Model
The IHE Cohort Model of Type 2 Diabetes is a cohort level health-economic model based on Markov health states reflecting important microvascular and macrovascular complications and premature mortality that may result from type 2 diabetes. The model is updated on an annual basis for a maximum of 40 years. Time-varying transition probabilities govern the progress of patients through the different health states. These are linked explicitly to the population factors (age, gender, smoking status) and risk factor control (level of HbA1c, blood pressure, blood lipids, etc.) of the cohort. The model applies HbA1c values measured by the standard from the National Glycohemoglobin Standardization Program as most previous studies estimating risk equations for diabetic complications have used HbA1c by this standard including the UK Prospective Diabetes Study, UKPDSCitation9–11.
The model compares two treatment strategies at a time defined by their respective composition of blood glucose lowering treatment in combination with management of blood pressure levels and blood lipid levels. The treatment strategies are defined by the user in terms of treatments used and their associated expected effect on metabolic control, development of body-mass index (BMI), and risk of hypoglycemia. A description of the structure of and parameters in the IHE Cohort Model of Type 2 Diabetes is found in Supplemental material.
Treatment strategies and clinical data
We compared second-line treatment strategies consisting of adding each of the following three pharmaceutical agents to metformin (2000 mg per day). Liraglutide treatment strategy consisted of adding liraglutide 1.2 mg in a once daily injection, the recommended dose for most patients; SU treatment strategy consisted of adding 4 mg glimeperide SU per day; and sitaglipin treatment strategy consisted of adding 100 mg sitagliptin per day. Cohorts were switched to second-line treatment at baseline and remained with the treatment until failure to meet HbA1c 9.0%, where a common third-line treatment was initiated, irrespective of second-line treatment option (metformin in combination with NPH-insulin (40 IU per day)). Treatment strategies are labeled throughout the paper by the name of the second-line add-on pharmaceutical agent.
The cost-effectiveness evaluation was carried out using published data from two randomized clinical trials comparing liraglutide as add-on to metformin to (1) sulphonylurea (glimepiride) as an add-on to metforminCitation5,Citation6 (n = 1091 patients); and (2) sitagliptin as an add-on to metforminCitation7,Citation8 (n = 446).
Data on patient demographic and clinical characteristics as well as treatment efficacy measured by the intention to treat method was retrieved from published trial data (LEAD-2 liraglutide 1.2 mg, n = 241/137; glimepiride, n = 244/113 patients randomized/completed 104 weeks; the 1860-LIRA-DPP4 trial liraglutide 1.2 mg, n = 225/135; sitagliptin, n = 219/151 patients randomized/completed 52 weeks). Where trial reports did not cover model input data, we retrieved data from the Swedish National Diabetes Register (NDR)Citation12,Citation13 and from the cost-effectiveness analyses by Davies et al.Citation14.
presents the baseline characteristics and risk factors for the patient cohorts as reported from the clinical trials. Patients included in the trials had at least 3 months experience with oral anti-diabetic treatment.
All analyses were carried out in four sub-groups by gender and smoking status as the model accounts for differences in risks of complications and mortality based on these variables. summarizes treatment effects from the clinical trials and the assumptions made in the model analysis.
Table 2. Treatment effects from clinical trials and assumptions applied in the model based analysis.
Utilities
The expected utility decrement associated with micro- and macrovascular complications, hypoglycemic events, treatment with insulin and population characteristics (age, gender, diabetes duration and overweight) was based on published dataCitation15,Citation16. The utility impact used in the base case analysis is summarized in Supplemental material Table S1.
Costs of healthcare resource use and loss of production
Data on costs of healthcare resource use (preventive treatment, micro- and macrovascular complications) were retrieved from scientific publicationsCitation17–21; and from online databases, official pricelists and public agency reportsCitation22–26. A detailed specification of costs and prices is found in Supplemental material, Tables S2–S7.
The study applied a societal perspective and accounted for costs of lost production as a consequence of diabetic events and complications. Following Swedish guidelines for economic evaluation of treatments that extend length life, the model accounted for added resource use, health gains as well as expected costs of average consumption due to the incremental length of life. We applied age-specific expected annual consumption costs from EkmanCitation27 inflated to year 2012, using consumer price index.
Few hard data exist on the association between specific diabetic complications and loss of production and we assumed that loss of production due to diabetes was mainly attributed to severe stages of micro- and macrovascular complications. A specification of the expected annual salary by age group, assumptions on loss of productivity, and costs of consumption is found in Supplemental material, Table S8.
All costs are reported in year 2013 values and Swedish krona (SEK). The annual average exchange rate in 2013 was 1 EUR = 8.60 SEK; 1 USD = 6.50 SEK (the Swedish central bank, www.riksbank.se).
Sensitivity analyses
Three alternative specifications of model inputs were used to explore the impact on the estimated incremental cost-effectiveness ratio of changes in risks and treatment strategies in one-way sensitivity analyses: (1) Higher number of hypoglycemic events according to self-reported results for patients on insulin treatmentCitation28 (see Supplemental Material for details); (2) Earlier initiation of second-line treatment at HbA1c = 7% instead of study baseline average 8.3 and 8.4%, respectively (); and (3) BMI = 35 kg/m2 at baseline instead of study baseline average 31.1 and 32.6 kg/m2 (). The first sensitivity analysis explores the impact of different types of sources of data for measuring the number of hypoglycemic events. The second and third sensitivity analyses related to possible alternative implementation strategies for new treatments where (2) represents more strictly kept treatment goals and (3) reflects the impact of restricted reimbursement policies using multiple criteria to identify treatment eligibility.
The sensitivity in the estimated base case analysis incremental cost-effectiveness ratio (ICER) was explored by probability sensitivity analysis (PSA). In the PSA, we allowed variation according to reported standard errors of trial estimates of treatment efficacy parameters and an assumed standard error of resource costs of 10%. Parameters in the sensitivity analyses were assumed to be normally distributed. The resulting incremental costs and QALYs from 500 simulations were plotted in a two-dimensional diagram and used to create cost-effectiveness acceptability curves.
Results
Base case analysis
Analyses were made for four sub-groups by gender and smoking status. There were small differences in costs between sub-groups in terms of estimated costs, QALYs gained and cost-effectiveness in the life-time perspective (40 years) in both treatment comparisons ( and ). Moreover, the patterns of cost drivers were similar for gender and smoking status sub-groups. and present the detailed cost results for non-smoking men and corresponding tables for the three other sub-groups may be found in Supplemental material, Tables S9–S14.
Table 3. Base case analysis liraglutide 1.2 mg vs SU as add-on to metformin. Results by gender and smoking status. Discounted QALYs and discounted costs in SEK 2013.
Table 4. Base case analysis liraglutide 1.2 mg vs sitagliptin as an add-on to metformin. Results by gender and smoking status. Discounted QALYs and discounted costs in SEK 2013.
Table 5. Base case analysis liraglutide 1.2 mg vs SU as an add-on to metformin. Results for non-smoking men. Discounted costs in SEK 2013 by source of cost.
Table 6. Base case analysis liraglutide 1.2 mg vs sitagliptin as an add-on to metformin. Results for non-smoking men. Discounted costs in SEK 2013 by source of cost.
The cost per QALY gained for treatment with liraglutide 1.2 mg compared to treatment with SU glimepiride 4 mg, both as add-on to metformin, were in ranges SEK 226,000 to SEK 255,000. While Swedish authorities including TLV do not apply a pre-defined cost-effectiveness threshold, values below SEK 500,000 per QALY are considered low-to-medium by the Swedish National Board of Health and Welfare.
shows the model predictions for lifetime costs of prevention, treatment of complications, loss of production and net-consumption by sub-type of cost. The higher cost of blood glucose lowering treatment with the liraglutide strategy was driven by a higher cost per year, but also by a longer duration on second-line treatment (8 vs 7 years liraglutide vs SU). However, the higher cost of preventive treatment with the liraglutide strategy was partly compensated by a lower cost of complications, notably for nephropathy, stroke and heart failure. We also note that treatment with liraglutide gave slightly increased life expectancy. This increased consumption costs more than production loss was reduced and, hence, contributed to a higher cost per QALY gained.
The discounted increased total costs of the liraglutide strategy in the life-time perspective (40 years) were ∼SEK 80,000 (direct healthcare costs SEK 57,000 (71%), incremental net consumption SEK 25,000 (31%), while gains in production reduced the difference by SEK 1000 (1.3%)). With this method of measurement, treatments that increase life expectancy after retirement ages will increase incremental costs.
The costs per QALY gained was lower when comparing liraglutide 1.2 mg with sitagliptin 100 mg as add-on to metformin ranging from SEK 149,000 to SEK 161,000 in the base case (). As shown in , the costs of blood glucose lowering treatment and risk factor control of blood pressure and blood lipids were higher with the liraglutide strategy (+SEK 48,000), as was the costs of consumption following the slightly increased life expectancy (+SEK 21,000). The model predicted that other direct healthcare costs including costs of hypoglycemia and micro- and macrovascular complications would be lower for the liraglutide treatment strategy offsetting 20% of the increase in preventive treatment cost. The increase in direct costs were ∼SEK 38,000. The increase in costs of consumption corresponded to 37% of the increase in total costs for the liraglutide strategy in comparison with sitagliptin.
The same pattern of small differences between non-smokers and smokers were seen throughout both base case comparisons for men and women. Overall, smokers had worse survival prognosis and thereby lower health gains and lower costs. Nevertheless, the estimated differences in the ICERs were small and would not change overall policy conclusions.
Sensitivity analyses
The one-way sensitivity analyses showed a consistent pattern across sub-groups of gender and smoking status when we altered frequency of hypoglycemia, baseline BMI and the HbA1c at which the second-line treatment was initiated. summarizes the cost-effectiveness results for the comparison between the liraglutide strategy and the SU strategy for non-smoking men. shows the corresponding results from the comparison between the liraglutide and sitagliptin strategies. Full cost-effectiveness results for all sub-groups are found in Supplemental material, Tables S15–S20.
Table 7. Three sensitivity analyses for liraglutide 1.2 mg vs SU as an add-on to metformin. Discounted life years, QALYs and costs in SEK. Results for non-smoking men.
Table 8. Three sensitivity analyses for liraglutide 1.2 mg vs sitagliptin as an add-on to metformin. Discounted life years, QALYs and costs in SEK. Results for non-smoking men.
The estimated incremental cost-effectiveness ratio (ICER) was slightly lower when we assumed that the number of hypoglycemic events when on insulin treatment were in line with the number of self-reported events reported by Östensson et al.Citation28. The ICER increased slightly when the second-line treatment for both strategies was initiated at HbA1c 7% instead of at study baseline values. This was implied by the longer time on second-line treatment (11 vs 9 years for liraglutide vs SU compared to 8 vs 7 years in the base case analysis). The threshold for switching to third-line treatment was unchanged. Finally the cost per QALY gained was similar for the liraglutide strategy when we assumed that the initial BMI was 35 kg/m2 instead of the trial average (31.1 kg/m2).
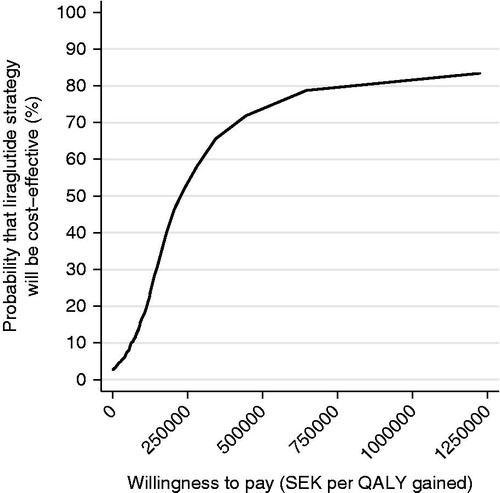
shows the cost-effectiveness plane for 500 simulations in the probability sensitivity analysis (PSA) for non-smoking men. Ninety per cent of the predicted cost increments and QALY increments for the comparison of liraglutide 1.2 mg vs SU were within the intervals SEK 22,701 to SEK 133,633 and −0.15 to 1.27 QALY, respectively. The majority, 85%, of estimated ICERs were within the northeast quadrant of , implying that liraglutide had higher benefits and higher costs. shows the corresponding cost-effectiveness acceptability curve. At a willingness-to-pay of SEK 500,000 per QALY gained, the liraglutide strategy is cost-effective compared to SU in 74% of cases.
Figure 1. Cost-effectiveness plane for liraglutide 1.2 mg vs sulphonylurea as an add-on to metformin. PSA with 500 simulations. Base case, 3% discount rate.
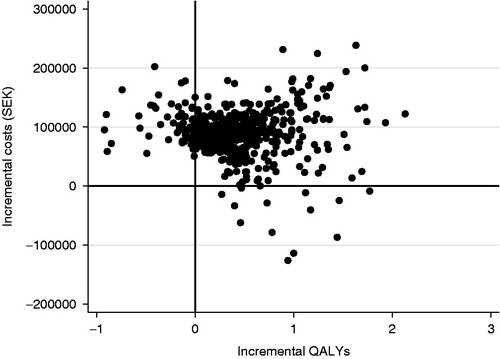
Figure 2. Cost-effectiveness acceptability curve of liraglutide 1.2 mg vs sulphonylurea. PSA with 500 simulations. Base case, 3% discount rate.
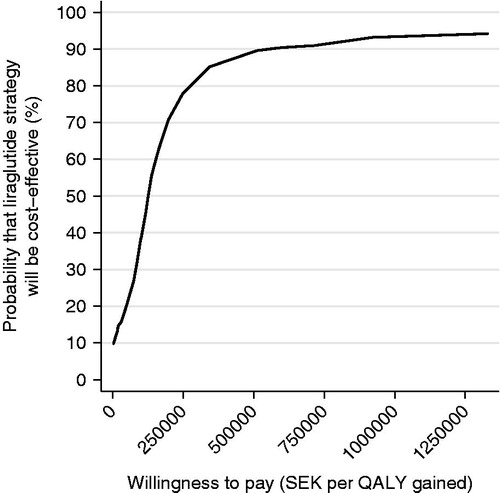
The corresponding analyses for the comparison between liraglutide and sitagliptin strategies are shown in and . Ninety per cent of the predicted cost increments were in the interval SEK −17,323 to SEK 116,740 and 90% of predicted QALY increments were in the interval −0.1 to 1.27 QALY. Eighty-seven per cent of the predicted ICER estimates were in the north-east quadrant (). The probability that liraglutide would be considered cost-effective compared to sitagliptin was 89% at a willingness-to-pay per QALY of SEK 500,000.
Figure 3. Cost-effectiveness plane for liraglutide 1.2 mg vs sitagliptin 100 mg as an add-on to metformin. PSA with 500 simulations. Base case, 3% discount rate.
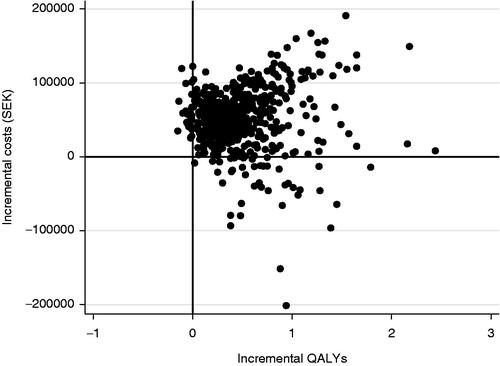
Figure 4. Cost-effectiveness acceptability curve of liraglutide 1.2 mg vs sitagliptin 100 mg. PSA with 500 simulations. Base case, 3% discount rate.
Discussion
The cost per QALY gained of choosing liraglutide 1.2 mg as an add-on to metformin in second-line treatment was in the range SEK 226,000 to SEK 255,000 when the comparison was made with SU as an add-on to metformin in sub-groups by gender and smoking status. When comparing liraglutide 1.2 mg as an add-on to metformin with sitagliptin as an add-on to metformin, the cost per QALY gained was in the range SEK 149,000 to SEK 161,000. Based on the often-used willingness-to-pay threshold of SEK 500,000 per QALY gained, liraglutide is likely to be cost-effective in Sweden compared to SU and to sitagliptin.
This result could be expected from the difference in the cost of preventive diabetes management and pharmaceutical agents used. However, as was shown in and , part of the higher cost of preventive treatment today was offset in the lifetime perspective as the costs of microvascular and macrovascular complications were generally lower for a second-line treatment strategy with liraglutide 1.2 mg compared to either SU or sitagliptin. These tables point at reductions in costs of nephropathy, heart failure, and for the comparison between liraglutide and SU also for stroke. Costs of retinopathy were also reduced. The three biggest overall cost drivers among diabetic complications for people with type 2 diabetes and baseline characteristics as reported from the LEAD-2 and 1860-LIRA-DPP4-trialsCitation5–8 were stroke, nephropathy, and neuropathy, which also includes costs of peripheral vascular disease in the model reports. The analysis indicated that the liraglutide strategy would reduce costs for the two first of these major complications as compared to SU.
While liraglutide improved glycemic control during the trial periods, this was not the key driver of the reduction in costs of complications. More important were the differences found in trials on blood pressure, blood lipids, and body-weight. The avoided and postponed micro- and macrovascular complications for the liraglutide strategy compared to SU and sitagliptin strategies, respectively, also contributed to an expected increased quality-of-life. Other factors increasing the predicted total number of life-time QALYs was increased life expectancy and reduced number of hypoglycemic events following a later start with third-line therapy (insulin).
This analysis used the IHE Cohort Model of Type 2 Diabetes which has recently been validated against published trial data and large population cohort data and the validation report is currently under review for publication. The results of the validation report indicate that the IHE Cohort Model of Type 2 Diabetes predicts cumulative incidence of diabetic complications and mortality well compared to observed outcomes and that the goodness of fit is similar to that of published validation reports on health economic simulation models for diabetesCitation29–31. Another result from the validation of the IHE Cohort Model for Type 2 Diabetes was the importance of choosing sets of risk equations that match the decision context as regards time and place. In this cost-effectiveness analysis, we applied recently published Swedish macrovascular risk equationsCitation32.
The one-way sensitivity analyses performed indicated that results and their interpretation were robust to changes in frequency of hypoglycemia associated with third-line insulin treatment, increasing initial BMI or a more invasive treatment programme where the second-line treatment is initiated at HbA1c 7% instead of starting at baseline values from trials (8.3% and 8.4%). This was to be expected considering the set-up of the analysis. All strategies gave the same third-line treatments and they differed in terms of time to cohorts’ expected switch to third-line treatment. That is, cohorts who maintained the second-line treatment longer would postpone the start of the third-line treatment which was associated with increased risk of hypoglycemia and increases in body weight. The duration of second-line therapy in the base case analysis was 8 and 9 years, respectively, for liraglutide in first and second comparison, compared to 7 years for both SU and sitagliptin.
A previous publication comparing liraglutide to SU and sitagliptin, respectively, using the CORE diabetes model, and the same clinical trial data also concluded that a 5-year long second line treatment duration with liraglutide would be cost-effective in the life-time perspectiveCitation14. These analyses used UK prices and applied a National Health Services perspective which does not account for treatment impact on production loss or potential differences in costs of net consumption due to differing life-expectancy. The costs per QALY gained were lower in Davies et al.Citation14 than in our study, partly explained by this difference in methods.
The analyses used clinical trial data as far as possible. Baseline characteristics of the trial cohorts indicated that they were younger, had slightly higher BMI and higher HbA1c compared to average results shown from a broad population of people with type 2 diabetes in the Swedish National Diabetes Register grouped by 12 types of current blood-glucose lowering therapyCitation12. Trial results are, thus, likely to be more representative for sub-groups within each of the 12 groups as a consequence of the heterogeneity in risk factors and demographic characteristics. Overall, the use of trial data with short duration is a limitation for chronic, life-long diseases such as type 2-diabetes where preventive treatment is a cornerstone. Additional assumptions were necessary to apply a life-time perspective in the analysis. Conservative assumptions were made beyond the trial data as regards treatment efficacy beyond the clinical trials and disease progression (similar to the seminal UKPDS study reportsCitation11), impact on health-related quality-of-life, and costs. Still the second-line treatment was expected to be insufficient over time due to the progressive nature of HbA1c values, irrespective of blood glucose lowering treatment strategies, and all strategies used applied the same NPH-insulin regimen as third-line treatment.
Results from the base case and sensitivity analyses indicated that the time point when second-line treatment is started and the total time on second-line treatment impacts on the estimated cost-effectiveness. That is, a longer time on new and more efficient anti-hyperglycemic treatments increased costs and the incremental cost-effectiveness ratio. Model simulations trying different scenarios may provide valuable information for exploring alternative criteria for initiation and/or termination of second-line therapies. In this study, an earlier start of second-line treatment increased the cost per QALY gained by 12% for liraglutide vs SU and with 32% for liraglutide vs sitagliptin as the number of years on second-line treatment increased. Long-term real-world studies on actual treatment duration and effectiveness data would be valuable also for cost-effectiveness analyses.
Another limitation is the lack of data assessing the loss of production as a consequence of diabetic microvascular and macrovascular complications based on people with type 2-diabetes. Reducing the loss of production is an important aspect in the value of treatment strategies to patients and society. For the purpose of this analysis, we made conservative assumptions regarding the extent of loss of productivity. We did not assume that microvascular complications would reduce productivity before the advanced stages of renal disease or peripheral vascular disease, which implies a conservative assumption for treatment strategies that are prognosed to delay the development of complications.
Finally, we conclude that, in both comparisons, treatment strategies with liraglutide 1.2 mg improved the expected quality-of-life and increased costs when compared to the old agent SU and the new agent sitagliptin for second-line treatments. The estimated incremental cost-effectiveness was below SEK 300,000 in the former case and below SEK 200,000 in the latter case. These results were stable when allowing for variation in the model input data through the PSA and in the conducted sensitivity analysis with respect to hypoglycemia, HbA1c at baseline, and BMI.
Supplemental Material
Download PDF (207.8 KB)Transparency
Declaration of funding
This study was funded by Novo Nordisk, the manufacturer of liraglutide.
Declaration of financial/other interests
KSC and UP are employees at the Swedish Institute for Health Economics, IHE. IHE received funding from Novo Nordisk to support the present study. JME peer reviewers on this manuscript have no relevant financial or other relationships to disclose.
References
- American Diabetes Association. Standards of medical care in diabetes–2014. Diabetes Care 2014;37(1 Suppl):S14-80
- Stratton IM, Adler AI, Neil HA, et al. Association of glycaemia with macrovascular and microvascular complications of type 2 diabetes (UKPDS 35): prospective observational study. BMJ 2000;321:405-12
- Hayes AJ, Leal J, Gray AM, et al. UKPDS outcomes model 2: a new version of a model to simulate lifetime health outcomes of patients with type 2 diabetes mellitus using data from the 30 year United Kingdom Prospective Diabetes Study: UKPDS 82. Diabetologia 2013;56:1925-33
- Inzucchi S, Bergenstal R, Buse J, et al. Management of hyperglycaemia in type 2 diabetes: a patient-centered approach. Position statement of the American Diabetes Association (ADA) and the European Association for the Study of Diabetes (EASD). Diabetologia 2012;55:1577-96
- Nauck M, Frid A, Hermansen K, et al. Efficacy and safety comparison of liraglutide, glimepiride, and placebo, all in combination with metformin, in type 2 diabetes: the LEAD (liraglutide effect and action in diabetes)-2 study. Diabetes Care 2009;32:84-90
- Nauck M, Frid A, Hermansen K, et al. Long-term efficacy and safety comparison of liraglutide, glimepiride and placebo, all in combination with metformin in type 2 diabetes: 2-year results from the LEAD-2 study. Diabetes Obes Metab 2013;15:204-12
- Pratley R, Nauck M, Bailey T, et al. One year of liraglutide treatment offers sustained and more effective glycaemic control and weight reduction compared with sitagliptin, both in combination with metformin, in patients with type 2 diabetes: a randomised, parallel-group, open-label trial. Int J Clin Pract 2011;65:397-407
- Pratley RE, Nauck M, Bailey T, et al. Liraglutide versus sitagliptin for patients with type 2 diabetes who did not have adequate glycaemic control with metformin: a 26-week, randomised, parallel-group, open-label trial. Lancet 2010;375:1447-56
- Clarke PM, Gray AM, Briggs A, et al. A model to estimate the lifetime health outcomes of patients with type 2 diabetes: the United Kingdom Prospective Diabetes Study (UKPDS) Outcomes Model (UKPDS no. 68). Diabetologia 2004;47:1747-59
- Little RR, Rohlfing CL, Sacks DB. National Glycohemoglobin Standardization Program Steering C, Status of hemoglobin A1c measurement and goals for improvement: from chaos to order for improving diabetes care. Clin Chem 2011;57:205-14
- UK Prospective Diabetes Study Group. Intensive blood-glucose control with sulphonylureas or insulin compared with conventional treatment and risk of complications in patients with type 2 diabetes (UKPDS 33). Lancet 1998;352:837-53
- Ekstrom N, Miftaraj M, Svensson AM, et al. Glucose-lowering treatment and clinical results in 163,121 patients with type 2 diabetes: an observational study from the Swedish national diabetes register. Diabetes Obes Metab 2012;14:717-26
- Nationella diabetesregistret NDR. Nationella diabetesregistret. Årsrapport 2012 års resultat [The Swedish National Diabetes Registry. Annual report Results from year 2012]. Göteborg: Registercentrum Västra Götaland, 2013
- Davies MJ, Chubb BD, Smith IC, et al. Cost-utility analysis of liraglutide compared with sulphonylurea or sitagliptin, all as add-on to metformin monotherapy in Type 2 diabetes mellitus. Diabetic Med J Br Diabetic Assoc 2012;29:313-20
- Bagust A, Beale S. Modelling EuroQol health-related utility values for diabetic complications from CODE-2 data. Health Econ 2005;14:217-30
- Evans M, Khunti K, Mamdani M, et al. Health-related quality of life associated with daytime and nocturnal hypoglycaemic events: a time trade-off survey in five countries. Health Qual Life Outcomes 2013;11:90
- Geelhoed-Duijvestijn PH, Pedersen-Bjergaard U, Weitgasser R, et al. Effects of patient-reported non-severe hypoglycemia on healthcare resource use, work-time loss, and wellbeing in insulin-treated patients with diabetes in seven European countries. J Med Econ 2013;16:1453-61
- Gerdtham U, Clarke P, Hayes A, et al. Estimating the cost of diabetes mellitus-related events from inpatient admissions in Sweden using administrative hospitalization data. Pharmacoeconomics 2009;27:81-90
- Jonsson L, Bolinder B, Lundkvist J. Cost of hypoglycemia in patients with Type 2 diabetes in Sweden. Value Health J Int Soc Pharmacoecon Outcomes Res 2006;9:193-8
- Persson U, Willis M, Odegaard K. A case study of ex ante, value-based price and reimbursement decision-making: TLV and rimonabant in Sweden. Eur J Health Econ HEPAC 2010;11:195-203
- Prompers L, Huijberts M, Schaper N, et al. Resource utilisation and costs associated with the treatment of diabetic foot ulcers. Prospective data from the Eurodiale Study. Diabetologia 2008;51:1826-34
- Apotektet. Produkter [Products]. Available at: http://www.apoteket.se/privatpersoner/sidor/start.aspx. Apoteket, 2013
- Statens beredning för medicinsk utvärdering (SBU), Egna mätningar av blodglukos vid diabetes utan insulinbehandling. En systematisk litteraturöversikt. Stockholm: SBU, 2009
- Sveriges kommuner och landsting. KPP-databasen, 2011. Available at: http://www.skl.se/vi_arbetar_med/statistik/kostnad-per-patient Stockholm, Sweden: Sveriges kommuner och landsting.
- Södra regionvårdsnämnden. Regionala priser och ersättningar för södra sjukvårdsregionen 2013. Lund, Sweden: Södra regionvårdsnämnden, 2012
- Tandvårds- och läkemedelsförmånsverket (TLV) [Dental and pharmaceutical benefits board]. Databas för beslut [Database for decisions]. Stockholm, Sweden: Tandvårds- och läkemedelsförmånsverket (TLV) [Dental and pharmaceutical benefits board], 2013. Available at: http://www.tlv.se/
- Ekman M. Consumption and production by age in Sweden. In: Ekman M, ed. Basic facts and health economic implications in Studies in health economics: modelling and data analysis of costs and survival. Stockholm, Sweden: Stockholm School of Economics; 2002
- Östensson CG, Geelhoed-Duijvestijn P, Lahtela J, et al. Self-reported non-severe hypoglycaemic events in Europe. Diabetic med j Br Diabetic Assoc 2013;31:92-101
- Mount Hood 4 Modeling Group. Computer modeling of diabetes and its complications: a report on the Fourth Mount Hood Challenge Meeting. Diabetes Care 2007;30:1638-46
- Palmer AJ, Mount Hood 5 Modeling Group, Clarke P, et al. Computer modeling of diabetes and its complications: a report on the Fifth Mount Hood challenge meeting. Value Health 2013;16:670-85
- Willis M, Asseburg C, He J. Validation of economic and health outcomes simulation model of type 2 diabetes mellitus (ECHO-T2DM). J Med Econ 2013;16:1007-21
- Kiadaliri AA, Gerdtham U-G, Nilsson P, et al. Towards renewed health economic simulation of type 2 diabetes: risk equations for first and second cardiovascular events from Swedish Register Data. PLoS ONE 2013;8:e62650