
Abstract
Objective:
The aim of this study was to determine the budget impact of everolimus (in combination with letrozole/anastrozole) as a second-line treatment for ER+ HER2− negative advanced and metastatic breast cancer in post-menopausal women.
Research design and methods:
A cumulative cohort model was developed to estimate the 5-year costs associated with introducing everolimus to the Kazakh healthcare system. Two alternative market share scenarios were compared: with everolimus and without everolimus. PFS and OS data were taken from the trial and extrapolated. The background costs of the pre-progressed and post-progressed health states, drug costs and costs associated with adverse events were included in the model.
Results:
The 5-year results from the budget impact analysis demonstrate that the introduction of everolimus leads to a 12% increase in drug costs, a 2% reduction in pre-progression health state costs, a 1% increase in post-progression health state costs, and a 2% reduction in adverse event costs. The net result is only a modest increase in total costs; a 2.69% increase of T201 million, from T7.5 billion to T7.7 billion over a period of 5 years.
Conclusions:
The analysis estimated that, if everolimus were to be introduced to the Kazakh healthcare market for the treatment of ER+ HER2− advanced breast cancer, there would be minimal impact upon overall healthcare expenditure. An increase in drug acquisitions costs was almost exactly offset by a reduction in other healthcare costs, due to improved management of the disease.
Introduction
Breast cancer is the most common cancer in women across the world. The World Health Organisation (WHO) estimates that in 2011 breast cancer resulted in ∼508,000 deathsCitation1. It is estimated that in 2012 over 1.6 million new cases of breast cancer were diagnosed and that the prevalence of breast cancer cases diagnosed in the previous 5 years was over 6 millionCitation2. The prevalence of breast cancer in Kazakhstan was estimated to be 27,137 in 2012Citation3. The number of newly diagnosed breast cancer patients in Kazakhstan in 2012 was 3951Citation3. Metastatic breast cancer is the presence of disease at distant sites. It is estimated that the total number of patients with breast cancer will be more than 27,000 in Kazakhstan in 2014, of which ∼8% will develop metastatic diseaseCitation4.
The choice of treatment for women with locally advanced or metastatic disease depends on a number of variables, including previous treatment, site of metastases, receptor status of tumor cells, menopausal status, health, and informed patient choice. For women with estrogen receptor positive (ER+) advanced breast cancer, many authorities recommend offering endocrine therapy (e.g., a non-steroidal aromatase inhibitor (AI) such as letrozole and anastrozole) as first-line treatment for the majority of patientsCitation5. For post-menopausal women with locally advanced or metastatic ER+, human epidermal growth factor receptor 2-negative (HER2-negative) breast cancer, the National Institute for Health and Care Excellence (NICE) does not currently recommend biological therapies (e.g., trastuzumab; Herceptin)Citation6. If disease progresses after treatment with AIs, patients with refractory disease typically move on to other treatments in second line. Everolimus (Afinitor), a new mTOR (mammalian target of rapamycin) inhibitor, is indicated for second-line treatment of ER+, HER2-negative advanced and metastatic breast cancer in post-menopausal women. Everolimus blocks the activation of S6K1 and 4E-BP1, thereby inhibiting cell growth, proliferation, and G1–S transition, and inducing apoptosisCitation7. Everolimus has the potential to act on tumor cells both directly to inhibit growth and indirectly by inhibiting and displaying anti-vascular properties.
The effectiveness of everolimus (in combination with exemestane) has been demonstrated against exemestane alone in the BOLERO-2 trial. The BOLERO-2 trialCitation8 was a randomized, double-blind, phase III study of everolimus plus exemestane vs exemestane plus placebo, which has been conducted in 189 centers in 24 countries. The trial participants were women with HER2-negative, ER+ advanced or metastatic breast cancer whose disease had recurred or progressed following prior treatment with non-steroidal aromatase inhibitors. BOLERO-2 is the only phase III registration trial assessing the use of everolimus in this indication and so is used as the basis for the current study.
Patients were randomized to either oral everolimus (10 mg/day) plus exemestane (25 mg/day) (n = 485) or Exemestane (25 mg/day) plus matching placebo (10 mg/day) (n = 239). Treatment continued until disease progression, the development of unacceptable toxicity, or withdrawal of consent. The protocol provided detailed guidelines for dose interruptions or reductions for everolimus and matched placebo for adverse events; two reductions in dose were permitted. The primary outcome measure was progression-free survival, whilst secondary outcomes included overall survival, overall response rate, clinical benefit rate, time to response, duration of response, safety (adverse events, biomarker analysis, vital signs, time to deterioration of ECOG performance status), pharmacokinetics, and quality-of-life. Further details on the BOLERO-2 trial have been published in Baselga et al.Citation9 and Beaver and ParkCitation10.
The purpose of this study was to estimate the budget impact associated with the introduction of everolimus to the Kazakhstan healthcare system.
Methods
A cumulative cohort model was developed in Microsoft Excel to estimate the 5-year costs associated with introducing everolimus to the Kazakh healthcare system. In order to do so, two alternative scenarios were compared: (i) An existing state of affairs, with current market share being used to estimate the numbers of patients receiving different treatments, and (ii) an ‘intervention’ scenario, where everolimus is introduced to the market and assumed to replace a proportion of existing treatments (see ). The budget impact was estimated for 2014–2018.
Table 1. Market share with and without everolimus.
Everolimus is used in combination with letrozole/anastrozole in Kazakhstan, since exemestane is not registered there. As data on everolimus in combination with letrozole or anastrozole is not available, the data from the two arms of BOLERO-2, everolimus + exemestane and exemestane alone, were assumed in the current model to be representative of everolimus + letrozole/anastrozole and letrozole/anastrozole alone, respectively.
Epidemiology
A cumulative cohort approach to the modeling was taken. That is, in the first year of the model, the first year’s cohort enters the model and incurs the costs of their first year of treatment. In the second year of the model, any surviving members of the first year’s cohort are joined by a new incident population. Thus, in the second year, two separate cohorts are being modeled, the first cohort in their second year and the second cohort in their first year. In the third year of the model a new, third, incident cohort is introduced, and so forth until the model has completed 5 years. The model was limited to a 5-year horizon in order to avoid introducing additional uncertainty due to unknown long-term treatment outcomes, as well as unknown changes in market conditions. This is shown in .
Figure 1. Cumulative cohort approach.
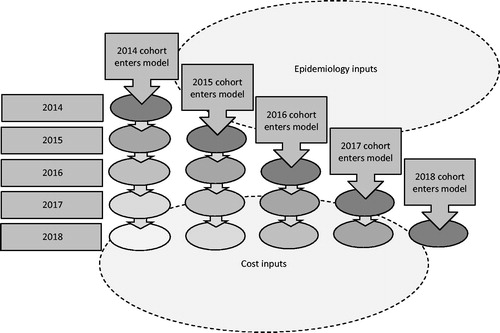
The Kazakh Scientific Research Institute of Oncology and Radiology has estimated that, in 2012, the total number of patients with breast cancer was 27,137Citation3. This figure was applied as an estimate of the number of patients who would be entering at the start of the model in 2014. Of those, it is expected that 8.02%Citation4 will progress to the advanced (metastatic) stage of disease. Therefore, 2176 patients per year will enter the advanced stage of the disease. Everolimus is indicated only for patients who are post-menopausal and have the ER+/HER2− form of the disease. It is estimated that 54% of advanced breast cancer patients are post-menopausal and that, of these, 66% are ER+/HER2−Citation10. Therefore, the total number of patients eligible to be treated with everolimus is 776, and this is the total number of patients entering the model in 2014, the first year of the model. The incidence for years 2–5 was based on 3951 newly diagnosed patients per year, taken from 2012 official national statisticsCitation3. This was increased by an annual growth of 8.58%, which is the average of the growth in incidence from 2010–2011 and from 2011–2012, to estimate the incidence for 2014Citation3. This same growth was then applied in each subsequent year of the model to estimate the increasing incidence from years 2015–2018. Therefore, the estimated incident populations in years 2014–2018 were 4658, 5057, 5491, and 5952, respectively. The number of post-menopausal patients with advanced ER+/HER2− breast cancer was calculated using the same filters as used for the prevalent population in 2014, giving 133, 145, 157, and 170 newly diagnosed patients in 2015–2018, respectively, Of the newly diagnosed and eligible patients, it was assumed that 17.6% were receiving first-line treatment, 53.6% were receiving second-line treatment, and 28.8% were receiving third- or higher-line treatment (Novartis data on file).
The model uses current market share estimates to determine the total number of patients receiving each form of therapy in the base case modelCitation3. These are shown in . These market share figures are assumed to remain constant throughout the base case model (i.e., without the introduction of everolimus). To estimate the cost impact of introducing everolimus to the market, it was assumed that, for first- and second-line treatment, everolimus (plus letrozole or anastrozole) would gain 1% of the market share in the first year, 2% in the second year, and 3% in the third, fourth, and fifth years. For third-line therapy, everolimus was assumed to have zero uptake. For first-line therapy, the increase in the use of everolimus was assumed to be drawn proportionally from patients previously assigned to chemotherapy and tamoxifen. For second-line treatment, the increase was assumed to be drawn from patients assigned to chemotherapy.
Costs
To estimate the costs associated with each treatment, a number of different factors were considered. First, drug acquisition costs were accounted for based on the existing market share. Second, non-drug healthcare costs (e.g., monitoring, investigations, other treatments) were accounted for dependent upon the patient’s health status and severity of disease. Thus, the model accounts for different rates of progression-free survival (PFS) and overall survival (OS) rates associated with each treatment, drawn from published trialsCitation11. PFS and OS are used to calculate patients’ duration in each health state and the associated costs and are not used to calculate quality-adjusted life years (QALYs).
In order to allow extrapolation of PFS and OS beyond the observed trial period, parametric curves were statistically fitted to observed trial data. Extrapolation of the BOLERO-2-derived survival curve using parametric distributions (exponential, Weibull, log-normal, log-logistic, and Gompertz distributions) was performed and the goodness-of-fit examined.
Interim OS data were available up to 17 months from BOLERO-2 for everolimus + exemestane and exemestane alone, with a median follow-up of 16.2 monthsCitation6,Citation12. Kaplan-Meier curves for this period were used to calculate parametric curve fits. Thereafter, the parametric survival curves were used to extrapolate the trial data to give the 5-year survival data required for the model’s time horizon. In the base case the parametric function was applied for the whole of the model time horizon, rather than using the observed data, as data points were not available on a monthly basis, making the survival curve very ‘stepped’. A Weibull function was chosen for the base case, guided by feedback from expert clinicians, which indicated that the Weibull function had the highest clinical plausibility. The R-squared values for the Weibull fits were 0.935 and 0.950 for everolimus and comparator arms, respectively. To estimate the probability of death in each monthly cycle of the model, the following Weibull formula was used:
where t represents time and σ and λ represent the shape and scale parameters, respectively. This was used to calculate survival for each one1monthly cycle in the model.
Unlike the OS data the BOLERO-2 PFS data were available at monthly intervals. However, for consistency, the parametric curves were also applied throughout the model. As for OS, a Weibull function was applied in the base case, guided by feedback from expert clinical opinion. The extrapolations were based on PFS data up to 27 months for everolimus + exemestane and up to 22 months for exemestane alone. The R-squared values for the Weibull fits were 0.998 and 0.990 for everolimus and the comparator arm, respectively.
Data from the BOLERO-2 trial’s two arms (everolimus plus exemestane and exemestane alone) were assumed to be representative of the everolimus + letrozole/anastrozole and the letrozole/anastrozole groups in this model, respectively. PFS and OS data for the other comparators included in the model (i.e., chemotherapy and tamoxifen) were taken from published sources. Data for chemotherapy was based on docetaxel (19 month PFS data and 36 month OS data)Citation12. Data for tamoxifen were taken from Novartis data on file from the TAMRAD trial (27 month PFS and 40 month OS data). For consistency, the same approach was taken as for the BOLERO-2 data outlined above: parametric Weibull curves were applied throughout the model. The Weibull PFS and OS parameters and estimated mean PFS and OS for all interventions in the model are shown in .
Table 2. PFS and OS parameters.
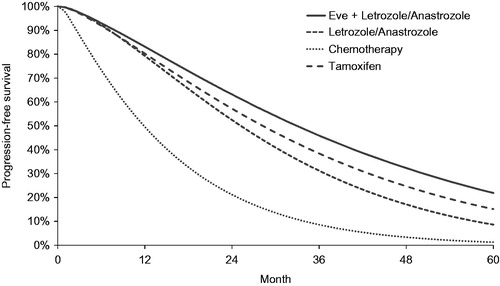
Probabilities for both progression and death are time-dependent. That is, a patient’s risk of mortality changes over time. Incorporation of time-dependence is standard for survival modeling in oncology and is accounted for within the parametric functions used to determine the transition probabilities within the modelCitation13. The PFS and OS curves assigned to each of the treatments are shown in and , respectively.
Figure 2. Progression-free survival curves.
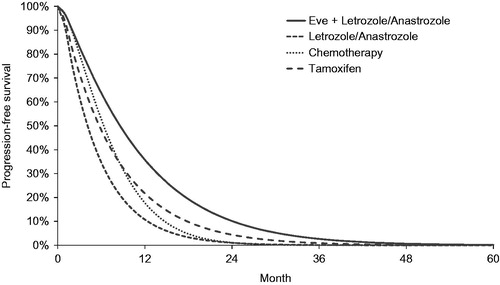
Figure 3. Overall survival curves.
Drug costs were applied to patients for the entire period that they remained in the progression-free health state. The drug costs per month are shown in , whilst the costs for chemotherapy are shown in . Average body surface area was assumed to be 1.72 m2 Citation14. Compliance was assumed to be 100% in all patients until disease progression. Costs associated with adverse events were also included within the model. Rates of grade 3 and 4 adverse events for each treatment were taken from published sourcesCitation8,Citation12,Citation15, and were assigned an individual cost per event, as shown in .
Table 3. Drug costs.
Table 4. Cost of chemotherapy regimes.
Table 5. Cost of adverse events.
Non-drug costs were also included in the model. Costs in the stable disease state comprise acquisition costs for active treatment (see above), cost of disease management including hospitalisations and testing, and adverse event costs (see above). In the stable disease state, costs are applied for as long as the patient stays in the pre-progressed state. Costs in the pre-progression health state differed between chemotherapy and the other interventions. The total cost per month for chemotherapy was based on the cost of supportive palliative care and was Т114,338. The cost for the other interventions was T7354. The breakdown of these costs is shown in . Pre-progression health state costs were taken from the Minister of Healthcare of the Republic of Kazakhstan Order No. 444Citation16.
Table 6. Progression-free health state costs.
Post-progressed resource use was also taken from the Minister of Healthcare of the Republic of Kazakhstan Order No. 444Citation16. The average monthly cost for the post-progressed state was based on the assumption that all patients would receive supportive palliative care and some patients would also receive therapy. The costs for supportive palliative care were the same for the post-progressed state as for those pre-progressed patients on chemotherapy. In addition, patients on chemotherapy incurred a cost of administration of T3562 per month. The different sequences of treatment and their weightings are shown in . Those patients receiving third line hormonal therapy in the post-progressed state were assumed to receive tamoxifen. Those patients receiving chemotherapy in the post-progressed state were also assigned a cost of T62,777 for additional palliative care (this cost was not applied to patients receiving chemotherapy in the pre-progressed state). It was assumed that a proportion of patients would receive active post-second-line chemotherapy, while a proportion would receive supportive palliative care only. Unit costs were taken from the Minister of Healthcare of the Republic of Kazakhstan Order No. 444Citation16. The background costs for the progression-free and post-progressed states are shown in .
Table 7. Post-progression treatment sequences.
Terminal care costs included hospital and hospice resource use and at home community support. The total cost per month was T19,974.
Sensitivity analyses
A range of sensitivity analyses were conducted, in which the following factors were varied: Progression and mortality for both everolimus and its comparators; AE rates for both everolimus and its comparators; costs of comparator treatments; market share of everolimus; prevalence and incidence of breast cancer. Because each of the sensitivity analyses varied several parameters simultaneously (e.g., costs across a range of comparator treatments), all of these, with the exception of average growth rate of morbidity of all patients, used a multiplication coefficient to vary the whole range of inputs. Thus, a multiplication coefficient of 1.0 implies that the parameters were not changed, whilst a coefficient of 1.5 suggests that all relevant parameters were increased by 50%.
Results
The 5-year results from the budget impact analysis are shown in . These demonstrate that the introduction of everolimus leads to a 12% increase in drug costs, a 2% reduction in pre-progression health state costs, a 1% increase in post-progression health state costs and a 2% reduction in adverse event costs. The net result is only a modest increase in total costs; a 2.69% increase of T201 million, from T7.5 billion to T7.7 billion over a period of 5 years.
Table 8. Budget impact analysis results.
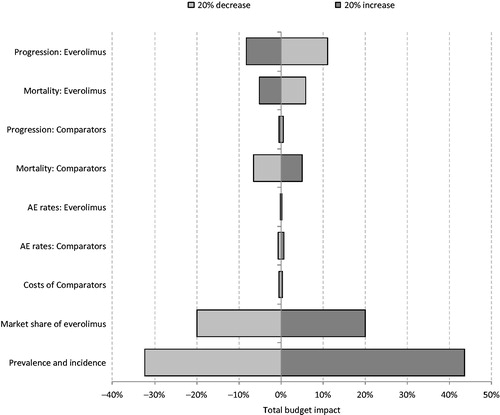
The results of the sensitivity analyses are shown in . The tornado diagram shows that the results of the model are particularly sensitive to the prevalence and incidence of breast cancer, the progression-free survival and overall survival of everolimus, and the overall survival of the comparators. When the prevalence and incidence of breast cancer are increased and decreased by 20%, the total budget impact is increased by 44% and decreased by 32%, respectively, to T289 million and T136 million. When the market share of everolimus was increased and decreased by 20% this resulted in a corresponding increase and decrease in the budget impact of 20%, as the magnitude of the budget impact was directly impacted. The absolute budget impact ranged from T241.6 million to T161.0 million, respectively, When progression on everolimus is decreased by 20% the total budget impact is increased by 11%, to T223.7 million. This is because, as progression-free survival is prolonged, patients remain on treatment for longer and consequently incur more costs. Conversely, when progression on everolimus is increased by 20% there is an 8% decrease in the total budget impact, to T184.9 million When mortality for everolimus is increased and decreased by 20% the budget impact changes by −5% and 6%, to T191 million and T213 million, respectively. This is due to the fact that cancer patients incur high resource use and so extended survival results in increased healthcare expenditure, whereas decreased survival results in reduced healthcare expenditure. Similarly, when the risk of mortality for the comparator interventions is increased and decreased by 20%, the total budget impact of everolimus changes by −6% and 5%, to T188 million and T211 million, respectively. This is because poorer survival for the comparator interventions means a reduction in background healthcare costs and so a higher incremental cost resulting from the introduction of everolimus. In the sensitivity analyses conducted, the total budget impact of introducing everolimus to the Kazakh healthcare system varied from T136 millon to T223 million. In all of these scenarios everolimus + letrozole/anastrozole resulted in increased costs to the Kazakh healthcare system. When considering the estimated percentage budget impact change after the introduction of everolimus there was little variation throughout the sensitivity analyses. In the base case the total budget for post-menopausal patients with advanced ER+/HER2− breast cancer was estimated to increase by 2.69% following the introduction of everolimus. In the sensitivity analyses conducted this value ranged from 2.15–3.23%.
Figure 4. Sensitivity analyses.
Discussion
This analysis has estimated the financial impact of introducing a new therapy, everolimus, as an adjunct to current treatments. The analysis includes drug acquisition costs as well as impact on the other healthcare resources, and accounts for disease progression and patient mortality. The model also accounts for new incident patients entering the model in future years. The analysis demonstrates that, although uptake of everolimus results in an increase in drug acquisition costs, this is almost entirely offset by savings in other healthcare resource use, despite a greater survival rate for patients receiving everolimus resulting in greater longer-term care and healthcare resource use.
As with all economic models, the analysis uses statistical techniques to present a simplified version of reality, while aiming to retain the key nuances of the disease progression and treatment pathways. For example, it was not possible to build in a treatment effect associated with post-second-line treatment, as there are no data on the efficacy of such treatments. However, since the OS curves were based on actual trial data (in which patients were treated with post-second-line therapy), the effect of such treatments would already be included.
Because the model includes all healthcare costs, rather than simply the cost of treatment, the analysis accounts for any costs incurred as a result of increased survival. Because everolimus results in increased PFS and OS (with the incremental OS being greater than the incremental PFS), there are substantial non-drug costs associated with its increased effectiveness. As the per-cycle costs for progressed disease are higher than for progression-free disease, the increase in survival in the progressed state results in increased non-drug costs for everolimus. Because of this, an economic analysis of any effective treatment for metastatic breast cancer will, ultimately, penalise those therapies that result in increased survival of patients and, as such, the budget impact results generated by such a model are not necessarily reflective of the cost of drug treatment alone.
In order for the model to calculate costs and benefits over a 5-year time horizon, PFS and OS were extrapolated beyond the trial period. This brings additional uncertainty into the model inputs. The robustness of the model would be improved if trial data of longer follow-up were available. However, the impact of varying the PFS and OS for everolimus and for the comparator interventions has been explored in sensitivity analysis. Of these four factors (PFS with everolimus + letrozole/anastrozole; PFS with comparators; OS with everolimus + letrozole/anastrozole; OS with comparators) it was found that comparator PFS had the smallest impact on the absolute budget impact and everolimus + letrozole/anastrozole had the largest impact. Despite this it was found that the impact of the introduction of everolimus on the relative budget change was very consistent, with the increase in total budget following its introduction ranging from 2.47–2.99%.
In addition to the uncertainty due to extrapolation there is uncertainty around a number of the model inputs. For example, as the model is a projection over the next 5 years, by definition the market share for everolimus in these years is unknown and so assumptions from experts had to be used. It is likely that, if everolimus were to gain a higher market share than is estimated in the current model, the incremental budget impact would be higher. The distribution of patients over first-, second-, and third-line therapy was also unknown and so was based on Novartis data on file. To explore this uncertainty a number of sensitivity analyses were conducted. It was found that, when varying key inputs by ±20% the results of the model did not change greatly. The absolute budget impact of the model varied between T136 millon to T223 million. The relative impact of introducing everolimus to the market ranged from a 2.15% to a 3.23% increase on total costs.
Conclusion
This analysis has demonstrated that, if everolimus were to be introduced to the Kazakh healthcare market for the treatment of advanced breast cancer, there would be minimal impact upon overall healthcare expenditure. An increase in drug acquisition costs was almost exactly offset by a reduction in other healthcare due to improved management of the disease. Sensitivity analysis demonstrated the model is most sensitive to the probability of progression for patients on everolimus and the probability of mortality for the other interventions.
Transparency
Declaration of funding
LL & MT’s employer, York Health Economics Consortium, received funding for health economics consultancy from Novartis Pharma AG.
Declaration of financial/other relationships
York Health Economics Consortium receives funding for conducting health economics research and consultancy. JME peer reviewers on this manuscript have no relevant financial or other relationships to disclose.
References
- World Health Organisation. Global Health Estimates 2010–2011. Geneva, Switzerland 2014 http://www.who.int/healthinfo/global_burden_disease/estimates_regional/en/. Accessed 05/06/14
- Ferlay J, Soerjomataram I, Ervik M, et al. GLOBOCAN 2012 v1.0, Cancer incidence and mortality worldwide: IARC Cancer Base No. 11 [Internet]. Lyon, France: International Agency for Research on Cancer, 2013. http://globocan.iarc.fr. Accessed 05/06/2014
- Nurgaziyev K Sh, Seytkazina GD, Baypeisov DM, et al. 2012 Indicators of oncological service of the Republic of Kazakhstan for 2012. Ministry of Health, Kazakhstan, 2012
- Cardoso F, Harbeck N, Fallowfield L, et al. European Society for Medical Oncology Clinical Practice Guidelines. Annals of Oncology 2012;23(7 Suppl):vii7-173
- National Institute for Health and Clinical Excellence. Advanced breast cancer: diagnosis and treatment. Full guideline. CG81. London: NICE, 2009
- National Institute for Health and Clinical Excellence. Guidance on the use of trastuzumab for the treatment of advanced breast cancer. TA34. London: NICE, 2002
- Boulay A, Zumstein-Mecker S, Stephen C, et al. Antitumor efficacy of intermittent treatment schedules with the rapamycin derivative RAD001 correlates with prolonged inactivation of ribosomal protein S6 kinase 1 in peripheral blood mononuclear cells. Cancer Res 2004;64:252-61
- Piccart M, Noguchi S, Pritchard KI, et al. ASCO Annual Meeting, June 1-5 2012, Chicago, IL
- Baselga J, Campare M, Piccart M, et al. Everolimus in postmenopausal hormone-receptor-positive advanced breast cancer. NEJM 2012;336:520-9
- Beaver J, Park B. The BOLERO-2 trial: the addition of everolimus to exemestane in the treatment of postmenopausal hormone receptor-positive breast cancer. Future Oncol 2012;8:651-7
- DataMonitor. Epidemiology: breast cancer. In: McGuill M, ed. Epidemiology series. Datamonitor, London, UK, 2010
- European Medicines Agency. Assessment Report 2012. London, UK 2012. Afinitor. EMEA/H/C/001038/II/0020
- Sjostrom J, Blomqvist C, Mouridsen H, et al. Docetaxel compared with sequential methotrexate and 5-fluorouracil in patients with advanced breast cancer after anthracycline failure: a randomised phase III study with crossover on progression by the Scandinavian Breast Group. Eur J Cancer 1999;35:1194-201
- Latimer N. NICE DSU Technical Support Document 14: undertaking survival analysis for economic evaluations alongside clinical trials - extrapolation with patient-level data. Sheffield, UK: University of Sheffield, 2011
- Sacco J, Botten J, Macbeth F, et al. The average body surface area of adult cancer patients in the UK: a multicentre retrospective study. PLoS One 2010;5:e8933
- Bachelot T, Bourgier C, Cropet C, et al. Randomized phase II trial of everolimus in combination with tamoxifen in patients with hormone receptor-positive, human epidermal growth factor receptor 2-negative metastatic breast cancer with prior exposure to aromatase inhibitors: a GINECO study. J Clin Oncol 2012;30(22):2718-24
- Order of Chairman of the Board of ‘SK-Pharmaceuticals’ LLP No. 06/62 as of June 10, 2013
- Minister of Health. Attachment 1, 2 to Minister of Healthcare of the Republic of Kazakhstan Order No. 444 as of July 1, 2011. Kazakhstan: Ministry of Health, 2013