
Abstract
Objective:
To evaluate the costs and outcomes associated with different sequences of oral anti-muscarinic agents and the selective β3-adrenoceptor agonist, mirabegron, for the treatment of overactive bladder (OAB).
Methods:
A Markov model with monthly cycle length and time horizon up to 3 years was designed to compare two different sequences of up to three lines of oral therapy for OAB. Patients who discontinued one oral medication could switch to another oral medication or could discontinue treatment. Patients whose symptoms were not controlled were considered for botulinum toxin or sacral nerve stimulation. Outcomes were measured by (a) number of patients with controlled symptoms (no incontinence episodes and <8 micturitions per 24 h); (b) patients with no incontinence episodes per 24 hours; and (c) patients with <8 micturitions per 24 h.
Results:
Including a third-line oral medication before considering other treatment options improved all patient outcomes, irrespective of the specific drugs used. A three-line sequence including two generic (oxybutynin first line and tolterodine extended-release second line) and one branded drug (solifenacin 5 mg third line) resulted in inferior patient outcomes at costs similar to a sequence of branded drugs (mirabegron first line, solifenacin 5 mg second line, solifenacin 10 mg third line): controlled patients (generic 29.6/1000 vs branded 38.7/1000); patients with no incontinence episodes (103.6/1000 vs 123.7/1000); patients with <8 micturitions (228.7/1000 vs 262.1/1000). Annual treatment costs per patient were similar (generic £1299 vs branded £1385).
Conclusions:
In the treatment of OAB, low-cost generic treatments are not necessarily more cost-effective than branded drugs, primarily because a better efficacy and tolerability balance improves both symptom control and persistence.
Introduction
Overactive bladder (OAB) is a symptom-defined condition characterized by urinary urgency, usually with urinary frequency and nocturia, and possibly accompanied by urgency incontinenceCitation1; the latter symptom is reported less frequently than urinary frequency and urgencyCitation2. In 2008, OAB was estimated to affect >450 million people worldwide and the incidence was projected to increaseCitation3; its prevalence increases with age and in Europe OAB affects ∼30–40% of those aged >75 yearsCitation2. The symptomatic burden of OAB is significant, with symptoms disrupting daily activities, sleep, mental health, and personal relationshipsCitation4,Citation5. Furthermore, OAB symptoms have a negative impact on health-related quality-of-life (HRQoL)Citation4,Citation6,Citation7, and there is evidence that comorbidities such as depression, fractures, skin infections, and urinary tract infections may be associated directly with OABCitation8. In the US, the cost of OAB was estimated to be $65.9 billion in 2010, with $49.1 billion of direct medical costs; this was projected to increase to $76.2 billion and $82.6 billion in 2015 and 2020, respectivelyCitation9.
Therapy for OAB includes conservative management (e.g., bladder training, electrical stimulation), pharmacotherapy, botulinum toxin (BTX), and/or surgery (e.g., sacral nerve stimulation) for those in whom pharmacotherapy failsCitation10. Pharmacotherapy for OAB has historically involved the use of anti-muscarinic agents (e.g., oxybutynin, tolterodine, and solifenacin), which can improve symptoms such as incontinence and micturition frequency but are not curative and, therefore, require long-term useCitation10–14. However, these agents are associated with side-effects such as dry mouth, blurred vision, and constipationCitation12,Citation13,Citation15. These side-effects negatively affect persistence on therapyCitation16, although persistence rates differ and appear to be better with agents such as solifenacinCitation17,Citation18. Effective control of symptoms by these agents also affects persistence, with studies showing that dissatisfaction with treatment outcomes is a common reason for treatment discontinuationCitation19,Citation20. Furthermore, lack of persistence, switching therapy, and the need for specialist care to manage OAB are all associated with additional costs, increased resource use, including additional healthcare visits, and the cost of secondary interventions.
Mirabegron is a first-in-class selective β3-adrenoceptor agonist approved for the treatment of OABCitation21. In the randomized phase III SCORPIO trial, in which 1978 patients with OAB were randomized to placebo, mirabegron or tolterodine daily for 12 weeks, mirabegron significantly reduced the number of incontinence episodes and the number of micturitions in 24 h in patients with OAB compared with placeboCitation22. Furthermore, mirabegron had a different tolerability profile to tolterodine, and was associated with rates of dry mouth similar to those observed with placeboCitation22.
Drug purchase costs for mirabegron are generally similar to those for branded anti-muscarinic agents and higher than those for generic anti-muscarinic agents. These costs are an important consideration when deciding whether a new agent should be used in clinical practice, especially for a chronic disease. However, it is also essential to consider many other factors, including efficacy, side-effect management, and medication adherence, as well as therapy used throughout the course of diseaseCitation23. While previous analyses have evaluated the costs of individual drug therapies for OAB, costs of sequences of drugs incorporating recently approved agents such as mirabegron have not been evaluated. The objective of this study was to quantify the costs and outcomes associated with different sequences of oral anti-muscarinic agents and a β3-adrenoceptor agonist from the perspective of the UK National Health Service.
Methods
Model
A Markov model with a monthly cycle length and a time horizon of 12, 24, and 36 months was developed to compare different sequences of up to three lines of oral therapy for OAB. The model estimates the number of patients with controlled symptoms, the number having a secondary intervention, resource use (such as general practitioner [GP] or urologist visits), and costs for the total patient cohort. The population considered was that of patients with OAB aged ≥40 years and currently receiving anti-muscarinic therapy. In the UK, the percentage of the population aged ≥40 years was estimated to be 49.29%Citation24, the prevalence of OAB 19.0%Citation2, and the proportion of patients on therapy 27.0%Citation2.
The perspective of the base case model was the UK National Health Service, and outcomes were computed for 1 year.
Model structure and assumptions
In each month of the analysis, patients could be on treatment with controlled symptoms, on treatment with uncontrolled symptoms, or off-treatment. Symptoms were considered controlled if patients had no incontinence episodes and <8 micturitions per 24 h. It was assumed that patients remained on current treatment (first-, second-, or third-line) for a minimum of 1 month. Treatments in the model acted to reduce the number of micturitions and incontinence episodes, with the size of effect based on available efficacy data from clinical studies. In each month, patients could discontinue therapy due to side-effects or lack of efficacy, switch to a different drug (up to three lines) or withdraw from therapy altogether; patients who withdraw from therapy may be referred to a urologist and may receive a secondary intervention, e.g., BTX or sacral nerve stimulation. Healthcare resource utilization differed depending on whether patient’s symptoms were controlled or uncontrolled (). Data on resource use and costs were derived from extensive literature searches; expert opinion was used where information was missing. Patient outcomes were determined based on the number of patients whose symptoms were controlled according to the definition above.
Table 1. Resource use and costs.
Inputs
The proportion of patients controlled with the various treatments, i.e., who had no incontinence episodes and <8 micturitions daily (), was calculated using published data for the mean baseline value and mean change from baseline value for micturition and incontinence episodes per 24 h for each treatment. Following the approach described by Cardozo et al.Citation25, Poisson distributions were used to simulate the proportion of patients who experienced micturitions and incontinence episodes over a 24-h period from the mean number of micturitions and incontinence episodes reported per 24-h period for each treatment. Poisson distributions are discrete probability distributions expressing the probability of a number of events occurring in a fixed period, assuming that events occur independently of the time since the last event and at a known average rate.
Table 2. Efficacy inputs.
The baseline mean for number of micturitions (11.19) and incontinence episodes (3.51) per 24 h, as reported by Cardozo et al.Citation25, were used, and the mean change from baseline for each treatment was subtracted from the baseline mean to derive the mean number of micturitions or incontinence episodes on each treatment. For mirabegron, the mean change from baseline was based upon a weighted average from four placebo-controlled phase II or III trials of mirabegron (SCORPIO, ARIES, CAPRICORN, and CL-045)Citation22,Citation26,Citation27. For all other treatments, data on the difference compared with mirabegron reported in a mixed treatment comparisonCitation28 were added to the weighted average for mirabegron to derive the mean change in number of micturitions and incontinence episodes per 24 h.
It was assumed that micturition and incontinence episode outcomes were independent of each other; therefore, the percentage of patients with both <8 micturitions and no incontinence episodes per 24 h, i.e., those considered controlled, was calculated as:
Costs were driven by three main factors: drug costs, which were sourced from the British National Formulary 2012Citation29 and calculated for 30 days of therapy (); costs of switching therapy, a function of the discontinuation rate for each drug as measured by persistence (the better the persistence, the lower the discontinuation rate), and including the cost of GP visits (); and the cost of uncontrolled symptoms, which is a function of treatment efficacy and includes urologist consultations and non-pharmacological interventions. Persistence rates for all agents except mirabegron and fesoterodine were calculated using real-world data from Gopal et al.Citation30, fitting parametric curves based on Weibull (first line therapy) and exponential (later lines of therapy) distributions to these data, and using these to calculate discontinuation rates. Data for fesoterodine were derived from reports of discontinuation rates in a clinical trial of fesoterodine vs tolterodineCitation14; data for mirabegron were derived from discontinuation rates in phase II and III trials reported in the Betmiga European Core Value Dossier [Astellas, data on file].
Table 3. Drug costs*.
The cost of GP visits was derived from the Personal Social Services Research UnitCitation31 for 2010 and inflated to 2012 prices using the Consumer Price Index (an inflation rate of 7.86% was used)Citation32. The cost of urologist outpatient consultations was sourced from the NHS Reference Costs for 2011–2012Citation33. Costs of uncontrolled symptoms included falls leading to fractures, depression, and skin or urinary tract infectionsCitation32–35; costs of pads used were also considered (). Probabilities of co-morbidities including depression, fractures, skin infections, and urinary tract infections were adapted from the cost-effectiveness model published by Arlandis-Guzman et al.Citation36 ().
Table 4. Probabilities of and cost of managing comorbiditiesCitation34.
The adverse events (AEs) considered were dry mouth, blurred vision, and constipation. No costs were associated with these AEs.
Model base case
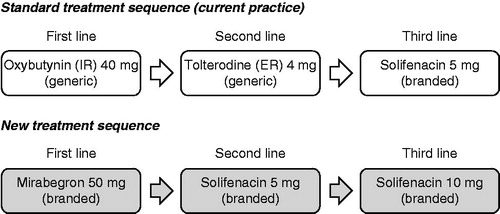
In the base case analysis, a sequence reflecting current practice in the treatment of OAB and the available UK National Institute for Health and Care Excellence guidelines was selectedCitation37,Citation38; the selection of the agents for this sequence was based on use in the UK [unpublished data]. This sequence was compared to a new treatment sequence incorporating recently approved agents on the assumption that patients need treatment with drugs with additional efficacy (). Costs and outcomes were computed for a 1-year time horizon. Discounting was not considered.
Figure 1. Treatment sequences compared. ER, extended release; IR, immediate release.
Sensitivity analysis
A deterministic (one-way) sensitivity analysis was conducted by varying individual parameters and assessing the change in base-case results. The parameters varied were: efficacy of new treatment sequence; discontinuation rates with new treatment sequence; cost of new treatment sequence; lifetime risk of secondary intervention; and cost of secondary intervention. Each parameter was varied by ±20%.
Results
Including a third-line oral medication before considering other treatment options improved all patient outcomes, irrespective of the specific drugs used (data not shown).
The resulting patient outcomes from comparing the sequences shown in , based on 100% of 1000 patients switching from the standard to the new treatment sequence, are shown in . The number of patients whose symptoms were controlled (i.e., <8 micturitions and no incontinence episodes per 24 h) was increased with the new sequence; there was a concomitant decrease in the number of patients needed to treat in order for one patient’s symptoms to be controlled ().
Table 5. Patient outcomes per 1000 patients treated.
Resource use and associated costs for the treatment sequences are shown in . The numbers of incontinence pads used, specialist visits, surgical interventions and co-morbidities were all reduced with the new treatment sequence compared to the standard treatment sequence, with a concomitant impact on costs. However, the mean duration on therapy for the new treatment sequence is longer than with the standard sequence, which, combined with the higher cost of the drugs in the new treatment sequence, leads to higher overall drug costs. Therefore, the new treatment sequence is associated with costs of £1385/patient compared to £1299/patient with the standard treatment sequence ().
Table 6. Cost and resource use per 1000 patients treated.
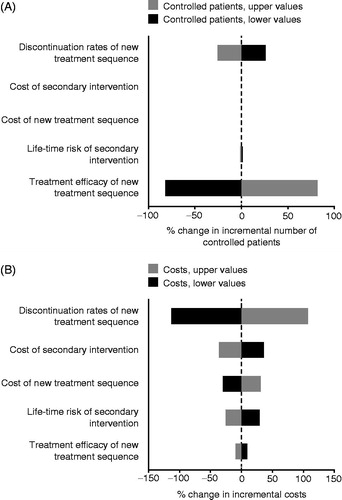
The results of the sensitivity analysis are shown in . These demonstrated that the costs are most sensitive to the discontinuation rates of the new treatment sequence.
Figure 2. Tornado diagram showing results of the deterministic sensitivity analysis in which each parameter was separately varied by 20%. (a) Percentage change in incremental number of controlled patients; (b) percentage change in incremental costs.
Discussion
Current UK guidelines continue to recommend initial anti-muscarinic therapy for people with OABCitation37,Citation38. Furthermore, these guidelines recommend that, if initial therapy is not effective or not well tolerated, another drug with the lowest acquisition cost should be offeredCitation35. In contrast, mirabegron is recommended as an option for treating the symptoms of OAB only for people in whom anti-muscarinic drugs are contraindicated or clinically ineffective, or in whom they have unacceptable side-effectsCitation39. To examine the cost-consequences of this approach when the full sequence of therapy is considered, we developed a tool that considers the cost of both pharmacological therapy and secondary interventions, discontinuation, comorbidities, resource use, and utilities. This tool can be used to compare outcomes and costs for any sequence of three of the available pharmacological agents over a period of 1–3 years.
By comparing a treatment sequence consisting of low-cost generic treatments with one incorporating branded agents such as mirabegron, the model demonstrates that it is not necessarily more cost-efficient to use generic therapies. In this analysis, a sequence consisting of two generic agents and a third-line branded agent was less effective than and was associated with costs similar to a sequence consisting of three branded agents. This is primarily a result of the efficacy and tolerability balance of the drugs used in the sequence of branded agentsCitation22,Citation26,Citation27, which is better than that of standard therapy. These drugs are also associated with better persistence and, therefore, lower overall treatment costsCitation17. This conclusion is supported by the sensitivity analysis, which demonstrated that costs are most sensitive to the treatment persistence rate. For the majority of the agents included in the model, persistence rates are based on real-world data and are, therefore, more reflective of real-world practice. However, persistence rates for fesoterodine and mirabegron are based on data from clinical trials, which may not reflect the real-world situation. This approach was necessary because of the lack of real-world data for these agents. As tolterodine was either a comparator or active control in the trials used to calculate persistence, we were able to establish that the persistence rates were comparable to the reported real-world data for tolterodine.
Patients were able to switch treatments after 30 days. This is in line with current treatment guidelines, which recommend that patients should be informed that they may not experience the full benefits of treatment until they have been taking therapy for 4 weeksCitation38. However, these guidelines also recommend that patients should be offered a review of therapy before 4 weeks if the AEs of treatment are intolerable. Our estimates of persistence also suggest that a proportion of patients stop therapy prior to 30 days. Using a minimum 30-day duration of therapy, therefore, does not reflect clinical practice for a proportion of patients.
In contrast to the potential limitation around persistence, the model can be considered to be comprehensive because of the inclusion of multiple factors that affect the overall economic burden of OAB in addition to the direct cost of therapy, including the cost of incontinence pads, the cost of GP and specialist consultations, and the cost of associated comorbidities arising due to lack of control of OAB. Such costs have a significant impact on the overall cost of managing disease. However, we did not include the impact of OAB on work-related productivity, which has been shown to be reduced by conditions related to OAB such as nocturiaCitation40. Including lost-productivity costs may lead to further cost-savings associated with the new treatment sequence due to its improved disease control. In a previous cost-effectiveness study in OAB, results were consistent with the base case when productivity-related costs were excludedCitation36.
Several other limitations should be noted. First, we did not include data relating to another important benefit of therapy for OAB, that is its impact on HRQoL. As noted, urinary frequency, urgency, and urgency incontinence have all been shown to have a significant negative effect on HRQoL, with those who are incontinent appearing to have worse HRQoL than those who are continent but have other symptoms of OABCitation4,Citation6. Although we did not include a direct measure of HRQoL, our assessment includes a measure combining both urinary frequency and incontinence episodes, both of which are determinants of HRQoL. Second, it was not possible based on available data to use precise estimates of the efficacy of agents when administered in patients who had failed prior therapy, whether a specific agent or prior therapy in general. Therefore, we used first-line efficacy data for all lines of therapy. Third, data for the prevalence of OAB and the proportion of patients treated were taken from a study reported in 2001 and may be out of date. Up-to-date data could not be identified; such data would affect the overall cost of therapy, but not the incremental cost per patient or patient outcomes and, therefore, do not affect the overall conclusions.
Despite the limitations discussed, we believe that we have developed a simple, interactive tool that can be used to estimate the cost of using different sequences of available therapies for OAB. It has been designed so that users can select the treatment sequences to be compared, adapt inputs including the size of the treated population, and allow costs and resource consequences to be calculated for between 1–3 years.
Conclusion
Application of the tool to two specific sequences of therapy in the UK illustrates that the generic, lower-cost therapy sequences recommended by UK guidelines may not be a better strategy for the treatment of OAB than the use of branded agents. This is due to the better persistence of branded agents, which is linked to improved efficacy and HRQoL benefits, with a positive impact on resource use and other non-drug-related costs. This demonstrates that real-world disease management-related costs need to be considered when making therapeutic recommendations to ensure that benefits to patients are maximized and that funds are spent in the most efficient manner.
Transparency
Declaration of funding
The model described was developed by HERON Commercialisation, PAREXEL, with funding from Astellas Pharma Europe, Ltd. Employees of Astellas Pharma Europe, Ltd, helped to author the manuscript. All authors contributed to the study design and methodology, interpretation of the results, development and writing of the draft manuscript, and approved the final version.
Declaration of financial/other relationships
JN, IO, and AG are employed by Astellas Pharma Europe, Ltd. ZH is employed by Astellas Pharma Global Development. JP and AW are employed by HERON Commercialisation, PAREXEL, and were contracted by Astellas Pharma Europe, Ltd, to prepare the model used in this research.
Acknowledgments
Medical writing support was provided by Andy Noble of Bioscript Medical, and was funded by Astellas Pharma Europe, Ltd. This study was presented in part at the International Society for Pharmacoeconomics and Outcomes Research (ISPOR) 16th Annual European Congress, Dublin, Ireland, November 2–6, 2013.
References
- Abrams P, Artibani W, Cardozo L, et al. Reviewing the ICS 2002 terminology report: the ongoing debate. Neurourol Urodyn 2009;28:287
- Milsom I, Abrams P, Cardozo L, et al. How widespread are the symptoms of an overactive bladder and how are they managed? A population-based prevalence study. BJU Int 2001;87:760-6
- Irwin DE, Kopp ZS, Agatep B, et al. Worldwide prevalence estimates of lower urinary tract symptoms, overactive bladder, urinary incontinence and bladder outlet obstruction. BJU Int 2011;108:1132-8
- Coyne KS, Payne C, Bhattacharyya SK, et al. The impact of urinary urgency and frequency on health-related quality of life in overactive bladder: results from a national community survey. Value Health 2004;7:455-63
- Tubaro A. Defining overactive bladder: epidemiology and burden of disease. Urology 2004;64(Suppl 6A):2-6
- Liberman JN, Hunt TL, Stewart WF, et al. Health-related quality of life among adults with symptoms of overactive bladder: results from a U.S. community-based survey. Urology 2001;57:1044-50
- Robinson D, Pearce KF, Preisser JS, et al. Relationship between patient reports of urinary incontinence symptoms and quality of life measures. Obstet Gynecol 1998;91:224-8
- Brown JS, McGhan WF, Chokroverty S. Comorbidities associated with overactive bladder. Am J Manag Care 2000;6(11 Suppl):S574-9
- Ganz ML, Smalarz AM, Krupski TL, et al. Economic costs of overactive bladder in the United States. Urology 2010;75:526-32
- Gormley EA, Lightner DJ, Burgio KL, et al. Diagnosis and treatment of overactive bladder (non-neurogenic) in adults: AUA/SUFU guideline. J Urol 2012;188(6 Suppl):2455-63
- Ohtake A, Sato S, Sasamata M, et al. The forefront for novel therapeutic agents based on the pathophysiology of lower urinary tract dysfunction: ameliorative effect of solifenacin succinate (Vesicare), a bladder-selective antimuscarinic agent, on overactive bladder symptoms, especially urgency episodes. J Pharmacol Sci 2010;112:135-41
- Anderson RU, MacDiarmid S, Kell S, et al. Effectiveness and tolerability of extended-release oxybutynin vs extended-release tolterodine in women with or without prior anticholinergic treatment for overactive bladder. Int Urogynecol J Pelvic Floor Dysfunct 2006;17:502-11
- Chapple CR, Rechberger T, Al-Shukri S, et al. Randomized, double-blind placebo- and tolterodine-controlled trial of the once-daily antimuscarinic agent solifenacin in patients with symptomatic overactive bladder. BJU Int 2004;93:303-10
- Herschorn S, Swift S, Guan Z, et al. Comparison of fesoterodine and tolterodine extended release for the treatment of overactive bladder: a head-to-head placebo-controlled trial. BJU Int 2009;105:58-66
- Zinner N, Tuttle J, Marks L. Efficacy and tolerability of darifenacin, a muscarinic M3 selective receptor antagonist (M3 SRA), compared with oxybutynin in the treatment of patients with overactive bladder. World J Urol 2005;23:248-52
- Sexton CC, Notte SM, Maroulis C, et al. Persistence and adherence in the treatment of overactive bladder syndrome with anticholinergic therapy: a systematic review of the literature. Int J Clin Pract 2011;65:567-85
- Wagg A, Compion G, Fahey A, et al. Persistence with prescribed antimuscarinic therapy for overactive bladder: a UK experience. BJU Int 2012;110:1767-74
- Veenboer PW, Bosch JL. Long-term adherence to antimuscarinic therapy in everyday practice: a systematic review. J Urol 2014;191:1003-8
- Benner JS, Nichol MB, Rovner ES, et al. Patient-reported reasons for discontinuing overactive bladder medication. BJU Int 2009;105:1276-82
- Campbell UB, Stang P, Barron R. Survey assessment of continuation of and satisfaction with pharmacological treatment for urinary incontinence. Value Health 2008;11:726-32
- Imran M, Najmi AK, Tabrez S. Mirabegron for overactive bladder: a novel, first-in-class beta3-agonist therapy. Urol J 2013;10:935-40
- Khullar V, Amarenco G, Angulo JC, et al. Efficacy and tolerability of mirabegron, a β(3)-adrenoceptor agonist, in patients with overactive bladder: results from a randomised European-Australian phase 3 trial. Eur Urol 2013;63:283-95
- Balkrishnan R, Bhosle MJ, Camacho FT, et al. Predictors of medication adherence and associated health care costs in an older population with overactive bladder syndrome: a longitudinal cohort study. J Urol 2006;175:1067-71
- Office for National Statistics UK. Population estimates for England and Wales, Mid 2011. Table 3 – Mid-2011 population estimates: England and Wales; estimated resident population by single year of age and sex; based on the results of the 2011 Census. 2012. ONS is in Newport, South Wales. http://www.ons.gov.uk/ons/publications/re-reference-tables.html?edition=tcm%3A77-262039. Accessed June 20, 2014
- Cardozo L, Thorpe A, Warner J, et al. The cost-effectiveness of solifenacin vs fesoterodine, oxybutynin immediate-release, propiverine, tolterodine extended-release and tolterodine immediate-release in the treatment of patients with overactive bladder in the UK National Health Service. BJU Int 2010;106:506-14
- Herschorn S, Barkin J, Castro-Diaz D, et al. A phase III, randomized, double-blind, parallel-group, placebo-controlled, multicentre study to assess the efficacy and safety of the β3 adrenoceptor agonist, mirabegron, in patients with symptoms of overactive bladder. Urology 2013;82:313-20
- Nitti VW, Auerbach S, Martin N, et al. Results of a randomized phase III trial of mirabegron in patients with overactive bladder. J Urol 2013;189:1388-95
- Maman K, Aballea S, Nazir J, et al. Comparative efficacy and safety of medical treatments for the management of overactive bladder: a systematic literature review and mixed treatment comparison. Eur Urol 2013;65:755-65
- British National Formulary, 2012. London. http://www.bnf.org/bnf/index.htm. Accessed December 2013
- Gopal M, Haynes K, Bellamy SL, et al. Discontinuation rates of anticholinergic medications used for the treatment of lower urinary tract symptoms. Obstet Gynecol 2008;112:1311-18
- Personal Social Services Research Unit. Unit Costs of Health and Social Care. 2010. ONS is in Newport, South Wales. http://www.pssru.ac.uk/pdf/uc/uc2010/uc2010_s10.pdf. Accessed June 20, 2014
- Office for National Statistics UK. Consumer Price Indices, September 2012. Statistical Bulletin 2012:1-28
- UK Reference Costs 2011–2012. UK Department of Health, London, UK. http://www.dh.gov.uk/prod_consum_dh/groups/dh_digitalassets/@dh/@en/documents/digitalasset/dh_133578.xls. Accessed June 20, 2014
- Eurostat. Purchasing power parities (PPs), price level indices and real expenditures for ESA95 aggregates. 2012. eurostat, Luxembourg. http://appsso.eurostat.ec.europa.eu/nui/show.do?dataset=prc_ppp_ind&lang=en. Accessed June 20, 2014
- Irwin DE, Mungapen L, Milsom I, et al. The economic impact of overactive bladder syndrome in six Western countries. BJU Int 2009;103:202-9
- Arlandis-Guzman S, Errando-Smet C, Trocio J, et al. Cost-effectiveness analysis of antimuscarinics in the treatment of patients with overactive bladder in Spain: a decision-tree model. BMC Urol 2011;11:9
- National Institute for Health and Care Excellence. Clinical Guidelines. Urinary incontinence (CG40). 2006. NICE, London. http://www.nice.org.uk/CG40. Accessed June 20, 2014
- National Collaborating Centre for Women’s and Children’s Health. Urinary incontinence in women: the management of urinary incontinence in women. London. http://www.ncc-wch.org.uk/guidelines/guidelines-programme/guidelines-programme-published/urinary-incontinence/. Accessed September 2013
- National Institute for Health and Care Excellence. Technology appraisals. Overactive bladder – mirabegron (TA290). 2013. NICE, London. http://guidance.nice.org.uk/TA290. Accessed June 20, 2014
- Kobelt G, Borgstrom F, Mattiasson A. Productivity, vitality and utility in a group of healthy professionally active individuals with nocturia. BJU Int 2003;91:190-5