
Abstract
Objectives:
The buprenorphine/naloxone combination for the treatment of opioid dependence is available in a film or tablet formulation. Recent retrospective studies demonstrated that treatment with the sublingual film formulation is associated with improved treatment retention and lower healthcare costs. In March 2013, generic buprenorphine/naloxone tablets were approved in the US. A budget impact model was built to compare healthcare expenditures for different market shares of sublingual film and tablet.
Methods:
A Markov model was developed to track a cohort of opioid dependent patients treated with sublingual film or tablet through the following treatment phases: initiation, maintenance, discontinuation, off-treatment and reinitiation. Transition probabilities and costs for each phase were estimated from the MarketScan Medicaid database for the period between 1 March 2010 and 30 June 2012. The total expenditure for the plan and expenditure per plan member per month were predicted over 5 years. Two market share scenarios were considered: 1) sublingual film is progressively replaced by generic tablet (current situation) and 2) the sublingual film holds a market share of 100%.
Results:
Predicted total costs over 5 years were $6400 million when the sublingual film holds a market share of 100% (as per Scenario 2) which is lower than when sublingual film is progressively replaced by generic tablet (current situation as per Scenario 1) by $64 million. These savings were mostly driven by inpatient care ($56 million saved over 5 years), followed by emergency room care ($27 million) and pharmaceutical costs ($24 million). Costs of outpatient care attenuated the difference as they were predicted to be higher by $44 million in Scenario 2. The reduction in total cost per member per month reached $0.027 in the fifth year. Results were most sensitive to price rebates and to the probability of non-psychiatric hospitalization.
Conclusions:
While using the sublingual film formulation for more patients treated with buprenorphine/naloxone is predicted to increase outpatient care costs, it would generate savings in emergency care and hospitalizations. In the treatment of opioid dependence, total direct medical costs for Medicaid would be lower for sublingual film treated patients, at current drug prices.
Introduction
Opioid dependence is a chronic, relapsing brain disorder characterized by the repeated, compulsive seeking or use of an opioid despite adverse social, psychological, and/or physical consequencesCitation1. It includes dependence on prescription pain medications, heroin and other illicit opioid agonistsCitation2–3 and is often associated with mental disorders, depression, blood-borne infections, and poisoningCitation4–10. Opioid dependence is a major medical and social concern throughout the world, contributing to excessive morbidity, mortality, disability, and economic costs. Mortality risks are higher for opioid abusers, even compared to other drugs users; opioid overdose is the second leading cause of accidental death in the US and has been labeled a national epidemicCitation11. In 2009, there were approximately 1.9 million individuals in the US with dependence on or abuse of opioid analgesics and 400,000 individuals with dependence on or abuse of heroinCitation12, and the prevalence and related hazards of opioid use have been increasing steadilyCitation13,Citation14.
As a relapsing disorder that often requires long-term treatment and careCitation15, opioid dependence represents a substantial economic burden, including the cost of treatment and the increased use of other healthcare resources, especially costly inpatient careCitation7,Citation9,Citation10. In the US, total charges associated with emergency department and hospital inpatient care for opioid-related events were estimated at $9.5 billion in 2008Citation16.
Existing medications for treating opioid dependence in the US are methadone and buprenorphine, the latter being available in a mono formulation or in combination with naloxoneCitation17. These treatments are prescribed for opioid addiction. The buprenorphine/naloxone combination is approved in the US for the treatment of opioid dependence. The role of naloxone is to block the effects of any opiate and prevent parenteral abuse of the buprenorphine. Buprenorphine was initially commercialized by Reckitt Benckiser Pharmaceuticals Inc. as Suboxone , which was first formulated as a sublingual tablet (approved in the US in October 2002) and is now available as a sublingual film (approved in the US in September 2010). The sublingual film formulation has been shown to be associated with a reduction in accidental pediatric exposureCitation18, and a reduction in diversion and abuseCitation19. The sublingual film technology was developed and packaged in a single, child resistant unit dose and numbered packages intended to reduce misuse and diversion rates. Although there are only very few studies available in this area, earlier retrospective studies based on insurance claims data showed that treatment with Suboxone sublingual film is associated with better treatment retention as well as lower healthcare costs in all treatment phases (initiation, treatment, discontinuation, off-treatment and reinitiation) compared to treatment with buprenorphine/naloxone tabletsCitation20,Citation21. In a study based on Medicaid claims, 56% of the patients receiving the sublingual film formulation were still treated after 12 months versus only 46% of those receiving the tablet formulation (p < 0.0001). In privately insured patients, the same trend was observed with a persistence at 6 months significantly higher for the film group than for the tablet group (63.78% vs. 58.13%; p = 0.002)Citation21.
In March 2013, the FDA approved the generic tablet formulation of buprenorphine/naloxone. Because of the relatively low costs to entry for generic drugs, it is expected that many US Medicaid plans will prefer the generic tablet formulation of buprenorphine/naloxone over the Suboxone sublingual film formulation.
The objective of this study was to understand how the introduction of generic tablets of buprenorphine/naloxone will impact the health plan budget from a US public health insurance payer perspective. A budget impact model (BIM) was built to predict the financial consequences of the potential replacement of Suboxone sublingual film with generic buprenorphine/naloxone tablets for Medicaid healthcare plans, and thus to compare those consequences to a potential scenario with no buprenorphine/naloxone tablet. Findings of such a modeling are expected to guide decision-making processes and help achieving more efficient resource allocation.
Methods
Budget impact analyses compared a scenario with Suboxone sublingual film progressively replaced by generic buprenorphine/naloxone tablets (Scenario 1) with a scenario with Suboxone sublingual film covering 100% of the market (Scenario 2). In Scenario 1, the market share of Suboxone sublingual film decreased from 81.68% to 50.62% in the fifth year and the market shares of Amneal, Actavis and Mallinckrodt tablets rose from 8.98% to 24.21%, from 8.98% to 24.02% and from 0.36% to 1.15% respectively (). Scenario 1 reflects a prediction of the evolution of market shares for a Medicaid plan over the next 5 years. To illustrate the impact of choosing the film formulation over tablet formulation, it was compared to Scenario 2, which represents a Medicaid plan with a policy to provide only the film formulation for all patients.
Table 1. Scenarios 1 and 2: buprenorphine/naloxone market share breakdown.
Analyses were conducted from the perspective of Medicaid, at national level, over a timeframe of 5 years. Medicaid is the largest source of funding for medical and health-related services for people with low income and disabilities in the United States. It is a joint federal and state program that provides qualifying individuals or families with healthcare services and medications and is the major public healthcare insurance program in the United States.
Model structure
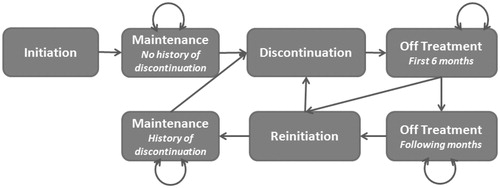
The budget impact analysis was based on a Markov model developed specifically for this study and designed to simulate the history of cohorts of patients with opioid dependence through successive treatment phases as described in . Patients enter the model in the ‘initiation’ state, which corresponds to initiation of treatment with buprenorphine/naloxone. All patients are assumed to go next to the ‘maintenance’ state, during which they are continuously treated. The duration of the maintenance phase varies between patients, and is expected to be longer on average among patients treated with the film formulationCitation22. Following treatment discontinuation, patients enter the ‘off-treatment’ state. As a patient who is off-treatment for a long period of time is expected to have a lower probability to reinitiate, the off-treatment phase was separated in two states, for the first 6 months off-treatment and the following ones. Patients who reinitiated treatment progress to a second ‘maintenance’ state. As patients who had already discontinued their treatment have a higher probability of discontinuing again, two maintenance states were considered: with or without history of discontinuation.
Figure 1. Model structure.
In the model, a new cohort of patients enters the model every year, with a new distribution of market shares. A 1 month cycle length (the minimum time interval between transitions from one state to another) was chosen as it corresponds to the overall frequency of prescriptions and follow-up visits observed in the administrative claims. Each treatment phase has two types of attributes: the monthly transition probabilities (probabilities of transition to other phases) and the associated monthly healthcare costs.
Since the impact of mortality on the budget of healthcare plans is small over a 5 year timeframe, mortality was not considered. The standardized mortality rate among treated opioid patients was estimated to be 770 per 100,000 person-years. Thus, over the 5 year timeframe, less than 2.5% of the cohort entering in the model is expected to dieCitation23.
Medicaid: managed Medicaid and fee-for-service
States have traditionally provided the majority of Medicaid benefits using a fee-for-service (FFS) system where healthcare providers are paid for each service (e.g. office visit, test, procedure, etc.) and in an effort to manage the rising costs of healthcare, States have also implemented a capitated delivery system for Medicaid benefits, referred to as managed Medicaid. In this capitated delivery system, people get their services from an organization under contract with the State for a set amount.
To take into account the on-going shift towards managed schemes in the US and its impact on patient pathways and costs, different inputs were applied to patients under managed Medicaid and fee-for-service Medicaid plans for all transition probabilities and resource categories with statistically significant differences between the two schemes. The model also provided the possibility of applying different distributions of patients between the two types of plans across time to capture the potential evolution of Medicaid policies under the Affordable Care Act which is expected to drive this shift.
Different methods were used to estimate the monthly costs for patients under managed Medicaid and fee-for-service plans. While for the latter all health-related costs are well reflected in the database and had to be simply aggregated by month and treatment phase, for the former a great share of visits were included in the global capitation fund payment.
However, it was assumed that the size of capitation payments are periodically re-negotiated according to the real level of patient consumption of healthcare services and the opportunity costs of providing those services. Therefore, average costs for each type of service were imputed instead of zero costs. The process of the cost imputation is described in more details in the following Model inputs section.
Model inputs
Most model inputs including transition probabilities, resource use, and costs were estimated from the Truven Health MarketScan Database. This database contains health insurance claims, including inpatient, outpatient, and pharmacy claims, as well as information on enrolment, long-term care, and other medical care. Data were obtained for the period between 1 March 2010 and 30 June 2012. The tablet formulation available in the database was the Suboxone tablet and did not include the current generic tablets which were not available until March 2013. It was assumed that persistence and resource utilization would be equivalent between all tablet formulations because generic tablets are A–B rated, meaning that bioequivalence has been studied and demonstrated between the branded and generic versions.
The inclusion criteria included Medicaid patients who were diagnosed with opioid dependence (ICD-9-CM code: 304.0) between 1 March 2010 and 30 June 2012 and had evidence of treatment with Suboxone sublingual film (launched on 1 September 2010) or Suboxone tablets. The index date was defined as the date of the first recorded claim for buprenorphine/naloxone, for patients with at least one claim for buprenorphine/naloxone. Patients with at least 6 months of continuous enrolment prior to the index date, without buprenorphine/naloxone, buprenorphine monotherapy or methadone prescription and at least one renewal of buprenorphine/naloxone prescription between 30 days and 75 days after the index date (in order to exclude short term users) were included in the analysis. Patients could have received buprenorphine/naloxone prior to an opioid dependence diagnosis, as they could have been coded as ‘Addiction’ without specifying the type. Hence, the index date could have preceded opioid dependence diagnosis.
Discontinuation was defined as a gap of at least 31 days without a claim for buprenorphine/naloxone, buprenorphine or methadone following the date when the last package claimed was expected to be consumed (determined according to claim date and duration of prescription). The average daily doses were calculated as the quantity of product prescribed (number of films or tablets) multiplied by the strength of the product and divided by the number of days for which buprenorphine/naloxone was prescribed.
A period of 14 days before treatment reinitiation was considered as part of the reinitiation period, as patients may have additional follow-up visits or may need to work out a new treatment plan. The same methodology was applied to discontinuation. The initiation and reinitiation stages were separated out because resource use and associated costs can be different between initiation (induction onto treatment) and maintenance. Also included were patients with a subsequent induction phase. In addition, the cycle length was set to 1 month, so that reinitiation and discontinuation were defined in accordance with that as well.
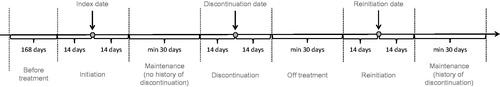
The states of the Markov model were specified in the database analysis, as follows ():
Initiation period: from 14 days before index date to 14 days after index date.
Treatment period: from 15 days after index date to 15 days before the discontinuation date or to the end of eligibility if there is no discontinuation in the period of follow-up.
Discontinuation period: from 14 days before the discontinuation date to 14 days after the discontinuation date.
Period off-treatment after discontinuation: from 15 days after the discontinuation to the reinitiation date or to the end of eligibility if there is no reinitiation in the period of follow-up.
Reinitiation period: from 14 days before the reinitiation date to 14 days after the reinitiation date.
Figure 2. Treatment periods.
The transition probabilities between different treatment phases were estimated using parametric models with exponential distribution (i.e. assuming transition probabilities were constant over time) adjusted on gender, age, race, managed Medicaid vs. fee-for-service plan, daily dose at index date, presence of at least one diagnosis of a mental disorder (except drug use) in the 6 months before index date, presence of at least one diagnosis of chronic pain in the 6 months before index date, and presence of at least two opioid prescriptions in the 6 months before index date. The ICD-9 codes used for mental disorders (except drug use) were 29, 30 or 31 (303, 304 and 305 excluded) for Mental disorder except drug and alcohol use and the code for chronic pain was 338.2.
Resource categories considered were:
Buprenorphine/naloxone utilization
Other medications
Psychiatric inpatient care
Non-psychiatric inpatient care
Outpatient care
Emergency room care.
Generalized linear models were used to estimate the monthly amounts of resources used or costs by medication formulation and treatment phase, with adjustment on the same confounding factors as for the transition probabilities (i.e. gender, age, race, managed Medicaid vs. fee-for-service plan, daily dose at index date, presence of at least one diagnosis of a mental disorder in the 6 months before index date, presence of at least one diagnosis of chronic pain in the 6 months before index date, presence of at least two opioid prescriptions in the 6 months before index date). For psychiatric inpatient care, the monthly numbers of inpatient days were estimated using a Poisson model, and multiplied by an average daily cost also calculated from the same database (based on the subset of patients meeting the study inclusion criteria). For non-psychiatric inpatient care, the monthly probabilities of being hospitalized were estimated using a logistic model, and multiplied by an average cost per stay from the same data source. It is common for a mental disorder to be estimated using the resource use as inpatient days for psychiatric and inpatient stays for non-psychiatric reasons. This was consistent with the methods used in the previous studyCitation21. For acquisition of buprenorphine/naloxone, monthly numbers of tablets or film by strength were estimated using a generalized linear model with gamma distribution and a log-link, and multiplied by prices per unit obtained as detailed below. For other resources – i.e. other medications, outpatient care and emergency room – monthly costs were directly estimated using generalized linear models applied to the insurance claims data. When no statistically significant difference in monthly resource utilization or costs was found between formulations (p > 0.05), the same input values were applied for film and tablet. Before conducting the regression analyses, missing costs for outpatient procedure and services were imputed using mean costs by procedure code. Similarly, pharmaceutical costs were imputed using mean costs per unit imputed by NDC number and when the NDC number was not provided, by generic identifier grouping products by molecule, strength and dispensing form, and average inpatient costs per day were imputed by diagnosis-related group. Costs were also broke down by year, when possible, to account for evolution in prices.
To calculate the cost of buprenorphine/naloxone to Medicaid, monthly utilization of buprenorphine/naloxone, by strength (2 or 8 mg of buprenorphine), was estimated from the MarketScan Medicaid database for patients treated with film and tablet, in each treatment phase. The monthly cost was then derived from the average wholesale price (AWP) (film: 2 mg $4.71, 8 mg $8.45; tablets 2 mg $5.83, 8 mg $10.42), the wholesale acquisition price (WAC) (film: 2 mg $3.93, 8 mg $7.04; tablet 2 mg $4.66, 8 mg $8.34), the reimbursement rate (15.00%), the dispensing fee ($2.00), the patient coinsurance (15.00%) and/or copayment ($0.00), and the rebate rate (0.00%). The monthly consumption of buprenorphine/naloxone films or tablets (2 or 8 mg) was multiplied by the AWP, thus representing the amount of the reimbursement claim submitted to Medicaid by the pharmacy that sold the drug to the patient. To this amount the pharmacy adds the dispensing fee and subtracts the cost born by the pharmacy (according to the reimbursement rate). As it was assumed that patients buy their medication once a month, the dispensing fee was only accounted for once in each cycle. Resulting costs may be partly paid by the patients (according to coinsurance and/or copayment) and/or the manufacturer (according to the rebate rate). The remainder represents the monthly cost to Medicaid. An average cost weighted by market shares for generic buprenorphine/naloxone tablets was calculated for each year and scenario.
To estimate the number of treated patients, a projection on the Medicaid population for 2014 to 2018 (to account for persons newly eligible under the Patient Protection and Affordable Care Act [PPACA]Citation24) rising from 65.6 million to 76.1 million was used in the modelCitation25. For the first year, the incidence of opioid dependence treatment was obtained from the 2012 National Survey on Drug Use and Health (NSDUHCitation26). A total of 973,000 patients received treatment in the past 12 months for use of pain relievers, and 450,000 patients for heroin abuse. Among them, we assumed that 60% initiated or reinitiated treatment in the previous months (between 12 and 24 months ago), based on previously reported statisticsCitation22 on time to treatment discontinuation with the tablet formulation, and short-term users (45% estimated using insurance claims data) were excluded. The resulting incidence of opioid dependence treatment in the first year was 0.15%. For the following years, incidence was calibrated based on the assumption that the number of patients in treatment remains approximately stable over time.
Outputs
The results of the budget impact analysis were available by resource category and by year for the whole Medicaid population as well as per member per month for each scenario. To estimate cumulative costs over 5 years, future costs were discounted to present value at a rate of 3% per annum.
Sensitivity analysis
Deterministic sensitivity analyses were run to identify inputs with most influence on the total incremental budget over 5 years. The following inputs were investigated:
The rebate of tablet using a 50% rebate instead of the 0% rebate of the base case
The proportion capitated using 0% as the lower bound and 100% as the upper bound
The incidence using a variation of ± 25% of base case
Time to first discontinuation, time to second discontinuation and time to reinitiation using limits of the confidence interval around treatment effect
Cost ratio for non-psychiatric care in the maintenance phase and risk ratio for probability of non-psychiatric hospitalization: limits of confidence interval
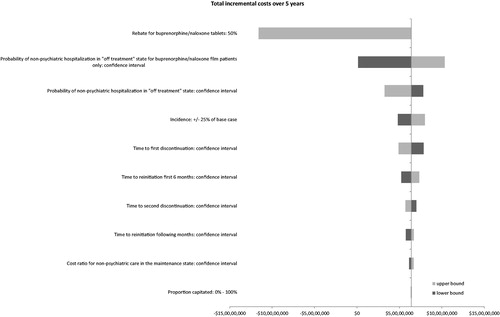
Results of the sensitivity analysis were provided as a tornado chart ().
Figure 3. Tornado-Total incremental costs over 5 years.
Results
Estimation of model inputs
Input values were based on data from 748 patients treated with film and 1172 patients treated with tablet, of which 61% and 64% respectively were capitated. displays the average patient profile in terms of demographics and clinical characteristics used to estimate the transition probabilities, the resource use, and the costs, after adjustment. Patients were composed of 29% of males and aged 33 years on average. A majority (71%) of patients had a diagnosis of mental disorder except drug use reported in the 6 months before the index date. Half of the sample size received at least two opioid prescriptions in the 6 months before the initiation of treatment.
Table 2. Average patient profile.
The transition probabilities between different treatment phases and the related input costs per month by category are displayed in and . Patients treated with film were more likely to remain in treatment during the first episode than patients treated with tablet (91.77% vs. 90.72% under capitation; 93.92% vs. 92.79% with fee-for-service). They were also slightly less likely to reinitiate in the first 6 months compared to tablet-treated patients (7.63% vs. 7.87% under capitation; 7.50% vs. 7.74% with fee-for-service).
Table 3. Transition probabilities.
Table 4. Input costs by resource utilization, state and formulation.
No significant differences in medication costs, other than buprenorphine/naloxone, were found between the two groups, in any treatment phase. Outpatient care costs and psychiatric inpatient care costs were found to be significantly different in the maintenance phase only. The estimated outpatient care costs in patients with film were higher than in patients treated with tablet ($432 vs. $406, p = 0.0097), whereas the estimated psychiatric inpatient care costs were lower in the film group ($31 vs. $53, p = 0.0412). Emergency room care costs were different between the two groups in the off-treatment phase for which the cost associated with patients with film was found to be lower: $67 vs. $96, p = 0.0443).
Non-psychiatric inpatient care costs and buprenorphine/naloxone treatment costs were significantly different for all the treatment phases.
Budget impact analysis results
The predicted quantities of medication used over 5 years represented 1.161 billion milligrams of buprenorphine in Scenario 1 vs. 1.209 billion milligrams in Scenario 2. Predicted total costs over 5 years with the current market share of film and tablet (Scenario 1) were $6464 million, of which 39% related to outpatient care costs, and 34% to pharmaceutical costs (). The cost per member per month in this scenario increased from $0.86 in the first year to $2.32 in the fifth year, as a new cohort of patients enters the model every year. In the scenario with film formulation only (Scenario 2), predicted total costs over 5 years were $6400 million, i.e. lower than in Scenario 1 by $64 million. These savings were mostly driven by inpatient care ($57 million saved over 5 years), followed by emergency room care ($27 million) and pharmaceutical costs ($25 million). Costs of outpatient care were predicted to be higher by $44 million in scenario with 100% market share for film. This reflects greater costs of patient monitoring among patients treated with the tablet formulation, who remain on treatment for a longer period of time. The reduction in total cost per member per month reached $0.028 in the fifth year.
Table 5. Budget impact results by resource category and over 5 years for the Medicaid population rising from 65.6 million to 76.1 million.
Sensitivity analysis
The key drivers of the results were found to be the ratio of probabilities of non-psychiatric hospitalization in the ‘off-treatment’ state between film and tablet, and the price rebate for tablet. When the probability of non-psychiatric hospitalization was increased for the film patients, the total costs over 5 years still remained lower for Scenario 2 (100% of patients on film), although the savings decreased to $1.2 million. However, the probability of non-psychiatric hospitalization on film being lowered from the mean to the lower bound of the confidence intervals of each model resulted in a savings increase of $103.4 million.
Assuming a 50% price reduction or rebate for tablet and zero rebate for film, total costs over 5 years would be higher by $116 million in Scenario 2 vs. Scenario 1. The incremental cost per member per month then ranged from $0.017 in the first year to $0.037 in the fifth year. The total costs over 5 years would be identical between the two scenarios if there was an 18% rebate on a tablet. See and .
Table 6. Sensitivity analysis.
Other important model drivers included the cost ratio for non-psychiatric care in the maintenance phase, incidence of opioid dependence treatment, time to first discontinuation, and time to reinitiation in the first 6 months. The impact of the proportion of patients with capitation, time to second discontinuation and to reinitiation after 6 months was found to be small.
Discussion
Analyses of insurance claims data showed that the sublingual film formulation of buprenorphine/naloxone was associated with improved persistence and lower or comparable total healthcare costs over 6 months following treatment initiation, compared to tablet formulationCitation22,Citation27.
While the addictionologists debate long term treatment vs. shorter term plus taper, Dr. Nora Volkow at NIH has demonstrated imaging studies that suggest the WHO and ASAM definitions of opioid dependence as a ‘chronic relapsing brain disease’ are valid. The decision to taper is a medical decision between physician and patient. Claims data suggests treatment is associated with better patient outcomes and less use of the healthcare system. The statistical analyses as well as the modeling results presented in this study provide better understanding of the mechanisms by which total costs are reduced and allow extrapolating the budgetary impact of increasing the sublingual film market share for Medicaid at the national level, over 5 years. At current prices for sublingual film and tablet formulations, the model predicted that increasing the film market share to 100% could save around $4.5 million in the first year and around $25 million annually after 5 years. Outpatient care expenses were predicted to increase, but savings related to non-psychiatric care would offset those additional expenses.
When model inputs were varied individually to account for uncertainty around input values, the scenario with 100% market share for film remained cost-saving. The only exception was when the price of tablets was assumed to be reduced. As competition between tablet manufacturers may lead them to reduce prices or offer larger rebates, we considered a scenario in which the acquisition cost of tablets was reduced by 50%. The scenario with 100% film market share then became more expensive, with an incremental cost per member per month reaching $0.037 after 5 years. With or without price reduction for tablets, the relative difference in total costs over 5 years associated with an increase in the film market share to 100% is quite small: it varies from −1.0% at current prices to +1.8% with 50% reduction in price of tablets.
As a test of validity, the total costs per patient predicted by the model were compared to estimates previously obtained from statistical analyses on the MarketScan Medicaid database. Total costs over 6 months were previously estimated at $7356 per patient treated with buprenorphine/naloxone film formulation. According to the model, the total cost in the first year, for the scenario with 100% film, was $673 million for 45,854 treated patients, i.e. around $14,700 per patient over 12 months. Thus it appears that the costs predicted by our model are consistent with results of retrospective studies using Medical claims data. However, using another administrative claims database, Baser et al.Citation28 estimated total healthcare costs among patients treated with buprenorphine (with or without naloxone) at $10,710 over 6 months. Previously, a study based on Veterans Health Administration (VHA) data estimated healthcare costs over 6 months after initiation of buprenorphine at $11,597Citation29. Two hypotheses may be proposed to explain the lower costs predicted by our model compared to those estimates from the literature: first, buprenorphine/naloxone may be associated with lower costs than buprenorphine mono formulation because the combination reduces the risk of abuse and diversion and therefore may require less intensive medical supervision as well as lower healthcare service costs since patients stay in treatment; second, costs incurred by Medicaid patients may be lower than those incurred by private health plans or VHA.
All inputs, apart from drug prices, market shares and data related to the incidence of opioid dependence treatment, were obtained from analyses of a database of insurance claims (Truven Health MarketScan Medicaid Multi-State Database), which contains over 31 million Medicaid enrollees from 11 geographically dispersed states and records treatment costs, not charges. The same input values were used for film and tablet, unless statistical analyses showed significant differences between the two formulations. There were differences in transition probabilities. In particular, the monthly probability of treatment discontinuation during the first treatment episode was lower for the film formulation (7.55% vs. 8.52%). Other notable differences concerned costs of outpatient care and non-psychiatric inpatient care. Monthly costs of outpatient care were found to be significantly higher for patients treated with the sublingual film formulation, after adjustment on baseline characteristics, during the maintenance phase. On the contrary, monthly costs of non-psychiatric inpatient care were found to be significantly lower among patients treated with the sublingual film formulation during treatment. Total monthly costs were quite similar for patients treated with film and tablets while on treatment, but were lower after discontinuation of film than after discontinuation of tablets. This appeared to be the key difference driving overall cost savings in the scenario with 100% market share for film.
Limitations
The proposed hypothesis to account for the differences in monthly costs of outpatient care and non-psychiatric care between the two formulations is that as patients treated with the sublingual film are more satisfied and more stable, they also comply better with the schedule of outpatient visits and tests. A more regular follow-up could in turn avoid hospitalizations. Unfortunately, those hypotheses cannot really be verified based on insurance claims data. A limitation of the analysis is that patients treated with film and tablets had different initial characteristics compared to patients treated with tablets, which may also be a source of differences in monthly costs. Cost estimates were adjusted on age, gender, race, type of insurance plan, and comorbidities as well as on resource utilization or costs before treatment initiation. However, some unobserved characteristics related to patients or prescribers might differ between the two groups. Under the assumption that all costs were similar between film and tablet formulations within each treatment phase, apart from drug costs, it was found that the total savings over 5 years were $30 million. The difference in buprenorphine/naloxone treatment acquisition costs represented 84% of those savings. A limitation inherent to the model structure is that it does not account for possible switching between alternative formulations. We assumed that the probability of switching will be small in practice.
The average duration of the interval between treatment episodes was assumed identical after each treatment episode. All transition probabilities and estimates of costs by treatment phase were assumed to be constant over time. The database used to estimate those parameters contained a maximum of about 2.5 years of follow-up data. The extrapolated transition probabilities are based on a single studyCitation21. However, it is possible that the monthly costs in the first months of remission are higher than in the longer term. Therefore, costs associated with the remission phase may be overestimated in analyses over timeframes exceeding 2 years. Another assumption is that transition probabilities and amounts of resources used estimated among patients treated with the Suboxone tablet are representative of all generic tablets.
The fact that some patients who initiated treatment while benefiting from health plan coverage may later leave the health plan or lose Medicaid coverage was not explicitly considered in the model. However, this may be roughly offset by the entrance of new members previously treated for opioid dependence. Furthermore, the predicted growth of the Medicaid population over upcoming years was taken into account to estimate the number of patients initiating treatment every year. A possible improvement of the model, related to the estimation of the size of the treated population, would be to consider changes over time in the proportion of patients treated with buprenorphine/naloxone among those initiating treatment. However, we were unable to access any prediction of how this proportion might evolve over the upcoming 5 years, and therefore assumed it would remain constant. In addition, in order to estimate the number of individuals treated with buprenorphine/naloxone in future years, one would ideally need to know the number of patients seeking treatment in 2015 among those not treated in 2014, the number seeking treatment in 2016 among those not treated in 2014 and 2015, and so on up to 2018. Those numbers could not be found in the literature, and we therefore determined the number of new patients entering the model every year using the assumption that the overall number of treated patients would slowly increase over time. According to the National Surveys on Drug Use and Health, the number of individuals who had pain reliever dependence or abuse increased by 4.3% year-on-year from 2007 to 2012, and the number of individuals who had heroin dependence or abuse increased by 9.6% from 2011 to 2012. In the model, the cost of buprenorphine/naloxone increased by 5% annually which is consistent with increases in the prevalence of opioid dependence.
Conclusion
In conclusion, this model predicts that increasing use of the sublingual film formulation for patients treated with buprenorphine/naloxone will increase costs of outpatient care, but also would generate savings in emergency care and hospitalizations. Overall Medicaid expenses for the treatment of opioid dependence would be expected to be less for sublingual film treated patients, at current drug prices. Should the price of tablets decrease substantially, treating patients with the sublingual film formulation may become slightly more costly than treatment with tablet, but may remain advantageous from a total direct medical cost perspective as persistence with treatment appears to be greater with the sublingual film than with tablets.
Transparency
Declaration of funding
This study was funded by Reckitt Benckiser Pharmaceuticals (RBP).
All authors contributed to the design, writing and final approval of this manuscript. S.A., E.C., E.K., and V.Z. conducted data collection and analysis and interpretation of the results. S.A., E.C. and E.K. received funding from ZRx. C.V.A. received no funding.
Declaration of financial/other relationships
V.Z. has disclosed that he is a health economist with ZRx Outcomes, Toronto, Canada. C.V.A. has disclosed that he is a health economist at the University of Illinois. S.A., E.C., and E.K. have disclosed that they are health economists for Creativ-Ceutical Chicago and Paris. J.R. has disclosed that she is an employee of Reckitt Benckiser Pharmaceuticals. V.Z. and C.V.A. have disclosed that they have received honoraria from RBP. Creativ-Ceuticals and University of Illinois have no financial relationship with RBP.
Reckitt Benckiser Pharmaceuticals, Inc. via Creativ-Ceutical funded the study described in this manuscript. Carl Asche was paid as a consultant as were Vladimir Zah, Emile Clay, Elizaveta Kharitonova, and Samuel Aballéa. Jane Ruby is an employee of Reckitt Benckiser Pharmaceuticals, Inc.
Acknowledgments
Reckitt Benckiser Pharmaceuticals, Inc. funded the study described in this manuscript.
Notes
*Suboxone is a registered trademark of Reckitt Benckiser Pharmaceuticals, Inc., a subsidiary of Indivior, PLC. Richmond, VA, USA.
References
- Center for Substance Abuse Treatment. Clinical Guidelines for the Use of Buprenorphine in the Treatment of Opioid Addiction. Treatment Improvement Protocol (TIP) Series 40. DHHS Publication No. (SMA) 04-3939. Rockville, MD: Substance Abuse and Mental Health Services Administration, 2004
- Stoops WW, Hatton KW, Lofwall MR, et al. Intravenous oxycodone, hydrocodone, and morphine in recreational opioid users: abuse potential and relative potencies. Psychopharmacology (Berl) 2010;212:193-203
- Ling W, Mooney L, Hillhouse M. Prescription opioid abuse, pain and addiction: clinical issues and implications. Drug Alcohol Rev 2011;30:300-5
- Degenhardt L, Hall W. Extent of illicit drug use and dependence, and their contribution to the global burden of disease. Lancet 2012;379:55-70
- Gilson AM, Kreis PG. The burden of the nonmedical use of prescription opioid analgesics. Pain Med 2009;10(Suppl 2):S89-100
- Hallinan R, Byrne A, Amin J, Dore GJ. Hepatitis C virus prevalence and outcomes among injecting drug users on opioid replacement therapy. J Gastroenterol Hepatol 2005;20:1082-6
- Jan SA. Patient perspective, complexities, and challenges in managed care. J Manag Care Pharm 2010;16(1 Suppl B):S22-5
- Veilleux JC, Colvin PJ, Anderson J, et al. A review of opioid dependence treatment: pharmacological and psychosocial interventions to treat opioid addiction. Clin Psychol Rev 2010;30:155-66
- White AG, Birnbaum HG, Mareva MN, et al. Direct costs of opioid abuse in an insured population in the United States. J Manag Care Pharm 2005;11:469-79
- United Nations Office on Drugs and Crime (UNODS), 2012. World Drug Report 2012. United Nations publication, Sales No. E.12.XI.1. http://www.un.org/en/hq/dpi/od.shtml
- Centers for Disease Control and Prevention. Home and recreational safety: unintentional poisoning. Atlanta, GA: CDC, last updated 2 July 2013. Available at: http://www.cdc.gov/HomeandRecreationalSafety/Poisoning/index.html [Last accessed 27 June 2013]
- Results from the 2009 National Survey on Drug Use and Health: Volume 1. Summary of National Findings. Available at: http://oas.samhsa.gov/NSDUH/2k9NSDUH/2k9Results.htm [Last accessed 10 November 2011]
- Volkow ND, McLellan TA. Curtailing diversion and abuse of opioid analgesics without jeopardizing pain treatment. JAMA 2011;305:1346-7
- Bruneau J, Roy E, Arruda N, et al. The rising prevalence of prescription opioid injection and its association with hepatitis C incidence among street-drug users. Addiction 2012;107:1318-27
- Nicholls L, Bragaw L, Ruetsch C. Opioid dependence treatment and guidelines. J Manag Care Pharm 2010;16(1 Suppl B):S14-21
- Chandwani HS, Strassels SA, Rascati KL, et al. Estimates of charges associated with emergency department and hospital inpatient care for opioid abuse-related events. J Pain Palliat Care Pharmacother 2013;27:206-13
- Clark HW. Office-based practice and opioid-use disorders. N Engl J Med 2003;349:928-30
- Lavonas EJ, Banner W, Bradt P, et al. Root causes, clinical effects, and outcomes of unintentional exposures to buprenorphine by young children. J Pediatrics 2013;163:1377-83
- Lavonas EJ, Severtson SG, Martinez EM, et al. Abuse and diversion of buprenorphine sublingual tablets and film. J Subst Abuse Treat 2014;47:27-34
- Kharitonova E, Aballéa S, Clay E, et al. Analysis of persistence and healthcare costs in the US Medicaid population opioid-dependent patients treated with buprenorphine/naloxone film and tablet formulations. ISPOR 18th Annual International Conference, New Orleans, 18–22 May 2013
- Clay E, Khemiri A, Zah V, et al. Persistence and healthcare utilization associated with the use of buprenorphine/naloxone film and tablet formulation therapy in adults with opioid dependence. J Med Econ 2014;17:626-36
- Kharitonova E, Clay E, Ruby J, et al. Retrospective study of persistence and healthcare costs in the US opioid-dependent Medicaid population treated with buprenorphine/naloxone film and tablet formulations. ISPOR 18th Annual International Conference, New Orleans, 18–22 May 2013
- Degenhardt L, Larney S, Randall D, et al. Causes of death in a cohort treated for opioid dependence between 1985 and 2005. Addiction 2014;109:90-9
- Office of the Legislative Counsel, Patient Protection and Affordable Care Act, (“PPACA”; Public Law 111-148) 2010
- Truven Health Analytics. Medicaid Expansion: Profiling the Future Medicaid-Eligible Population. Truven Health Analytics, 2012
- U.S. Department of health and human services, Substance Abuse and Mental Health Services Administration. Results from the 2009 National Survey on Drug Use and Health: Volume I. Summary of National Findings (Office of Applied Studies, NSDUH Series H-38A, HHS Publication No. SMA 10-4856Findings). Rockville, MD. 2010
- Clay E, Khemiri A, Ruby J, et al. Patient persistence with buprenorphine/naloxone film and tablet formulations in the treatment of opioid dependence in the United States: results from a 2010–2012 privately insured retrospective database. 15th International Society of Addiction Medicine Conference, Kuala Lumpur, 21–23 November 2013
- Baser O, Chalk M, Fiellin DA, Gastfriend DR. Cost and utilization outcomes of opioid-dependence treatments. Am J Manag Care 2011;17(Suppl 8):S235-48
- Barnett PG. Comparison of costs and utilization among buprenorphine and methadone patients. Addiction 2009;104(6):982-92