
Abstract
Objective:
To update an earlier evaluation estimating the cost-effectiveness of quadrivalent influenza vaccination (QIV) compared with trivalent influenza vaccination (TIV) in the adult population currently recommended for influenza vaccination in the UK (all people aged ≥65 years and people aged 18–64 years with clinical risk conditions).
Methods:
This analysis takes into account updated vaccine prices, reference costs, influenza strain circulation, and burden of illness data. A lifetime, multi-cohort, static Markov model was constructed with seven age groups. The model was run in 1-year cycles for a lifetime, i.e., until the youngest patients at entry reached the age of 100 years. The base-case analysis was from the perspective of the UK National Health Service, with a secondary analysis from the societal perspective. Costs and benefits were discounted at 3.5%. Herd effects were not included. Inputs were derived from systematic reviews, peer-reviewed articles, and government publications and databases. One-way and probabilistic sensitivity analyses were performed.
Results:
In the base-case, QIV would be expected to avoid 1,413,392 influenza cases, 41,780 hospitalizations, and 19,906 deaths over the lifetime horizon, compared with TIV. The estimated incremental cost-effectiveness ratio (ICER) was £14,645 per quality-adjusted life-year (QALY) gained. From the societal perspective, the estimated ICER was £13,497/QALY. A strategy of vaccinating only people aged ≥65 years had an estimated ICER of £11,998/QALY. Sensitivity analysis indicated that only two parameters, seasonal variation in influenza B matching and influenza A circulation, had a substantial effect on the ICER. QIV would be likely to be cost-effective compared with TIV in 68% of simulations with a willingness-to-pay threshold of <£20,000/QALY and 87% with a willingness-to-pay threshold of <£30,000/QALY.
Conclusions:
In this updated analysis, QIV was estimated to be cost-effective compared with TIV in the UK.
Introduction
Influenza is an acute viral disease, which is self-limiting in most people but can cause serious complications or death. Population groups at elevated risk of influenza complications include infants, elderly people (aged 65 years or more), and people with chronic illnesses such as respiratory or heart diseaseCitation1. In temperate climates such as the UK, influenza is generally a seasonal disease, with most cases occurring in the winterCitation1. Mainly two types of influenza virus, influenza A and influenza B, can cause significant clinical disease in humansCitation1. Influenza A undergoes antigenic drift and is responsible for seasonal epidemics and occasional pandemics. Influenza B has two lineages, Yamagata and Victoria, which have co-circulated annually at varying levels since 2001–2002Citation2,Citation3.
Annual vaccination to protect against seasonal influenza is recommended by the World Health Organization (WHO) for high-risk groupsCitation4. The UK has recently extended its influenza vaccination program to include administration of a live attenuated intra-nasal influenza vaccine to children aged 2 to <17 yearsCitation1,Citation5. Continuous surveillance of circulating strains is required to identify the influenza strains that should be included in each season’s influenza vaccine. Until recently, most seasonal influenza vaccines were trivalent, with two influenza A sub-types and one influenza B lineage. However, co-circulation of the two influenza B lineages could limit the effectiveness of trivalent vaccines, especially in years with a substantial mismatch between the circulating influenza B lineage(s) and the influenza B lineage selected for that year’s seasonal vaccine. There is considerable variation between seasons in the circulating influenza virus strains and lineages, and in the degree of matching between the seasonal influenza vaccine and the circulating viruses. In the UK, the vaccine influenza B lineage and the circulating influenza B lineage were at least partially mismatched in 6 of the 10 influenza seasons from 2000/2001 to 2009/2010Citation6. Quadrivalent vaccines that include both influenza B lineages could improve protection against influenza B. A quadrivalent inactivated influenza vaccine (Fluarix Tetra™) is now availableCitation7, and was introduced in the UK in time for the 2013–2014 influenza seasonCitation8.
Economic data on the cost of influenza in the UK are scarce. In review of economic studies on influenza published in 2013, no UK studies reporting national cost-of-illness estimates were identifiedCitation9. Since the publication of this review, new evidence on the burden and cost of influenza in the UK has been publishedCitation10–13. An economic evaluation of quadrivalent influenza vaccination compared with trivalent influenza vaccination in elderly people and clinical risk groups was conducted in 2013 by one of the authors of the present study (G. Meier) and colleaguesCitation14. Since this economic evaluation was conducted, the new burden and cost of illness studies and the price of the quadrivalent vaccine in the UK have become available.
The objective of the present study was to update the earlier economic evaluation of quadrivalent influenza vaccination, taking into account current vaccine prices, updated reference costs, the most recent influenza strain circulation data, and results from new database studies on the burden and cost of influenza in the UK. This analysis estimates the cost-effectiveness of quadrivalent influenza vaccination compared with trivalent influenza vaccination in the adult population currently recommended for influenza vaccination in the UK, i.e. all people aged 65 years or more and people aged 18–64 years with clinical risk conditions (defined according to National Institute of Health and Care Excellence [NICE] criteria)Citation15.
Patients and methods
Model design and structure
Full details of the model structure and the rationale for the model design have been published previouslyCitation14. Briefly, this is a static multi-cohort Markov model with a 1-year cycle time, in which several cohorts in different age groups enter the simulation and are followed over a lifetime of consecutive influenza seasons, i.e., until the youngest cohorts at entry reach the age of 100 years. This modeling approach is better able than a 1-year model to capture long-term consequences and to reflect real-world influenza management, in which individuals are vaccinated in each successive influenza season.
In each annual cycle, individuals could be vaccinated against influenza, become infected with influenza, receive medical attention from a general practitioner (GP) or accident and emergency (A&E) department, receive antiviral treatment, develop influenza-related complications (respiratory or non-respiratory) that may in turn lead to hospitalization or outpatient treatment, or die from influenza or other causes. Surviving individuals moved to the next annual cycleCitation14. The criteria for receiving post-exposure prophylaxis (PEP) or treatment with antiviral medications were based on UK guidelinesCitation15,Citation16.
The base-case analysis compared quadrivalent influenza vaccination with trivalent influenza vaccination over a lifetime time horizon. An additional analysis considered a 10-year time horizon. The main outcome measure was the number of quality-adjusted life-years (QALYs) gained and the incremental cost-effectiveness ratio (ICER) per QALY gained. Costs and outcomes were discounted at 3.5% per year in the base-case, in line with the UK guidelinesCitation17. The effects of different discount rates were explored in sensitivity analysis. The base-case analysis was conducted from the perspective of the UK National Health Service (NHS), the national healthcare provider, and, thus, included only the direct medical costs. A secondary analysis was conducted from the societal perspective. Herd protection effects were not included in the model. The model was developed using Microsoft Excel 2010, and has been previously validatedCitation14.
Population
The population considered in the present analysis differs from the one in the previous publication. In the present analysis, the base-case population vaccinated included all people aged 65 years or more and people aged 18–64 years with clinical risk conditions, i.e. adults and elderly individuals only. This is consistent with the guidance from the Joint Committee on Vaccination and Immunization (JCVI), as a live attenuated intra-nasal vaccine was recommended for the program extension to children and adolescentsCitation5, rather than the inactivated quadrivalent and inactivated trivalent influenza vaccines compared in the present analysis. Thus, the two age groups covering children and adolescents in the earlier analysis were excluded from this one. The other seven age groups covered adults and elderly people (18–49, 50–64, 65–69, 70–74, 75–79, 80–84, ≥85 years)Citation14. The at-risk group was further sub-divided into people with clinical risk conditions and people living in residential care homes. Clinical risk conditions included patients with one or more of the following characteristics: chronic respiratory disease; chronic heart disease; chronic renal disease; chronic liver disease; chronic neurological conditions; diabetes mellitus; or immunosuppressed (including transplanted patients)Citation15. The UK guidelines issued by JCVI and Public Health England also recommend vaccination of pregnant women and workers in health and social careCitation1,Citation5. However, these groups were excluded from the model.
A scenario analysis considered vaccination of people aged 65 years or more only.
Input data
Influenza circulation data
The present analysis differed from the previous evaluation as it excluded influenza circulation data for the influenza pandemic year of 2009–2010, when the seasonal influenza vaccination considered in this analysis would not have been appropriate. It also used the most recent surveillance data on circulation of influenza A and influenza B reported by the UK Health Protection Agency (HPA)Citation18. The average proportions of influenza A and influenza B over 10 seasons from 2002–2003 to 2012–2013, excluding the pandemic year of 2009–2010, were 74.3% and 25.7%, respectively.
Population data
shows the population distribution by age and risk status. UK population and age distribution data were updated to the most recent available (2012 and 2011, respectively) using data published by the Office for National Statistics (ONS)Citation19. All-cause mortality data for the general UK population were updated to the most recent availableCitation20, and distributed between the at-risk and healthy populations by assuming that all-cause mortality in the at-risk population was 10-times the all-cause mortality in the healthy populationCitation14,Citation21.
Table 1. UK population distributed by age group and risk status.
The proportion of each age group categorized as clinically at-risk was obtained from the percentage of patients at-risk in the General Practice Research Database (GPRD), now known as the Clinical Practice Research Datalink (CPRD), in a recent studyCitation12,Citation13,Citation22. The proportion of people in residential care was unchanged from the earlier analysisCitation14.
Probability and vaccine data
The age-dependent probabilities of moving from healthy to at-risk in each annual cycle were assumed to be independent of vaccination status and influenza exposure, and were calculated from all-cause mortality data and the age distribution of the at-risk populationCitation19–21. These data are shown in .
Table 2. Rate of movement from healthy status to at-risk status in each annual cycle by age*.
Vaccine efficacy data used in the analysis are shown in . The average efficacy of the trivalent vaccine against influenza A was estimated from two Cochrane reviews in healthy adultsCitation23 and elderly peopleCitation24, and its efficacy against vaccine-matched and mismatched influenza B lineages was estimated from a meta-analysis in adultsCitation25. The average matching with the circulating influenza B lineages over 10 seasons from 2002–2003 to 2012–2013, excluding the pandemic year of 2009–2010, was calculated from HPA surveillance dataCitation18. The average of these 10 seasons, allowing for cross-protection, was used for the estimation of the average trivalent vaccine efficacy against influenza B in the base-case. The quadrivalent vaccine was assumed to have the same efficacy as the trivalent vaccine against influenza A, and the same efficacy against influenza B as the trivalent vaccine with optimal matchingCitation14. It is assumed that there was no difference in vaccine efficacy between healthy and at-risk groups. No adverse effects of vaccination were considered, in line with a previous systematic review and economic evaluationCitation26.
Table 3. Vaccine efficacy and coverage rates.
Vaccine coverage was derived from data reported in the GPRD over 8 seasons from 2000–2001 to 2007–2008Citation1 Citation2,Citation13,Citation22. The vaccine coverage rates are shown in .
Age-dependent probabilities for events in the model are shown in . Probabilities for receiving PEP, influenza infection, and receiving antiviral treatment were derived from previous publicationsCitation26–28 and were unchanged from the previous modelCitation14. Probabilities for seeking medical advice, developing complications, hospitalization, and death due to influenza were calculated from two recent UK database studiesCitation10–13,Citation22,Citation29,Citation30. Although the model can differentiate between respiratory and non-respiratory complications and between different types of complication within each of these categories, the input values for parameters associated with complications (e.g. hospitalization rate, death rate, cost, duration, and disutility) used in this analysis were the same for all. , thus, does not show the probabilities for the different types of complication, since in the present analysis the distribution between different complication types did not influence the results. It was assumed that the probability of death from influenza without complications was zero in all age and risk groups.
Table 4. Probabilities of events.
Cost data
The reference year for all costs was 2012/2013. The trivalent vaccine price was updated to £6.43Citation31, and the quadrivalent vaccine price was updated to the list price of £9.94Citation32. It was assumed that elderly and at-risk patients would receive the vaccination during a visit to a GP for other health reasons, so no vaccine administration costs were included. The cost of neuraminidase inhibitor treatment and PEP was updated using the most recent published dataCitation31 and was £17.22 for all age groups. The cost of a visit to the GP or A&E were updated to the latest published data from the Personal Social Services Research Unit (PSSRU)Citation33 (£37.00 and £135.00, respectively, for all age groups).
The mean costs per script for prescribed medications in each age group were obtained from a UK database studyCitation10,Citation11,Citation29,Citation30 and adjusted to 2013 prices using the PSSRU inflation indexCitation33. The cost of nurse visits at home was estimated from the probability of a home visitCitation34, PSSRU unit cost data for 2013Citation33, and assuming that adult patients would receive one visit and elderly patients would receive threeCitation35. The average cost of outpatient and hospital treatment for complications in each age group were obtained from a UK database studyCitation10,Citation11,Citation29,Citation30 and adjusted to 2013 prices using the PSSRU inflation indexCitation33. Costs were assumed to be the same for all complications. These age-dependent cost data are shown in .
Table 5. Age-dependent cost data.
Cost data used only in the analysis from a societal perspective
Costs for prescription fees, over-the-counter medication, private nursing care, and transportation are borne by the patient. These costs are included only in the societal perspective and are not included in the NHS perspective. Prescription fees were estimated from the proportion of people receiving any medicationCitation36, the cost of a script from Department of HealthCitation37 data, and the average number of scripts per prescription feeCitation38. No prescription fees were included for vaccination or hospitalization. Over-the-counter medication usage was estimated from previous publicationsCitation34,Citation38,Citation39, and multiplied by average costCitation27 adjusted to 2013 prices using the PSSRU inflation indexCitation33. It was assumed that the probability of a private nurse visit was half that of a reimbursed nursing visit, and the costs were calculated as described for reimbursed nursing visits above. These cost data are shown in .
Table 6. Age-dependent cost data used only in the analysis from a societal perspective.
Average transport costs for all influenza cases seeking medical advice were £9.21 in all age groups, derived from a published studyCitation40 and adjusted to 2013 levels using the Consumer Price Index from the ONSCitation41.
Indirect costs include lost productivity due to time away from work (absenteeism), reduced productivity due to illness while at work (presenteeism), and lost productivity due to premature death. It was assumed that elderly individuals (aged 65 years or more) incurred no lost productivity because they would already have retired from work, and adult relatives would visit them outside working hours. A day away from work was assumed to cost 20% of average weekly earnings in 2013Citation42. The number of days off work due to influenza not requiring hospital treatment was obtained from Keech and BeardsworthCitation43, and for influenza requiring hospitalization it was assumed to be equal to the duration of hospital stay reported in a UK database studyCitation10,Citation11,Citation29,Citation30. These data are shown in .
Yearly productivity loss due to premature death was derived from Menzin et al.Citation44, calculating a weighted average between males and females using ONS dataCitation19 and adjusted to 2013 average weekly earningsCitation42, and is shown in . Lost productivity due to premature death was not included in the total costs or in the ICER calculations.
Table 7. Age-dependent costs of yearly productivity loss due to premature death*.
Utility data
Baseline utility data for the healthy and at-risk population were calculated from a UK study, adjusting for the different distribution of age groups used in the modelCitation45.
Disutilities for influenza episodes not requiring hospitalization were −0.68 for adults aged 18–64 years and −0.88 for people aged ≥65 years, and disutilities for influenza requiring hospitalization were −0.80 and −0.98, respectivelyCitation46,Citation47. The duration of an episode not requiring hospitalization was 7.5 days without effective neuraminidase treatmentCitation47, and effective neuraminidase treatment was assumed to shorten the duration by 2.5 days, with no effect on the disutilityCitation14. The duration of an episode requiring hospitalization was taken as the length of stay for influenza with any complication reported in a UK database studyCitation10,Citation11,Citation29,Citation30. Complicated episodes treated in an outpatient setting were assumed to have the same disutility as an uncomplicated influenza episode and the same duration as a hospitalization. These data are shown in .
Table 8. Age-dependent utility data.
Sensitivity analysis
A one-way sensitivity analysis was performed using ranges for the input parameters derived from published sources where possible. A probabilistic sensitivity analysis (PSA) was performed by recording the results of 1000 Monte Carlo simulations, each of which simultaneously sampled each of the model’s input parameters from a probability distribution. The parameters used in the sensitivity analyses are shown in . The PSA results calculated a 95% confidence interval (CI). The one-way sensitivity analysis results compared the baseline value with the change from baseline.
Table 9. Parameters used in the sensitivity analyses.
Scenario analyses
Scenario 1 explored the effect of vaccinating only the elderly population.
Two further scenarios explored the effect of seasonal variation in the degree of matching between the trivalent vaccine and the circulating virus strains. Scenario 2 applied data from the worst matched season (2005–2006), and scenario 3 applied data from the best matched season (2002–2003). Both scenarios included the base-case vaccinated population (all people aged 65 years or more and people aged 18–64 years with clinical risk conditions) and calculated results for the first year only.
An additional scenario considered the base-case population over a 10-year time horizon.
Results
Base-case
The estimated lifetime disease burden, QALYs, costs, and ICER per QALY gained for quadrivalent vaccination compared with trivalent vaccination are shown for the base-case from the NHS perspective in . The estimated numbers of people vaccinated and receiving PEP were greater for quadrivalent vaccination than trivalent vaccination over the lifetime horizon because of the smaller number of expected deaths with quadrivalent vaccination each year. Quadrivalent vaccination would be expected to result in fewer influenza-related events and improved health outcomes (more QALYs and life-years) compared with trivalent vaccination. Quadrivalent vaccination would be expected to incur higher costs for vaccination and PEP, reflecting the larger numbers receiving these interventions and the higher cost of quadrivalent vaccination, partially offset by savings in the costs of influenza treatment and hospitalizations. The estimated ICER over the lifetime horizon was £14,645/QALY gained for quadrivalent vaccination compared with trivalent vaccination, and this could be considered cost-effective as it is below the NICE threshold range of £20,000/QALY to £30,000/QALYCitation48.
Table 10. Base-case results from the NHS perspective in the base-case population over a lifetime.
shows the estimated costs and ICER from the societal perspective over a lifetime (numbers of events and health outcomes are identical for both the societal and NHS perspectives). Quadrivalent vaccination would be expected to reduce non-reimbursable, non-medical, and indirect costs, compared with trivalent vaccination. These savings would further offset the higher vaccination and PEP costs, reducing the ICER to £13,497/QALY over the lifetime horizon.
Table 11. Cost and ICER results from the societal perspective in the base-case population over a lifetime.
Scenario analyses
shows the results for the scenario analyses, all conducted from the NHS perspective. A strategy of vaccinating only the elderly population (age 65 years or more) resulted in a more favourable estimated cost-effectiveness (ICER £11,998/QALY) over the lifetime horizon compared with the base-case.
Table 12. Results from scenario analyses.
Results for scenarios exploring the effect of seasonal variation in the degree of matching between the trivalent vaccine and the circulating virus strains are also shown in , for the first year only. As these are not summed over a lifetime, an ICER cannot be calculated. The base-case results are calculated using the average match over 10 seasons, and these scenarios illustrate the amount of variability that might be expected in different seasons as the degree of match varies. If matching were equivalent to the worst-matched season, the estimated incremental costs of quadrivalent vaccination over trivalent vaccination would be less than a quarter of the value in the base-case, while the estimated QALY gain would be more than 5-times higher. Conversely, with matching equivalent to the best-matched season (with 100% match between the circulating strains and the trivalent vaccine), the quadrivalent vaccine would have higher costs than the trivalent vaccine for no additional benefit.
presents the estimated disease burden, QALYs, costs, and ICER per QALY gained for quadrivalent vaccination compared with trivalent vaccination for the base-case population from the NHS perspective over a 10-year time horizon. The estimated ICER over the 10-year horizon was £26,019/QALY gained for quadrivalent vaccination compared with trivalent vaccination.
Table 13. Results from the NHS perspective in the base-case population over a 10-year time horizon.
Sensitivity analysis
shows the results of the one-way sensitivity analysis. Only two parameters had a substantial effect on the ICER: circulation of influenza A; and the degree of matching between the trivalent vaccine and the circulating influenza B lineages (). This illustrates the importance of seasonal variation as explored in the scenario analyses. This is to be expected, since the difference between the quadrivalent and trivalent vaccines is driven by the efficacy against influenza B. The effects of the 10 next most important parameters are shown on a different scale in . These parameters had only modest effects on the results. The results of sensitivity analysis on disutility and vaccine price differential (varying the trivalent vaccine price while keeping the quadrivalent vaccine price fixed) are shown for the NHS perspective by age in , and the effects of different discount rates are shown for the NHS and societal perspectives in , all over the lifetime horizon. None of these parameters had a large effect on the results.
Figure 1. One-way sensitivity analysis comparing quadrivalent with trivalent vaccination. (A) Effect of the two most important parameters. (B) Effect of the next ten most important parameters. The vertical axis indicates the incremental cost-effectiveness ratio (ICER) in the base-case = £14,645/QALY. QALY, quality-adjusted life-year; TIV, trivalent vaccination; VE, vaccine efficacy.
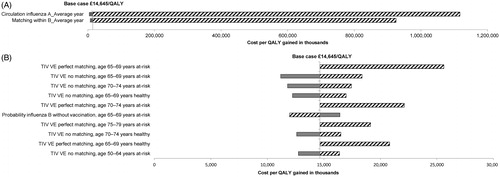
Table 14. Effects of disutility and vaccine price in sensitivity analysis, base-case population over a lifetime.
Table 15. Effects of discount rates in sensitivity analysis, base-case population over a lifetime.
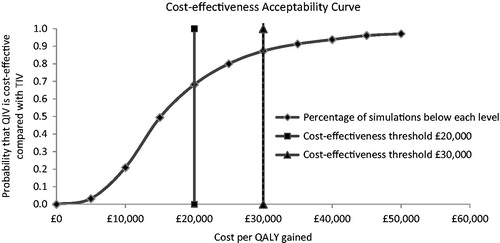
shows the cost-effectiveness plane from the PSA. The black square indicates the position of the deterministic value in the base-case analysis, and the diagonal line indicates the cost-effectiveness threshold of £20,000/QALY gained. shows the cost-acceptability curve. A total of 68% of the simulations were below a threshold of £20,000/QALY, and 87% were below a threshold of £30,000/QALY.
Figure 2. Probabilistic sensitivity analysis comparing quadrivalent with trivalent vaccination, 1000 iterations. ICER, incremental cost-effectiveness ratio; QALY, quality-adjusted life-year; QIV, quadrivalent vaccination; TIV, trivalent vaccination.
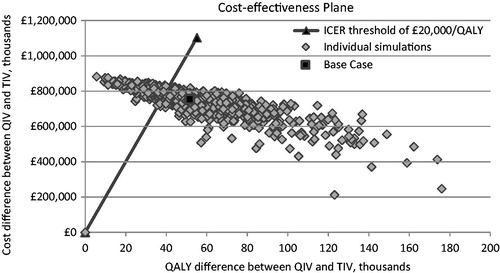
Figure 3. Cost-effectiveness acceptability curve comparing quadrivalent with trivalent vaccination. QALY, quality-adjusted life-year; QIV, quadrivalent vaccination; TIV, trivalent vaccination.
Discussion
The present analysis has updated an earlier economic evaluation of quadrivalent influenza vaccination in the UKCitation14. It used new information that was not available at the time of the previous analysis to replace the limited information used earlier, considered the general adult population currently recommended for influenza vaccination in the UK according to JCVI guidance (all people aged 65 years or more and people aged 18–64 years with clinical risk conditions), and excluded the pandemic year. The analysis used a lifetime, static, multi-cohort Markov model to compare a policy of vaccinating this population using quadrivalent influenza vaccine with a policy of vaccinating this population using trivalent influenza vaccine from the perspective of the NHS in the base-case. A secondary analysis was conducted from the societal perspective. The estimated ICER from the NHS perspective over a lifetime horizon was £14,645/QALY gained. From the societal perspective, the estimated ICER was £13,497/QALY over a lifetime. A strategy of vaccinating only people aged ≥65 years had an estimated ICER of £11,998/QALY over a lifetime. Sensitivity analysis indicated that the ICER was <£20,000/QALY in 68% of simulations and <£30,000/QALY in 87% of simulations. Only two parameters had a substantial effect on the ICER: matching between the trivalent vaccine and the circulating influenza B lineages; and circulation of influenza A.
The main differences from the previous economic evaluation are in the input data used in the model. There are no differences in model structure. The first difference in input data is that the present analysis included data from two large database studies in the UK that were not available at the time of the earlier analysis. The first study used the GPRD to estimate influenza-related cases and mortality attributable to the influenza A and influenza B virusesCitation12,Citation13,Citation22. The second study used the linked GPRD and Hospital Episode Statistics databases to estimate costs associated with influenza in the UKCitation10,Citation11,Citation29,Citation30. Second, the price of the quadrivalent vaccine was not available at the time of the earlier analysis and an assumption had to be used, whereas, in the present analysis, we have been able to use the current quadrivalent vaccine list price (£9.94) and a weighted average of the trivalent vaccine prices in the same reference year (£6.43). Third, the data on circulating influenza virus strains have been updated to the most recent 10 years available (from 2002–2003 to 2012–2013, excluding the pandemic year of 2009–2010). Fourth, all unit costs used in the model have been updated to a reference year of 2012–2013, and population data have been updated to 2012.
Consistent with the earlier evaluation, this updated analysis also found that quadrivalent influenza vaccination could be expected to be cost-effective, compared with trivalent influenza vaccination, in the UK. The previous analysis estimated the ICER for quadrivalent vaccination at £5299/QALY (using an assumption about the quadrivalent vaccine price) or £27,378/QALY (using the current quadrivalent vaccine list price and the 2010 trivalent vaccine price)Citation14. The present analysis estimated the ICER at £14,645/QALY from the NHS perspective, which falls between the two previous estimates.
There are no other similar cost-effectiveness analyses comparing quadrivalent and trivalent influenza vaccination in the UK to our knowledge. The results of the present study are consistent with findings from economic analyses in the USCitation49–51. These publications estimated that quadrivalent influenza vaccination would be expected to reduce influenza-related hospitalizations and deaths compared with trivalent vaccinationCitation51, would be cost-saving if priced at the same level as trivalent vaccinationCitation50, and would be cost-effective compared with trivalent vaccination at 2011 vaccine pricesCitation49.
The population included in the base-case of the present analysis covers elderly people aged 65 years or more and adults aged 18–64 years with clinical risk conditions. This reflects the population for which quadrivalent or trivalent vaccination would be appropriate, as live attenuated intra-nasal influenza vaccine is currently recommended for children aged 2 to <17 yearsCitation5. A limitation of the present analysis is that pregnant women and workers in health and social care, although currently recommended to receive influenza vaccination, were excluded due to a lack of suitable data. A specific model may be better suited to evaluating the potential effects of different influenza vaccines in these particular groups.
Over a 10-year time horizon, quadrivalent vaccination would be expected to avoid 183,844 influenza cases, 4871 hospitalizations, and 2142 deaths, compared with trivalent vaccination. As would be expected, these estimates are considerably smaller than the estimated values over the lifetime horizon (1,413,392 influenza cases, 41,780 hospitalizations, and 19,906 deaths). The estimated ICER for quadrivalent vaccination compared with trivalent vaccination over a 10-year horizon was £26,019/QALY gained, higher than the estimated value for the lifetime horizon and still within the NICE threshold range of £20,000/QALY to £30,000/QALYCitation48. A limitation noted in the earlier analysis was that it did not include indirect costs resulting from time lost from work due to influenza, which could have under-estimated the potential benefits of the quadrivalent vaccineCitation14. The present study has extended the analysis to include the societal perspective, and, as predicted, the estimated ICER from the societal perspective was slightly more favourable than the estimated ICER from the NHS perspective (£13,497/QALY compared with £14,645/QALY). The relatively modest difference between the perspectives reflects our assumption that influenza cases in elderly people would not result in any time lost from work.
Another limitation noted in the earlier evaluation was that the model did not directly incorporate seasonal variations in influenza virus strain circulation and vaccine mismatchCitation14. These seasonal variations are allowed for in the model by using average data over 10 seasons in the base-case, and are taken into account in the sensitivity analyses. In the present study, we have explored this further by running two scenarios to evaluate the effect of two different assumptions about vaccine mismatch: one using the worst-matched season in the 10-year series; and one using the best-matched season. These scenarios indicated that the seasonal variation in the degree of mismatch could have a substantial effect on the results. Using data from the worst-matched season, the estimated QALY gain for quadrivalent vaccination over trivalent vaccination would be higher than in the base-case and the estimated incremental cost would be lower. Using data from the best-matched season, the quadrivalent vaccine would be expected to have no additional benefits over the trivalent vaccine, but would have higher costs.
Other limitations noted in the earlier analysisCitation14 also apply to this updated analysis. As a static model it cannot fully account for herd effects. However, herd effects on influenza transmission have been noted with vaccination of childrenCitation49,Citation52. The population considered in this analysis does not include children, because current UK guidelines recommend live attenuated intra-nasal influenza vaccine for children aged 2 to <17 yearsCitation5. Thus, the impact of excluding herd effect from the present study is likely to be small. Another limitation is that the study does not attempt to include any potential declines in health status that may occur after influenza infection, particularly in elderly individualsCitation53,Citation54. Limitations also remain in the availability of detailed data to populate the model by age and risk status, as previously notedCitation14. However, if more detailed data become available from future studies, they can be incorporated into the model to produce further updates to the present analysis, just as this analysis has updated the earlier analysis by incorporating more recent data.
Conclusions
This updated economic evaluation using new information indicates that quadrivalent inactivated influenza vaccination of the elderly and clinical at-risk adult population is estimated to be a cost-effective intervention compared with trivalent inactivated vaccination in the UK. Quadrivalent vaccination would be expected to reduce influenza cases, hospitalizations and deaths compared with trivalent vaccination, and the estimated ICER from the NHS perspective over a lifetime horizon was £14,645/QALY gained.
Transparency
Declaration of funding
This study was funded by GlaxoSmithKline Biologicals SA, which was involved in all stages of the study conduct and analysis including: design and operation of the model; data inputs, analysis and interpretation; manuscript preparation, review and decision to submit for publication. GlaxoSmithKline Biologicals SA also funded all costs associated with the development and the publishing of the present manuscript. All authors had full access to the data and agreed with the submission of the publication.
Declaration of financial/other relationships
GM and MG are employees of the GSK group of companies. GM holds shares in the GSK group of companies and held stock options in the GSK group of companies until July 2013. BPN reports personal fees from the GSK group of companies during the conduct of the study and outside the submitted work. JME peer reviewers on this manuscript have no relevant financial or other relationships to disclose.
Acknowledgments
The authors would like to thank Carole Nadin (Fleetwith Ltd, on behalf of GSK Vaccines) for medical writing assistance and Carole Desiron (Business and Decision Life Sciences, on behalf of GSK Vaccines) for publication co-ordination. The authors also thank Ilse Van Vlaenderen and Laure-Anne Van Bellinghen (CHESS In Health, Belgium) for their contributions to the development of the model and the original publication.
Notes
*Fluarix Tetra is a trademark of the GSK group of companies.
References
- Public Health England. Influenza: the green book Chapter 19. UK; 2013. https://www.gov.uk/government/publications/influenza-the-green-book-chapter-19. Accessed 19 February 19, 2014
- Chen R, Holmes EC. The evolutionary dynamics of human influenza B virus. J Mol Evol 2008;66:655-63
- Ambrose CS, Levin MJ. The rationale for quadrivalent influenza vaccines. Hum Vaccin Immunother 2012;8:81-8
- World Health Organization. Influenza (Seasonal). Fact Sheet No 211. Denmark; 2014. http://www.who.int/mediacentre/factsheets/fs211/en/. Accessed April 4, 2014
- Joint Committee on Vaccination and Immunisation. JCVI statement on the annual influenza vaccination programme – extension of the programme to children. UK; 2012. https://www.gov.uk/government/uploads/system/uploads/attachment_data/file/224775/JCVI-statement-on-the-annual-influenza-vaccination-programme-25-July-2012.pdf. Accessed February 19, 2014
- Health Protection Agency. HPA National Influenza Annual Reports. UK; 2014. http://webarchive.nationalarchives.gov.uk/20140629102627/http://hpa.org.uk/Topics/InfectiousDiseases/InfectionsAZ/SeasonalInfluenza/EpidemiologicalData/07influsInfluenzaannualreports/. Accessed February 3, 2015
- Fluarix Tetra Summary of Product Characteristics. UK; 2014. http://www.medicines.org.uk/emc/medicine/27537/SPC/Fluarix+Tetra/. Accessed November 3, 2014
- GSK. GSK announces first four-strain seasonal influenza vaccine granted marketing authorisation in Germany and the UK. UK; 2013. http://www.gsk.com/en-gb/media/press-releases/2013/gsk-announces-first-four-strain-seasonal-influenza-vaccine-granted-marketing-authorisation-in-germany-and-the-uk/. Accessed November 3, 2014
- Peasah SK, Azziz-Baumgartner E, Breese J, et al. Influenza cost and cost-effectiveness studies globally - a review. Vaccine 2013;31:5339-48
- Meier G, Pockett RD, McEwan P, et al. Burden of influenza disease in the United Kingdom (UK): a linked General Practice Research Database (GPRD) analysis. ISPOR, 18th Annual International Meeting, New Orleans, LA, USA, 18-22 May 2013
- Meier G, Pockett RD, McEwan P, et al. Influenza-related mortality in the United Kingdom (UK): a linked General Practice Research Database (GPRD) analysis 2001-2009. Control of Influenza VIII, Cape Town, South Africa, 5-10 September 2013
- Matias G, Lustig R, Schuck C, et al. Model estimates of age specific influenza related mortality in the UK in recent years. Influenza Vaccines for the World (IVW 2012), Valencia, Spain, 9-12 October 2012
- Matias G, Taylor RJ, Haguinet F, et al. Model estimates of age-specific influenza-related outpatient visits in the UK in recent years. Options for the Control of Influenza VIII, Cape Town, South Africa, 5-10 September 2013
- Van Bellinghen LA, Meier G, Van Vlaenderen I. The potential cost-effectiveness of quadrivalent versus trivalent influenza vaccine in elderly people and clinical risk groups in the UK: a lifetime multi-cohort model. PLoS One 2014;9:e98437
- National Institute for Health and Care Excellence. Amantadine, oseltamivir and zanamivir for the treatment of influenza. UK; 2009. http://www.nice.org.uk/guidance/ta168/resources/guidance-amantadine-oseltamivir-and-zanamivir-for-the-treatment-of-influenza-pdf. Accessed February 28,2012
- National Institute for Health and Care Excellence. Oseltamivir, amantadine (review) and zanamivir for the prophylaxis of influenza. UK; 2008. http://www.nice.org.uk/guidance/ta158. Accessed February 28, 2012
- National Institute for Health and Care Excellence. The guidelines manual. Assessing cost-effectiveness. UK; 2012. http://www.nice.org.uk/article/pmg6/chapter/7-assessing-cost-effectiveness. Accessed February 3, 2015
- Health Protection Agency. HPA National Influenza Annual Reports. UK; 2011. http://www.hpa.org.uk/Topics/InfectiousDiseases/InfectionsAZ/SeasonalInfluenza/EpidemiologicalData/. Accessed April 19, 2011
- Office for National Statistics (ONS). Population Estimates for UK, England and Wales, Scotland and Northern Ireland, Mid-2011 and Mid-2012. UK; 2013. http://www.ons.gov.uk/ons/publications/re-reference-tables.html?edition=tcm%3A77-319259. Accessed January 20,2015
- Office for National Statistics (ONS). Mortality Rates. UK; 2014. http://www.ons.gov.uk/ons/taxonomy/search/index.html?newquery=*&newoffset=50&pageSize=50&nscl=Mortality+Rates&nscl-orig=Mortality+Rates&content-type=Reference+table&content-type=Dataset&sortBy=pubdate&sortDirection=DESCENDING&applyFilters=true. Accessed October 20, 2014
- Department of Health. Seasonal flu immunisation programme 2011/2012. UK; 2011. https://www.gov.uk/government/uploads/system/uploads/attachment_data/file/216357/dh_128175.pdf. Accessed November 6, 2014
- IBUK- eTRack no.116273. A comprehensive assessment of the full burden of influenza in the United Kingdom, 1996–2008, by age, risk status, vaccination status and influenza subtype. UK: GlaxoSmithKline, data on file, 2013
- Jefferson T, Di Pietrantonj C, Rivetti A, et al. Vaccines for preventing influenza in healthy adults. Cochrane Database Syst Rev 2010;7:CD001269
- Jefferson T, Di Pietrantonj C, Al-Ansary L, et al. Vaccines for preventing influenza in the elderly. Cochrane Database Syst Rev 2010;2:CD004876
- Tricco AC, Chit A, Soobiah C, et al. Comparing influenza vaccine efficacy against mismatched and matched strains: a systematic review and meta-analysis. BMC Med 2013;11:153
- Tappenden P, Jackson R, Cooper K, et al. Amantadine, oseltamivir and zanamivir for the prophylaxis of influenza (including a review of existing guidance no. 67): a systematic review and economic evaluation. Health Technol Assess 2009;13:iii, ix–iii, 1-246
- Turner D, Wailoo A, Nicholson K, et al. Systematic review and economic decision modelling for the prevention and treatment of influenza A and B. Health Technol Assess 2003;7:iii–xiii, 1-170
- Burch J, Paulden M, Conti S, et al. Antiviral drugs for the treatment of influenza: a systematic review and economic evaluation. Health Technol Assess 2009;13:1-iv
- BOI- eTrack no.116313. The burden of illness associated with influenza in the UK. UK: GlaxoSmithKline, data on file, 2013
- Meier G, Pockett RD, McEwan P, et al. Use of antibiotics and prescription medication in influenza disease in the United Kingdom (UK). ISPOR, 16th Annual European Congress, Dublin, Ireland, 2-6 November 2013
- Prescribing and Primary Care team Health and Social Care Information Centre. Prescription Cost and Analysis England 2013. UK; 2014. www.hscic.gov.uk/catalogue/PUB13887/pres-cost-anal-eng-2013-rep.pdf. Accessed February 13, 2015
- British National Formulary Vol. 67. London: British Medical Association and Royal Pharmaceutical Society of Great Britain, 2014
- Personal Social Services Research Unit. Unit Costs of Health and Social Care 2013. UK; 2014. http://www.pssru.ac.uk/project-pages/unit-costs/2013/index.php. Accessed February 13, 2015
- Griffin AD, Perry AS, Fleming DM. Cost-effectiveness analysis of inhaled zanamivir in the treatment of influenza A and B in high-risk patients. Pharmacoeconomics 2001;19:293-301
- Guest JF, Morris A. Community-acquired pneumonia: the annual cost to the National Health Service in the UK. Eur Respir J 1997;10:1530-4
- Meier CR, Napalkov PN, Wegmuller Y, et al. Population-based study on incidence, risk factors, clinical complications and drug utilisation associated with influenza in the United Kingdom. Eur J Clin Microbiol Infect Dis 2000;19:834-42
- Department of Health. NHS charges from April 2013 announced 2014. UK; 2014. https://www.gov.uk/government/news/nhs-charges-from-april-2013-announced. Accessed November 13 2014
- Keech M, Scott AJ, Ryan PJ. The impact of influenza and influenza-like illness on productivity and healthcare resource utilization in a working population. Occup Med (Lond) 1998;48:85-90
- Allsup S, Gosney M, Haycox A, et al. Cost-benefit evaluation of routine influenza immunisation in people 65-74 years of age. Health Technol Assess 2003;7:iii–x–1-65
- Wolleswinkel-van den Bosch JH, Stolk EA, Francois M, et al. The health care burden and societal impact of acute otitis media in seven European countries: results of an Internet survey. Vaccine 2010;28(6 Suppl):G39-52
- Office for National Statistics (ONS). Consumer Price Inflation, December 2013 (Table 9: Detailed indices annual average: 1999 to 2013). UK; 2014
- Office for National Statistics (ONS). Average Weekly Earnings dataset 2013. UK; 2014
- Keech M, Beardsworth P. The impact of influenza on working days lost: a review of the literature. Pharmacoeconomics 2008;26:911-24
- Menzin J, Marton JP, Menzin JA, et al. Lost productivity due to premature mortality in developed and emerging countries: an application to smoking cessation. BMC Med Res Methodol 2012;12:87
- Ara R, Brazier JE. Using health state utility values from the general population to approximate baselines in decision analytic models when condition-specific data are not available. Value Health 2011;14:539-45
- Rothberg MB, He S, Rose DN. Management of influenza symptoms in healthy adults. J Gen Intern Med 2003;18:808-15
- Rothberg MB, Bellantonio S, Rose DN. Management of influenza in adults older than 65 years of age: cost-effectiveness of rapid testing and antiviral therapy. Ann Intern Med 2003;139:321-9
- Rawlins M, Barnett D, Stevens A. Pharmacoeconomics: NICE's approach to decision-making. Br J Clin Pharmacol 2010;70:346-9
- Clements KM, Meier G, McGarry LJ, et al. Cost-effectiveness analysis of universal influenza vaccination with quadrivalent inactivated vaccine in the United States. Hum Vaccin Immunother 2014;10:1171-80
- Lee BY, Bartsch SM, Willig AM. The economic value of a quadrivalent versus trivalent influenza vaccine. Vaccine 2012;30:7443-6
- Reed C, Meltzer MI, Finelli L, et al. Public health impact of including two lineages of influenza B in a quadrivalent seasonal influenza vaccine. Vaccine 2012;30:1993-8
- Van Vlaenderen I, Van Bellinghen LA, Meier G, et al. An approximation of herd effect due to vaccinating children against seasonal influenza - a potential solution to the incorporation of indirect effects into static models. BMC Infect Dis 2013;13:25
- Caljouw MA, Kruijdenberg SJ, de Craen AJ, et al. Clinically diagnosed infections predict disability in activities of daily living among the oldest-old in the general population: the Leiden 85-plus Study. Age Ageing 2013;42:482-8
- Gozalo PL, Pop-Vicas A, Feng Z, et al. Effect of influenza on functional decline. J Am Geriatr Soc 2012;60:1260-7