
Abstract
Objective:
This proof of concept study aimed to determine whether a pharmacist-managed medication therapy management (MTM) program in a private endocrinologist physician’s practice reduced healthcare services utilization and related costs 6 months after patients’ discharge from an institution with a transition of care service.
Methods:
Patients were included in the study if they were English-speaking, ages >18 years, had type 1 or 2 diabetes, and had a recent transition of care experience (inpatient hospital stay or emergency department/urgent care/paramedic or other acute care visit). The study had a non-randomized design where intervention patients, enrolled July 1, 2012–September 30, 2013, were administered MTM at four visits over 6 months and were compared to historical control patients with available electronic medical records from August 8, 2008 to March 15, 2012. The primary study end-point was the rate of 30-day hospital readmissions, as related to the reason for the index admission. Secondary end-points included the cumulative rate of all-cause hospitalizations, emergency department, paramedic and urgent care visits at 30, 60, 90, and 180 days post-discharge as well as imputed total costs, including prescription medication costs, at 180 days. Propensity score weights were constructed to balance covariate characteristics between the intervention and control groups. Weighted multivariate negative binomial and generalized linear regressions were used to model cumulative utilization rates and log-transformed costs, respectively.
Results:
The intervention (n = 28) and control (n = 73) groups had 0% hospital readmissions at 30 days post-discharge. In propensity score weighted multivariate analyses, cumulative utilization rate was not different between the two groups (IRR = 1.61, p = 0.72 at 180 days) while costs in the intervention group were lower but not statistically different (cost ratio = 0.65, p = 0.13 at 180 days).
Conclusions:
Further studies should investigate whether the integration of pharmacists in transition of care models could reduce readmission and healthcare utilization rates post-discharge.
Background
Prescription medications represent a significant portion of healthcare costs for diabetesCitation1. Complex drug combinations are often prescribed to treat patients diagnosed with multiple chronic diseases and health conditions concurrent with diabetes. However, the complexity and potency of drug therapy do not always translate into improved patient outcomes. Confusion about how to take prescribed medications can adversely affect patients’ adherence to their medication regimen or can result in adverse drug reactions or drug–drug interactionsCitation2. When individuals are hospitalized, medication regimens for self-management become disrupted by complex and potentially duplicative treatments. Upon discharge, the failure to identify medication-related gaps, redundancies, and potential interactions puts patients at risk of readmission to the hospitalCitation3. Therefore, medication reconciliation and medication therapy management are optimal services for hospital discharge and transitions of care processes that could help reduce rates of readmissionCitation4.
Medication management and reconciliation services include the identification of drug-related problems beyond unintended discrepancies (omission, incorrect frequency, incorrect dosage, incorrect route, unnecessary medication), which can occur at admission and discharge, and regular patient contact after discharge to ensure adequate self-management of medicationsCitation5,Citation6. Two recent systematic reviews evaluated the effects of hospital-based medication reconciliation on 30-day post-discharge emergency department (ED) visits and readmissionsCitation7,Citation8. The reviews found that, although the results of such programs on readmission rates and healthcare utilization reductions are inconsistent, successful interventions were found to be pharmacist-led and targeted high-risk patientsCitation7,Citation8. Although most studies examined the effects of pharmacist-led medication review and reconciliation on 30-day readmissions, the effects of medication reconciliation are often observed much later than the commonly evaluated 30 days post-discharge windowCitation7,Citation8. For example, a randomized clinical trial on hospital utilization at 12 months post-discharge showed that medication reconciliation was associated with a significant reduction (16%) in all hospital visitsCitation9. However, there is limited evidence on the cost evaluation of the medication reconciliation processCitation7.
This proof of concept study aimed to determine if a pharmacist-managed comprehensive medication therapy management (MTM) program in a private endocrinologist physician’s practice reduced healthcare services utilization and related costs 6 months after a patient was discharged home from an institution with a transition of care service. Additionally, the study explored if the pharmacist-led MTM program decreased the number of medication-related problems and promoted their resolution when compared with baseline. These findings will be published elsewhere.
Methods
Study design
This study had a non-randomized design with a historical control group. The time frame for identifying the intervention group was a 15-month screening period from July 1, 2012–September 30, 2013 and for the control group was August 8, 2008–March 15, 2012.
Eligible subjects for the intervention arm of the study included patients at the private endocrinology practice Bay West Endocrinology Associates in Baltimore, MD, who were English-speaking, aged >18 years, with either type 1 or 2 diabetes, and had a recent transition of care experience (inpatient hospital stay or emergency department/urgent care/paramedic or other acute care visit). There were several additional inclusion criteria for the control arm. To be included in the study, a control patient must: (a) have returned to the endocrinology practice following the urgent or emergent care; (b) have had a minimum of one HbAlc laboratory value post-urgent episode; and (c) have had at least 6 months of follow-up data accessible via electronic medical records (EMR). Patients from both groups were excluded if they were involved in any other comprehensive MTM program or randomized control trial utilizing experimental diabetes therapies. Additional exclusion criteria were: pregnancy, patient death as the outcome of the urgent care event, lack of access to transitions of care records, and patient eligibility for both arms of the study.
Recruitment
Consistent with the study sample size and power calculations, according to which we estimated we need 150 patients split between the two groups, we enrolled 73 historic control patients that were screened over the designated period and had met inclusion/exclusion criteria. For the intervention group, an ambulatory care clinical pharmacist faculty and an ambulatory care postgraduate year 2 (PGY2) pharmacy resident identified eligible patients from discharge lists created by the endocrinology team of the practice’s patients that were discharged on a weekly basis during the 15-month screening period for intervention patients. This list was an ongoing list embedded within the health-system’s EMR. The pharmacists contacted patients eligible to participate in the treatment group in order to enroll patients and obtain informed consent. The primary enrollment goal was to obtain the patient names within 48 h of discharge from provider referrals and secondarily from the ongoing discharge list in the EMR system. However, there were limited provider referrals accompanied by a significant delay in the posting of the discharge list, which extended the screening period to up to 2 weeks post-discharge.
Informed consent documentation was obtained for all patients enrolled in the intervention arm of the study. The study was approved by the Investigational Review Boards of the University of Maryland, Baltimore, MD, USA (# HP-00051993) and the Greater Baltimore Medical Center, Baltimore, MD, USA (# 12-025-05).
Intervention
The intervention encompassed a 6-month, four-visit process of patient care including: reconciling medications; preparing a reconciled medication list and medication therapy plan; medication counseling; monitoring clinical laboratory results; evaluating patient response to therapy; and communicating regularly with the patient’s caregivers and in-practice provider. Enrolled patients were scheduled for a visit with a pharmacist administering the intervention soon after the index urgent care episode (baseline visit), and for additional visits (∼1, 3, and 6 months later, and as needed) during the 6-month follow-up period.
Study end-points
The primary study end-point was the mean rate of hospital readmissions at 30 days post-discharge, defined as hospitalizations related to the initial reason for the index transition of care episode. Secondary end-points included the (a) cumulative healthcare utilization (count) rate of all-cause hospitalizations or emergency department (ED), urgent care, or paramedic visits at 30, 60, 90, and 180 days post-discharge; (b) cumulative healthcare utilization rate related to medication-related problems; and (c) prescription and total costs at 180 days post-discharge.
Data sources
As medical records may or may not have indicated the totality of health services utilization information from all hospitals, EDs, and acute care centers, the pharmacist used both electronic medical records and elicited self-reported utilization information from patients in the intervention group. In contrast, for the control group, healthcare utilization was obtained from patients’ electronic medical records only.
The costs for all-cause hospitalizations ($14,657), urgent care/ED visits ($1046), all-cause physician visits ($208), and any other type of hospital outpatient visit ($984) were imputed using published cost estimates by the Medicare Expenditure Panel Survey (MEPS) from year 2012 and inflated to 2014 using the Medical Care section of the Consumer Price Index (2% and 3% for 2013 and 2014, respectively)Citation10. MEPS provides nationally representative estimates of healthcare use and expenditure from an all-payer perspectiveCitation11. Using the prescribed dosage from the patient’s medical record and the average wholesale price for each medication as reported in 2014 in the Micromedex 2.0 RED BOOK Online Database (Truven Health Analytics Inc., Ann Arbor, MI), prescription costs were imputed assuming 80% adherence.
The cost of the intervention was estimated to be an average of $562 per patient in 2014. The method to calculate the hourly pharmacist rate is as follows. Pharmacist fees were determined using a blended rate for retail, academic, and resident pharmacists. The labor hours were used consistently with federal costing procedures to determine an hourly rate. As a result, the per minute rate was $2.35. With overheads, the per minute rate was $3.53. This included the assumption of a 50% facilities and overhead rate at the clinical practice. The total time in face-to-face service provision with the patient over a 6-month period of time was 2 h 39 min.
Total costs, calculated over the follow-up period, included the costs for prescription drugs, all-cause hospitalizations, urgent care/ED/paramedic visits, all-cause physician visits, hospital outpatient visits, as well as the cost of the intervention for treated patients. In sensitivity analysis, prescription and total costs were calculated using an assumption of 60% medication adherence.
Covariates
We collected the following covariates as part of the study: patient age, race/ethnicity, gender, insurance (private or public or none), diabetes type, length of history with diabetes (in years), tobacco use, Charlson Co-morbidity Index score, clinical indicators (HbA1c, glucose, total cholesterol, BMI, systolic and diastolic blood pressure at baseline), number of diabetes-related and any medications taken, number of physician visits at baseline, length of stay at index discharge, time between index discharge and first case co-ordinator (for controls) or pharmacist (for intervention) visits, as well as whether patients were discharged from hospitalization or the urgent care/emergency department.
Statistical analysis
Given the non-randomized design of the study and the use of historical controls, we constructed propensity score weights to balance covariate characteristics between the intervention and control groups. Control patients were weighted to represent the population characteristics of the intervention group while patients in the intervention group received a weight of 1. The propensity score weights were constructed using the twang package (Toolkit for Weighting and Analysis of Nonequivalent Groups) in RCitation12, which employs an iterative fitting algorithm based on recursive partitioning with boosted regression trees. In simulations, this propensity score weights estimation procedure for multiple groups has proven to provide more stable weights than parametric modelsCitation13,Citation14 and has substantially outperformed logistic regression in achieving covariate balanceCitation15. Further descriptive and multivariate analyses incorporated the generated propensity score weights.
As we expected the two groups to have differential follow-up, end-points were evaluated among intervention and control patient cohorts with an equal period of follow-up at 30, 60, 90, 120, and 180 days post-discharge. As utilization data was over-dispersed, we compared hospital readmissions and cumulative utilization rates using weighted univariate negative binomial regressions. After testing for skewness in the distribution of costs using the modified Park test, medical- and pharmacy-related costs were log-transformed and were compared using a weighted generalized linear model with an identity link function, which was the model specification that resulted in best fit. Weighted multivariate negative binomial regressions were used to model hospital readmissions and cumulative utilization rates at 90, 120, and 180 days post-discharge and weighted multivariate generalized linear regression with an identity link function modelled log-transformed costs at 180 days.
We verified linearity assumptions of continuous variables and explored best model fit by stratifying the variable into categories approximating the empirical quartile points of its distribution. In multivariate analyses, we retained those variables that had overall F-test significance of p ≤ 0.20, did not exhibit sizeable multicollinearity, or were of higher clinical interest. All tests were two-tailed. Given the exploratory nature of this study, we considered findings with p ≤ 0.05 to be statistically significant while 0.05 < p ≤ 0.10 to have some evidence of an association.
Results
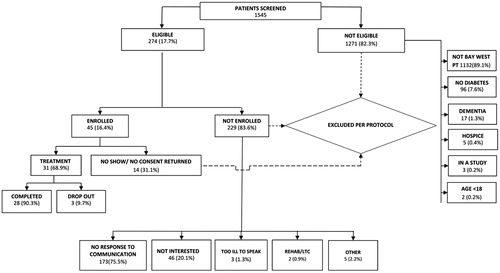
For the intervention group, during the 15-month screening period from July 1, 2012 to September 30, 2013 pharmacists screened 1545 recently discharged patients from the hospital’s inpatient endocrinology service for eligibility, and found 274 (17.7%) eligible patients based on the inclusion/exclusion criteria (). Overall, 1514 (98%) of the screened endocrinology patients were excluded from the MTM program: 1271 (83.9%) due to study ineligibility, 173 (11.4%) did not respond to pharmacist’s telephone, letter and/or email communication; 46 (2.98%) verbally stated their disinterest, and 14 (0.9%) did not show to the baseline appointment as promised. All eligible patients were offered the free MTM program, and 31 (11%) of the eligible patients showed for the appointments, consented, and were enrolled, and 28 of 31 (90%) completed the transition of care program until the study conclusion, December 31, 2013.
Figure 1. Patients screening and enrollment flow chart.
The finalized analytic cohort consisted of 28 intervention and 73 control patients. There were no differences between the two groups with respect to the reasons for the index admission, with ∼75% of the initial index admissions (as determined at discharge) being non-diabetes related. At baseline, compared to the control group, the intervention group had higher number of diabetes-related drugs (from categories of cardiovascular, anti-hypertensive, anti-dyslipidemic, and oral and injectable anti-hyperglycemic agents), had a higher number of all-cause physician visits (including endocrinologist visits) at the index admission, and more intervention patients were African Americans and discharged from a hospitalization (vs urgent care/ED/paramedic visit) ().
Table 1. Baseline characteristics.
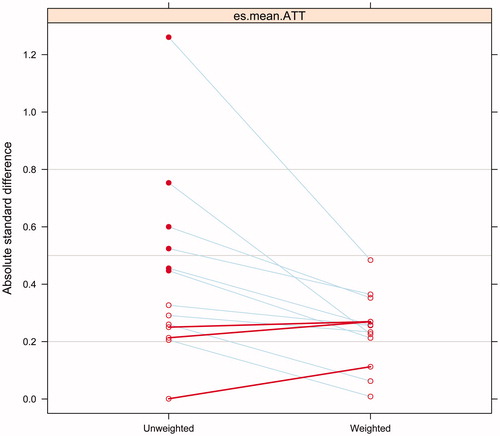
We propensity score weighted the sample on the following variables: age, gender, race, having private insurance, length with diabetes, BMI, HbA1c, if discharged from hospital or emergency/urgent care, length of stay, as well as number of diabetes related drugs. We considered standardized mean differences between covariates (absolute standardized bias) of less than 0.20 to be small, 0.40 to be moderate, and 0.60 to be large, as previously recommendedCitation15,Citation16. Propensity score weighted analysis substantially reduced and in some case eliminated baseline covariate differences between the two groups ( and ).
Figure 2. Effect of propensity score weighting at reducing absolute standard difference among treatment groups.
Primary end-point
With regard to the primary outcome of the study, both control and intervention groups had a readmission rate, as related to the disease diagnosis at the index admission, of 0% at 30 days post-discharge.
Secondary end-points
In weighted analyses, the intervention group exhibited a similar all-cause hospitalization count rate as the control group at 30, 60, 90, 120, or 180 days post-discharge (). The intervention group had a trend toward a significantly higher utilization rate of urgent care/ED visits at 90 days post-discharge compared with the control group (0.19 vs 0.04; p = 0.06). With respect to the cumulative utilization rate of hospitalizations, urgent care/ED, and paramedic visits, there were no significant differences between the intervention and the control groups. Analyzing only those hospitalizations, urgent care/ED, and paramedic visits that were related to medication problems, we found no statistical differences in the utilization rates between the two groups during the follow-up period (0.00 vs 0.07; p = 0.20 for the hospitalization count rate at 180 days; and 0.17 vs 0.08; p = 0.50 for the cumulative health care utilization count rate at 180 days).
Table 2. Health services utilization count rates over time, expressed as counts of transitions per patient.
Total costs over the 6-months follow-up period did not differ between the two groups in unadjusted weighted descriptive analyses. Assuming 80% medication adherence, total mean costs at 6 months post-discharge were $33,547 and $29,664 for the control and intervention groups, respectively (p = 0.65). Prescription medication costs constituted the major portion of mean total costs, with $26,290 and $20,030 for the control and intervention groups, respectively (p = 0.33).
In weighted multivariate regression analyses controlling for the type of the index transition, the number of physician visits at baseline, as well as socio-demographics, length of history with diabetes, and medical comorbidities, the intervention group did not differ with respect to the cumulative healthcare utilization rate (incident rate ratio [IRR] = 1.61, p = 0.84 at 90 days; IRR = 0.59, p = 0.86 at 120 days; and IRR = 1.61; p = 0.72 at 180 days), compared with the control group ().
Table 3. Cumulative count rate of hospitalizations and urgent care visits over 180 days (weighted analyses).
Employing an identical set of control variables, weighted multivariate regression models on transformed log-costs at 180-days showed the intervention group to be associated with 35% lower pharmacy costs (cost ratio 0.65; p = 0.13) and 27% lower total costs (cost ratio 0.73; p = 0.20) than the control group, not statistically significantly ().
Table 4. Imputed prescription medication and total costs at 6 months (weighted analyses).
In a sensitivity analyses, we frequency matched patients who completed 180 of follow-up on race, HbA1c at baseline (3 bands: <7.0%, ≥7.0% to ≤9.0%, and >9.0%), and if length of history with diabetes was >10 years, which, however, reduced our sample size to 14 intervention patients and 34 controls. In multivariate analyses in this restricted sub-set of patients, the intervention group was associated with 38% lower pharmacy costs (cost ratio = 0.62; p = 0.08) and 32% lower total costs (cost ratio = 0.68; p = 0.12) than the control group.
Discussion
Pharmacists’ co-ordinated interaction with primary care physicians, and their overall integration into the multidisciplinary care of the patient along with other providers such as nurses and social workers could be instrumental in improving the quality of patients’ transitions between care settingsCitation17,Citation18. Pilot projects involving collaborating physicians and pharmacists to improve the hospital discharge process are currently being tested and are hoped to become integrated into evolving team-based care delivery models, such as accountable care organizations (ACOs), patient-centered medical homes (PCMHs)Citation19,Citation20, as well as ‘virtual care team’ modelsCitation21. As a lack of guidance still exists for transitions of care management, new team-based models that incorporate pharmacists, such as PCMHs and ACOs, could be instrumental in improving patient care, reducing hospital readmissions, and driving down unnecessary healthcare costs. In order for such models to be successful in the long-term, approaches to engaging stakeholders and eliciting patients’ preferences are needed to direct provider and patient interactionCitation21.
In this study, we explored whether an intervention by pharmacists could be valuable in reducing the risk of readmissions, cumulative healthcare utilization, as well as costs. However, we found that MTM administered by pharmacists had no demonstrable impact on all-cause hospitalizations and urgent care/ED visits or paramedic visits compared to the control group. No same-cause readmissions were recorded for either group. Furthermore, it was inconclusive whether comprehensive medication review was associated with reduced pharmacy and total costs at the conclusion of the 6-month intervention. In a sensitivity analysis in which we matched interventions and control patients who completed 180 days of follow-up according to race, longer history with diabetes, and HbA1c levels at baseline, we found the intervention group to exhibit a trend toward lower medication costs. However, those results are relevant only to the restricted sub-sample. The benefits of the intervention, however, could be detectable beyond 6 months and a study with a larger sample size, more rigorous design, and longer duration is needed.
Our study results agree with those of a Cochrane collaboration systematic review, which found no evidence of the effect of MTM on hospital readmissions and highlighted that the cost-effectiveness of medication review could not be determinedCitation22. One potential reason why we didn’t observe a difference between the two groups could be that the study population might not have been a high risk population in which the effect of MTM could be realized. In our study, we observed low rate of readmissions (0% in both groups) and all-cause hospitalizations (4% and 3% for the intervention and control groups, respectively) at 30 days post-discharge. As a comparison, the national 30-day all-cause readmission rate for Medicare patients was 19% (average) from 2007–2011Citation23. Additionally, HbA1c rates in our study were overall well-controlled, with average values close to 8.0% at baseline.
There were several limitations to our study. Intervention patients had shorter time to first contact with a pharmacist (17 vs 25 days to first contact with co-ordinator in controls, p = 0.05), which could have been due in part to telephone calls, letters, and other outreach efforts made by the pharmacist to recruit patients for the intervention. In order to recruit eligible patients, we used a variety of communication strategies including 419 telephone calls, 223 recruitment letters, 12 in person communications at the clinic setting and nine emails. For a majority (90%) of intervention patients, the first baseline pharmacist contact was initiated within 30 days post-index discharge, compared to a smaller proportion (<75%) among control group patients who were contacted by a care co-ordinator during the same time frame. Furthermore, the only data received for the control group was that from medical charts; therefore, the intervention group, in whom we captured data using medical records and patient’s self-report, would likely overall have reported more utilization. Additionally, we did not have access to patient’s claims data and had to impute pharmacy and medical costs using information from various sources, which may not represent actual costs. Furthermore, as we estimated costs from an all-payer perspective, the calculated health system’s cost for the MTM intervention may be an under-estimate of the true cost, as many payers do not explicitly cover transitions of care services.
Additionally, due to the small sample size of our pilot study, we might not have had the necessary power to detect significant differences between groups. Furthermore, we employed a non-randomized study design and a historical cohort; this approach leaves the potential for residual confounding due to missing important covariates such as socioeconomic status, education, or health severity measures, as well as temporal differences in practice patterns. We addressed the possible limitation of residual confounding by using a propensity score weighting approach based on a machine-learning technique, which eliminated observable covariate differences between the two groups. However, despite employing propensity score weighting and additionally controlling for important health indicators in multivariate models, missing unobserved variables could have prevented us from detecting a positive effect of MTM on utilization rates. For example, the intervention group had a significantly higher proportion of African American patients. Among Medicare patients, African Americans have been shown to have higher 30-day readmission rates compared with Whites, even after adjusting for underlying individual readmission risk characteristics, hospital quality, or poverty characteristicsCitation24. It should be noted that, in another pilot study with a small sample size (n = 61) and randomized design, patients randomized to the intervention arm had lower rates of the primary composite outcome of 30-day readmission and ED visits compared with the control group (0% vs 40.5%; p < 0.001)Citation25. These findings highlight the need for randomization and an equal balance of important covariates between study groups.
Conclusions
In this small pilot study, we did not find a pharmacist-led MTM intervention to be associated with reduced hospital readmissions and cumulative health services utilization over a 6 month period post-discharge. Study results are inconclusive regarding the impact of the intervention on total costs at 180 days post-discharge but analysis in a matched subset of the patient population found a trend toward lower pharmacy and total medical costs. However, whether the reduction in costs could be attributed to the successful role of the pharmacist in identifying and addressing medication-related problems due to transitions of care should be examined in a future study.
Transparency
Declaration of funding
This study was funded through a research grant by Sanofi US, Inc. protocol # CPTS23651. The sponsor had a collaborative role in the design and conduct of the study but not the collection, management, or analysis of the data.
Declaration of financial/other relationships
The authors have no conflict of interest in association with the publication of the article.
Acknowledgments
The authors received editorial support in the preparation of this manuscript provided by Tessa Hartog, PhD, of Excerpta Medica, funded by Sanofi US, Inc. We acknowledge the contributions of: Statisticians Kimberly Martin, PhD, and Viktor Chirikov, MS; Consultant Ian Breunig, MS; Clinical Research Associates Ednner Oketch, MS, and Igeoma Agwu, BSc; Access Database Developers Shinyi Huang, PharmD, and Viktor Chirikov, MS; Pharmacist Diane Hadley, PharmD; Research Historical Data Collection Staff Nkem Nonyel, PharmD, Michelle Vo, PharmD, Teresa Chang, PharmD, Elaine Yip, PharmD, and Hellena Admassu, PharmD, who were students at the time of data collection; Kathleen Dury, the Center for Innovative Pharmacy Solutions (CIPS) Coordinator and Magaly Rodriguez de Bittner, PharmD, BCPS, CDE, Professor and Chair, Department of Pharmacy Practice and Science.
References
- Hansen RA, Farley JF, Droege M, et al. A retrospective cohort study of economic outcomes and adherence to monotherapy with metformin, pioglitazone, or a sulfonylurea among patients with type 2 diabetes mellitus in the United States from 2003 to 2005. Clin Ther 2010;32:1308-19
- Bonnet-Zamponi D, d'Arailh L, Konrat C, et al. Drug-related readmissions to medical units of older adults discharged from acute geriatric units: results of the Optimization of Medication in AGEd multicenter randomized controlled trial. J Am Geriatr Soc 2013;61:113-21
- Abrashkin KA, Cho HJ, Torgalkar S, et al. Improving transitions of care from hospital to home: what works? Mt Sinai J Med 2012;79:535-44
- Geurts MM, Talsma J, Brouwers JR, et al. Medication review and reconciliation with cooperation between pharmacist and general practitioner and the benefit for the patient: a systematic review. Br J Clin Pharmacol 2012;74:16-33
- Buckley MS, Harinstein LM, Clark KB, et al. Impact of a clinical pharmacy admission medication reconciliation program on medication errors in “high-risk” patients. Ann Pharmacother 2013;47:1599-610
- Michel B, Quelennec B, Andres E. Medication reconciliation practices and potential clinical impact of unintentional discrepancies. JAMA Intern Med 2013;173:246-7
- Kwan JL, Lo L, Sampson M, et al. Medication reconciliation during transitions of care as a patient safety strategy: a systematic review. Ann Intern Med 2013;158:397-403
- Mueller SK, Sponsler KC, Kripalani S, et al. Hospital-based medication reconciliation practices: a systematic review. Arch Intern Med 2012;172:1057-69
- Gillespie U, Alassaad A, Henrohn D, et al. A comprehensive pharmacist intervention to reduce morbidity in patients 80 years or older: a randomized controlled trial. Arch Intern Med 2009;169:894-900
- Bureau of Labor Statistics. Archived Consumer Price Index detailed report information. Consumer Price Index for All Urban Consumers (CPI-U): U. S. city average, by expenditure category (Years 2013 & 2014). http://www.bls.gov/cpi/cpi_dr.htm#2014. Accessed May 10, 2015
- U.S. Department of Health & Human Services. Agency for Healthcare Research and Quality. Medicare Expenditure Panel Survey (MEPS). 2012. http://meps.ahrq.gov. Accessed November 10, 2014
- Ridgeway G, McCaffrey DF, Morral AR, et al. Toolkit for weighting and analysis of nonequivalent groups: a tutorial for the Twang Package. R vignette. RAND (2014). http://cran.r-project.org/web/packages/twang/. Accessed April 16, 2015
- Harder VS, Stuart EA, Anthony JC. Propensity score techniques and the assessment of measured covariate balance to test causal associations in psychological research. Psychol Methods 2010;15:234-49
- Lee BK, Lessler J, Stuart EA. Improving propensity score weighting using machine learning. Stat Med 2010;29:337-46
- McCaffrey DF, Griffin BA, Almirall D, et al. A tutorial on propensity score estimation for multiple treatments using generalized boosted models. Stat Med 2013;32:3388-414
- Cochran WG. The effectiveness of adjustment by subclassification in removing bias in observational studies. Biometrics 1968;24:295-313
- Graabaek T, Kjeldsen LJ. Medication reviews by clinical pharmacists at hospitals lead to improved patient outcomes: a systematic review. Basic Clin Pharmacol Toxicol 2013;112:359-73
- Lu Y, Clifford P, Bjorneby A, et al. Quality improvement through implementation of discharge order reconciliation. Am J Health Syst Pharm 2013;70:815-20
- Smith M, Bates DW, Bodenheimer TS. Pharmacists belong in accountable care organizations and integrated care teams. Health Aff (Millwood) 2013;32:1963-70
- Erickson S, Hambleton J. A pharmacy's journey toward the patient-centered medical home. J Am Pharm Assoc (2003) 2011;51:156-60
- Schnur ES, Adams AJ, Klepser DG, et al. PCMHs, ACOs, and medication management: lessons learned from early research partnerships. J Manag Care Pharm 2014;20:201-5
- Christensen M, Lundh A. Medication review in hospitalised patients to reduce morbidity and mortality. Cochrane Database Syst Rev 2013;2:CD008986
- Gerhardt G, Yemane A, Hickman P, et al. Medicare readmission rates showed meaningful decline in 2012. Medicare Medicaid Res Rev 2013;3:E1-E12
- Tsai TC, Orav EJ, Joynt KE. Disparities in surgical 30-day readmission rates for Medicare beneficiaries by race and site of care. Ann Surg 2014;259:1086-90
- Hawes EM, Maxwell WD, White SF, et al. Impact of an outpatient pharmacist intervention on medication discrepancies and health care resource utilization in posthospitalization care transitions. J Prim Care Community Health 2014;5:14-18