
Abstract
Objective:
This study estimated the economic burden of obesity-related comorbidities (ORCs) in the US, at both the person and population levels.
Methods:
The Geisinger Health System provided electronic medical records and claims between January 2004 and May 2013 for a sample of 153,561 adults (50% males and 97% white). Adults with < 2 years of data, who were underweight (body mass index (BMI) < 18.5 kg/m2), or had diseases causing major weight change (e.g., malignancy) during the study period (i.e., continuous enrollment in health plans) were excluded. A total of 21 chronic conditions, with established association with obesity in the literature, were identified by diagnosis codes and/or lab test results. The total healthcare costs were measured in each year. The association between annual costs and ORCs was assessed by a regression, which jointly considered all the ORCs. The per-person incremental costs of a single comorbidity, without any of the other ORCs, were calculated. The population-level economic burden was the product of each ORC’s incremental costs and the annual prevalence of the ORC among 100,000 individuals. The prevalence of ORCs was stratified by obesity status to estimate the economic burden among 100,000 individuals with obesity and among those without.
Results:
This study identified 56,895 adults (mean age = 47 years; mean BMI = 29.6 kg/m2). The annual prevalence of ORCs ranged from 0.5% for pulmonary embolism (PE) to 41.8% for dyslipidemia. The per-person annual incremental costs of a single ORC ranged from $120 for angina to $1665 for PE. Hypertensive diseases (HTND), dyslipidemia, and osteoarthritis were the three most expensive ORCs at the population level; each responsible for ≥$18 million annually among 100 000 individuals. HTND and osteoarthritis were much more costly among individuals with obesity than those without obesity.
Limitations:
Data were from a small geographic region.
Conclusions:
ORCs are associated with substantial economic burden, especially for those requiring continuous treatments.
Introduction
Obesity is a major public health problem in the US, with over one-third (35.7%) of the population having a body mass index (BMI) ≥30 kg/m2 Citation1. Being overweight or obese is a risk factor for numerous costly co-morbidities, including type 2 diabetes (T2D), cardiovascular disease, sleep apnea, chronic pain, and certain cancersCitation2. Annual spending related to obesity and its associated comorbidities is estimated at $315.8 billion in 2010, accounting for 27.5% of US healthcare expendituresCitation3. Costs related to being overweight or obese are projected to reach $861 billion in 2030Citation4.
Considerable literature exists that quantifies the increased risk of comorbidities associated with obesity, including a meta-analysis of 89 studies across 18 comorbiditiesCitation2. The positive association between obesity and risk of comorbidities contributes to the high economic burden of obesity. The cost implications of obesity specific to T2D, one of the most costly and prevalent comorbidities, has been a subject of researchCitation5. For example, recent studies have demonstrated that a higher risk of glycemic stage progression and higher costs within each glycemic stage are associated with increasing BMI levelsCitation6,Citation7. Among female patients with depression, the positive association between depression and being overweight or obese was expected to increase the economic burden of depression by 10%Citation8.
With respect to research on multiple comorbidities, a recent study evaluated the healthcare costs of diabetes, hypertension, depression, and congestive heart failure among obese patients from claims data in the USCitation9. Also, a German study has examined the cost contributions of diabetes and three cardiovascular comorbidities (myocardial infarction, hypertension, and stroke) to the costs of obesityCitation10.
Comprehensive evaluation of the economic burden of obesity-related comorbidities (ORCs) in the US is scarce. The objective of this research, therefore, is to demonstrate the economic burden of obesity through a wide range of ORCs using integrated electronic medical records (EMR) and claims data. We not only estimated the healthcare costs associated with the comorbidities at the patient level, but also evaluated total costs at the population level by incorporating the prevalence of the comorbidities. The economic impact of obesity through increased risk of comorbidities was estimated.
Patients and methods
Data source and sample selection
The analyses used the MedMining database, which contains EMR from the Geisinger Health System and claims data for enrollees in the Geisinger Health Plan (GHP). The Geisinger Health System is an integrated health system serving northern Pennsylvania with a 1200+ member multi-specialty physician group practice, 83 primary and specialty clinic sites, nine hospital campuses, two research centers, a 467,000-member health plan, and millions of patients. The availability of both EMR and claims data, including clinically collected BMI on over 80% of the Geisinger population with office visits, offers an excellent opportunity to assess the costs of ORCs.
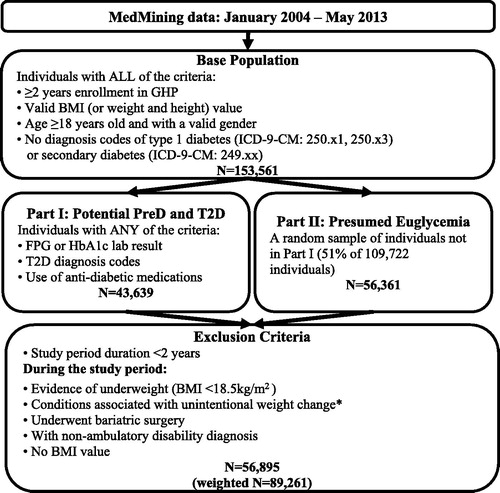
The current study examined the same study population and followed similar sample selection criteria as in two previously published studies that evaluated the impact of different levels of obesity on the risk of glycemic stage progression and the total healthcare costs within each glycemic stageCitation6,Citation7. The detailed information of the MedMining database and the study population has been previously reportedCitation6,Citation7. In brief, we selected all individuals (Part I sample) with glycemic lab tests (fasting plasma glucose [FPG] or glycosylated hemoglobin [HbA1c]), T2D diagnosis codes, or use of anti-diabetic medications; then, from the remaining individuals whose glycemic status could not be identified, we randomly selected a sample (Part II sample) to follow the data size restriction of up to 100,000 individuals requested by Geisinger. The final sample, after selection steps listed in , were followed from the start of continuous enrollment until any pregnancy, and the annual data with full-year GHP plan enrollment were examined.
Figure 1. *Sample selection flow chart. Conditions include malignancy, human immunodeficiency virus, cachexia, anorexia, abnormal weight gain or loss, feeding difficulties, gastrointestinal disorders, inflammatory bowel diseases, pancreatitis, and nutritional deficiencies (except for vitamin deficiency). BMI, Body mass index; FPG, Fasting plasma glucose; HbA1c, Glycosylated hemoglobin; ICD-9-CM, International Classification of Diseases, Ninth Revision, Clinical Modification; GHP, Geisinger Health Plan; T2D, Type 2 diabetes.
Study measures
As listed in , a total of 21 chronic conditions linked with obesity were identified from the literature, such as hypertension, dyslipidemia, T2D, depression, chronic obstructive pulmonary disease and osteoarthritisCitation2,Citation5. The comorbidities that occurred during the study period were identified by ICD-9-CM (International Classification of Diseases, Ninth Revision, Clinical Modification) diagnosis codes (Supplementary Data, Table A). The occurrence of a specific ORC, except for pre-diabetes and T2D, was confirmed by two outpatient claims or one inpatient claim with the related diagnosis code. Pre-diabetes and T2D were defined by the glycemic lab tests, T2D diagnosis by ICD-9 CM codes, and/or use of anti-diabetic medications, following a previously published algorithm which used the glycemic level cut-offs recommended by the American Diabetes AssociationCitation6,Citation7. In addition to the diagnosis codes, non-alcoholic fatty liver disease (NAFLD) was also identified by abnormal liver blood test results (i.e., elevated aspartate aminotransferase [AST] >40 U/L, or alanine aminotransferase [ALT] >30 U/L in men and >19 U/L in women), without ALT to AST ratio ≥2 or diagnosis of alcoholic liver during the study periodCitation11–13. To reflect the chronic feature of these comorbidities, the occurrence of an ORC was assumed to persist once the corresponding diagnosis codes and/or clinical biomarkers were observed in the study period. An individual could have multiple ORCs at the same time; however, the occurrence of pre-diabetes ended when the individual progressed to T2D.
Table 1. Annual prevalence of obesity-related comorbidities.
Demographic characteristics were measured in each year during the study period and included age, gender, race, smoking, employment status, insurance type, and year (from 2004–2012). The healthcare costs associated with the GHP claims were also calculated for each year. Unit costs from external sources were assigned to claims following a previously published approach (details summarized in Supplementary Data, Table B)Citation7, as financial amounts were not released by Geisinger. Specifically, inpatient stays were matched to costs reported in the National Inpatient Sample from the Healthcare Cost and Utilization Project (HCUP) surveyCitation14, outpatient services were mapped to Medicare fee-for-service fee schedulesCitation15, and pharmacy costs were estimated based on average wholesale price from Truven Health Analytics’ Red BookCitation16. Costs were adjusted to 2013 dollars using the US Medical Consumer Price IndexCitation17.
Statistical analysis
Annual prevalence rates of ORCs were estimated by the proportion of individuals, with full enrollment during a given year, who experienced the relevant comorbidity. The overall average annual prevalence rate across all years in the study period was estimated by taking the weighted average of the annual rates, where the weights were the number of individuals in each year. The annual prevalence rates were also calculated for obese individuals (mean BMI during the study period ≥30 kg/m2) and non-obese individuals.
The associations between annual costs and ORCs were assessed by a generalized linear regression model (GLM) with a log link and gamma distribution, adjusted for demographics. All of the 21 ORCs were jointly considered in this regression, specified as:
. The repeated measures design was used to correctly account for the effects of multiple years per individual. The regression generated the adjusted ratios of costs associated with an ORC. The incremental costs of a single comorbidity, given no occurrence of any of the other ORCs, were calculated as the mean differences between (1) predicted costs assuming that all individuals had only the specific comorbidity, and (2) predicted costs assuming none of the individuals had any of the ORCsCitation18.
To illustrate the population-level impact of these ORCs, we applied the incremental costs to a hypothetical cohort of 100,000 individuals and calculated the population-level annual incremental costs for each ORC by multiplying each ORC’s incremental costs by the prevalence of each ORC among 100,000 individuals. To demonstrate the economic impact of obesity through increased risk of comorbidities, we also calculated the incremental costs of ORCs among 100,000 individuals with obesity and 100,000 individuals without obesity, by multiplying the corresponding prevalence of ORCs by the incremental costs. In all the analyses, individuals in the Part II sample were assigned a sampling weight to represent their proportion in the base population. Analyses were performed using SAS software version 9.2 (SAS Institute, Cary, NC).
Results
The final study sample contained 56 895 individuals, representing 89 261 individuals in the base population (). Almost all (97.6%) of the sample were of white race and half (47.9%) were males (). The individuals were on average 47 years old when they entered the study period. During an average of 5 years in the study period, the individuals had mean BMI of 29.6 kg/m2 and mean annualized total healthcare costs of $4692 (median = $2126). Among the sample, 59.7% were in the non-obesity group (mean BMI = 25.6 kg/m2) and 40.3% were in the obesity group (mean BMI = 35.5 kg/m2). The differences in demographics between non-obesity and obesity sub-groups were all statistically significant (p < 0.05). Individuals in the non-obesity group were younger (mean age = 46.3 vs 47.6 years), were less likely to be males (47% vs 49.3%), and had lower annual costs (mean costs = $4166 vs $5471) than those in the obesity group.
Table 2. Individual characteristics.
The prevalence rate for each of the 21 ORCs is listed in . Dyslipidemia and hypertensive diseases were the most common ORCs with annual prevalence of 41.8% and 34.7%, respectively. Osteoarthritis (17.5%), gastroesophageal reflux disease (GERD = 14.2%), and chronic lower back pain (13.9%) were also common. The prevalence in the obesity group was higher than in the non-obesity group for 20 out of the 21 ORCs (p < 0.05). Especially for sleep apnea, diabetes, and pulmonary embolism, the prevalence rate in the obesity group was two to four times the rates in the non-obesity group. The prevalence of ischemic stroke was similar across the groups.
The ratios of costs associated with a single ORC vs with no ORCs, after adjusting for demographics, are presented in . All the cost ratios were greater than 1.0 (all p < 0.05). Assuming all the sample individuals had none of the ORCs, the annual costs were predicted to be $1578 per person. Compared with the annual costs per person with no ORCs, the incremental costs of a single ORC ranged from $120 per person with angina to $1665 per person with pulmonary embolism ().
Table 3. Estimated costs ratios and annual costs of obesity-related comorbidities.
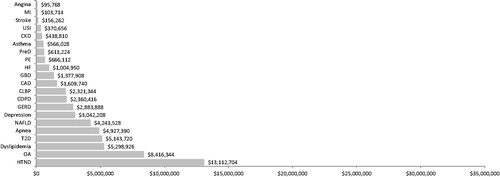
The annual incremental costs of a single ORC among 100,000 individuals are demonstrated in . Hypertensive diseases, dyslipidemia, and osteoarthritis were the three most expensive ORCs, with each one responsible for more than $18 million per year. The economic burden was also noticeably high for depression, chronic lower back pain, and GERD, which increased the annual costs in the population by ∼$10 million. These conditions were also the six most costly comorbidities in both the non-obesity population and obesity population (Supplementary Data, Figure C). The higher prevalence of comorbidities associated with obesity lead to a higher economic burden (). Hypertensive diseases increased annual costs by $13 million more in the obesity population than in the non-obesity population, and osteoarthritis increased annual costs by $8 million more. The differences in incremental costs between the two populations were ∼$5 million each for dyslipidemia, T2D, and sleep apnea.
Figure 2. Population level annual incremental costs of obesity-related comorbidities vs without any comorbidity. Incremental costs were calculated by multiplying prevalence and incremental costs for each obesity-related comorbidity in a population of 100,000 individuals. The bars are sorted by the incremental costs of the comorbidities. Apnea, Sleep apnea; CAD, Coronary artery disease; CKD, Chronic kidney disease; CLBP, Chronic lower back pain; COPD, Chronic obstructive pulmonary disease; GBD, Gallbladder diseases; GERD, Gastroesophageal reflux disease; HF, Heart failure; HTND, Hypertensive diseases; MI, Myocardial infarction; NAFLD, Non-alcoholic fatty liver disease; OA, Osteoarthritis; PE, Pulmonary embolism; PreD, Pre-diabetes; Stroke, Ischemic stroke; T2D, Diabetes; USI, Urinary stress incontinence.
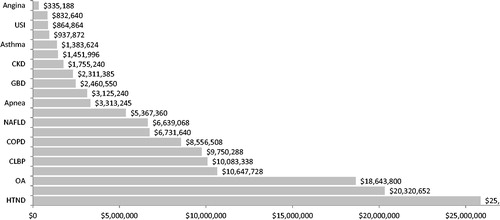
Figure 3. Differences in annual incremental costs of obesity-related comorbidities in obesity group vs non-obesity group. Incremental costs were calculated by multiplying incremental costs for each obesity-related comorbidity to the corresponding prevalence in a population of 100,000 individuals without obesity and in a population of 100,000 individuals with obesity, respectively. The differences between the obesity population vs non-obesity population were reported. Apnea, Sleep apnea; CAD, Coronary artery disease; CKD, Chronic kidney disease; CLBP, Chronic lower back pain; COPD, Chronic obstructive pulmonary disease; GBD, Gallbladder diseases; GERD, Gastroesophageal reflux disease; HF, Heart failure; HTND, Hypertensive diseases; MI, Myocardial infarction; NAFLD, Non-alcoholic fatty liver disease; OA, Osteoarthritis; PE, Pulmonary embolism; PreD, Pre-diabetes; Stroke, Ischemic stroke; T2D, Diabetes; USI, Urinary stress incontinence.
Discussion
Our study assessed the economic burden of 21 ORCs using EMR and claims data for a large regional integrated healthcare system in the US. The incremental costs associated with a prevalent ORC, adjusting for the presence of any other ORCs, ranged from $120 (for angina) to $1665 (for pulmonary embolism) per person per year. In a hypothetical population of 100 000 individuals, the occurrence of a single ORC incurred $335 thousand to $25 million more in healthcare costs per year, compared to a scenario where none of the ORCs occurred. Hypertensive diseases, dyslipidemia, osteoarthritis, depression, chronic lower back pain, and GERD were the top cost drivers at the population level. The increased prevalence of ORCs associated with obesity could lead to a much higher economic burden.
This study estimated the incremental cost of a single ORC, adjusting for the occurrence of any other ORCs. Thus, the incremental costs of one ORC estimated in this study may be smaller than those reported in the literature, if the previous estimates did not adjust for co-occurring comorbidities. In other words, previously reported estimates of the incremental costs of one ORC may also capture the effects of other related ORCs. Our estimates were derived by simultaneously adjusting for the presence of any other ORCs. As a result, our study could provide an estimate for the total incremental costs with multiple ORCs by products of the cost ratios. As an example, a person with diabetes, dyslipidemia, and hypertension would have annual costs 2.6-times (=1.35 × 1.31 × 1.47) those of a person without the three co-morbid conditions.
The Centers for Medicare & Medicaid Services (CMS) have been using hierarchical condition categories (HCC) models to adjust for the payment to Medicare managed care plansCitation19. The CMS-HCC models use a linear regression specification to estimate incremental medical costs for a comprehensive list of medical conditions and the costs for multiple conditions are additive. We did not use a risk adjustment approach similar to CMS because the condition categories used in the CMS-HCC models are not specific to the ORCs analyzed in our study. Furthermore, we did not use a similar approach because we focused on the impact of specific ORCs and their sequelae; adjusting for all health conditions may under-estimate the costs attributable to ORCs since some conditions may be in the causal pathway between ORCs and healthcare costs.
The results on the prevalence of the co-morbidities correspond reasonably well with data on broader US populations from the US Centers for Disease Control (CDC). For example, the annual prevalence of T2D in the sample was 9.6%, compared to 12.3% of diagnosed and undiagnosed diabetes among people aged 20 years or older in the US in 2012Citation20; while the prevalence of hypertension was 34.7%, compared to 30.4% among US adults during 2003–2010Citation21. We found the prevalence of depression to be 11.2%, while the CDC reported 9.0% during 2006–2008Citation22. The prevalence of obesity in our study sample (40.3%) was also close to the previous estimate (34.9% of adults aged 20 years or older) based on the 2011–2012 National Health and Nutrition Examination SurveyCitation1.
The economic burden of ORCs at the population level was estimated in our study by considering both the prevalence and the per-person incremental costs. The costs to treat individuals with ORCs in the healthcare system came mostly from individuals with hypertensive diseases, dyslipidemia, osteoarthritis, depression, chronic lower back pain, or GERD. The high economic burden of these comorbidities at the population level is mostly due to the high prevalence, as the incremental costs per person were generally low. The economic impact of high prevalence is especially noticeable for hypertensive diseases and dyslipidemia.
Our study also demonstrated the economic impact of obesity through increased risk of comorbidities. Obesity is an established risk factor of the comorbidities analyzed in our study, which is confirmed by the higher prevalence rates in the obesity group than in the non-obesity group. Despite the differences between groups, the obesity and non-obesity groups both have the same seven most costly ORCs at the population level. It is the increased prevalence in the obesity population that leads to the noticeably higher economic burden of hypertensive diseases, osteoarthritis, dyslipidemia, T2D, and sleep apnea as compared to a population without obesity.
Our results provide important information on the long-term economic burden of these ORCs. An exploratory analysis on the costs to treat incident cases was conducted for each ORC, where the incident patients were required to have at least 1 year of continuous enrollment in health plan before (washout period) and after (follow-up period) the first diagnosis. Adjusted for demographics and compared with controls without any ORCs in the washout period, the incremental costs during the first year after incident diagnosis (Supplementary Data, Table D) were much higher than the annual costs associated with each prevalent ORC. The costs were substantial to treat the coronary events, including myocardial infarction, heart failure, ischemic stroke, angina, and coronary artery disease. Coronary diseases have drawn much attention due to the high costs to treat acute events and the high mortality rates. However, from the standpoint of the long-term economic impact on the healthcare system, coronary diseases are not the top cost drivers. Instead, chronic diseases requiring continuous treatment (such as hypertensive diseases), although not expensive for treatment of an individual patient, are much more costly at the population level due to the high prevalence. We should not under-estimate the importance of prevention and early intervention in these diseases.
Our results should be interpreted in light of this study’s limitations. We did not study individuals with cancer; such individuals were excluded to reduce outliers on costs and improve internal validity on associations with BMI. Next, actual claim reimbursement information was not available and we relied on standard cost data derived from external sources; however, the degree of bias in the absolute costs should not affect our findings on the incremental costs. Also, verified enrollment in drug coverage was not available, and thus pharmacy costs may be under-estimated due to unidentified medication use. Identification of the ORCs was mostly done using ICD-9-CM diagnosis codes, but, because some conditions may be identified using other criteria (such as dyslipidemia), the prevalence of those conditions may be under-estimated. Similarly, the prevalence of obesity may have been under-estimated since it can be identified using criteria other than BMI. Last, the use of a retrospective cohort design prevented us from understanding the causal effect of ORCs on the increase in healthcare costs.
Although we used regional data, as mentioned above, the estimated prevalence rates of key comorbidities are comparable to those in the literature using nationally representative samples. Thus, we do not feel the generalizability of our results is overly limited by the small geographic region of the sample. Using these EMR and claims data provide a distinct advantage due to Geisinger Health System’s policy of requiring that each adult’s body weight be recorded during every inpatient or outpatient visit and that each person’s height should be updated annually. As a result of this policy, valid BMI data were available for more than 80% of the adults who had an office visit. These data also capture a wide range of laboratory tests results, which can facilitate identification of the ORCs. In addition, the base population in this study has been previously examined to evaluate the association between obesity and both the risk of glycemic stage progression and the costs of each glycemic stageCitation6,Citation7. This study provided further understanding on this population.
Our study systematically assessed the incremental costs of a wide range of ORCs in the US, through which the economic burden of obesity was demonstrated. The higher economic burden in a population with obesity vs without obesity reflects only the impact of the increased risk of ORCs, since incremental costs per person in a general population were applied. Our findings imply that treating relevant comorbidities without treating obesity will not curtail the economic impact of obesity. Future research could consider obesity’s impact on the per capita costs of treating ORCs and could also stratify the economic burden of ORCs by degree of obesity.
Conclusion
Obesity-related comorbidities are associated with a substantial economic burden on US healthcare, especially those chronic diseases that require continuous treatments. The increased risk of comorbidities associated with obesity could lead to substantial spending.
Transparency
Declaration of funding
This study and manuscript were funded by Novo Nordisk Inc.
Declaration of financial/other relationships
JCH and MH are employees of Novo Nordisk Inc., the funder of this study and manuscript. QL, SWB, and MLG are employed by Evidera, which provides consulting and other research services to pharmaceutical, device, government, and non-government organizations. In their salaried positions, they work with a variety of companies and organizations, and are precluded from receiving any payment or honoraria directly from these organizations for services rendered. Evidera received funding from Novo Nordisk Inc. for this study and manuscript.
Supplementary_Data_for_Online.docx
Download MS Word (147.6 KB)Acknowledgments
No assistance in the preparation of this article is to be declared.
References
- Ogden CL, Carroll MD, Kit BK, et al. Prevalence of childhood and adult obesity in the United States, 2011-2012. JAMA 2014;311:806–14
- Guh DP, Zhang W, Bansback N, et al. The incidence of co-morbidities related to obesity and overweight: a systematic review and meta-analysis. BMC Public Health 2009;9:88
- Cawley J, Meyerhoefer C, Biener A, et al. Savings in medical expenditures associated with reductions in body mass index among US adults with obesity, by Diabetes Status. Pharmacoeconomics 2014;33:707–22
- Wang Y, Beydoun MA, Liang L, et al. Will all Americans become overweight or obese? estimating the progression and cost of the US obesity epidemic. Obesity (Silver Spring) 2008;16:2323–30
- Shamseddeen H, Getty JZ, Hamdallah IN, et al. Epidemiology and economic impact of obesity and type 2 diabetes. Surg Clin North Am 2011;91:1163–72, vii
- Blume SW, Li Q, Huang JC, et al. Variation in the risk of progression between glycemic stages across different levels of body mass index: evidence from a United States electronic health records system. Curr Med Res Opin 2015;31:115–24
- Li Q, Blume SW, Huang JC, et al. The economic burden of obesity by glycemic stage in the United States. doi:10.1007/s40273-014-0248-5. Pharmacoeconomics, 2014;33:735–48
- Dave DM, Tennant J, Colman G. Isolating the effect of major depression on obesity: role of selection bias. J Ment Health Policy Econ 2011;14:165–86
- Padula WV, Allen RR, Nair KV. Determining the cost of obesity and its common comorbidities from a commercial claims database. Clin Obes 2014;4:53–8
- Sander B, Bergemann R. Economic burden of obesity and its complications in Germany. Eur J Health Econ 2003;4:248–53
- Kunde SS, Lazenby AJ, Clements RH, et al. Spectrum of NAFLD and diagnostic implications of the proposed new normal range for serum ALT in obese women. Hepatology 2005;42:650–6
- Medical Health Test Team. Information on Liver AST and ALT Levels: MedicalHealthTests.com. NR: Everyday Health Network, 2012. http://www.medicalhealthtests.com/articles/141/liver-tests/liver-test-levels.html. Accessed June 19, 2014
- Schwenger KJ, Allard JP. Clinical approaches to non-alcoholic fatty liver disease. World J Gastroenterol 2014;20:1712–23
- Agency for Healthcare Research and Quality (AHRQ). Healthcare Cost and Utilization Project (HCUP), National Inpatient Sample. Rockville, MD: Agency for Healthcare Research and Quality (AHRQ), United States Department of Health and Human Services, 2014. http://www.hcup-us.ahrq.gov/. Accessed June 19, 2014
- United States Centers for Medicare & Medicaid Services (CMS). Medicare Fee for Service Fee Schedules. Baltimore, MD: United States Centers for Medicare & Medicaid Services, 2014. http://www.cms.gov/Medicare/Medicare-Fee-for-Service-Payment/FeeScheduleGenInfo/index.html/. Accessed June 19, 2014
- Truven Health Analytics. RED BOOK™ from Micromedex Solutions®. Ann Arbor, MI: Truven Health Analytics, 2014. http://micromedex.com/redbook. Accessed June 19, 2014
- Bureau of Labor Statistics. Consumer Price Index. Washington, DC: Bureau of Labor Statistics, United States Department of Labor, 2014. http://www.bls.gov/cpi/. Accessed June 19, 2014
- Afifi AA, Kotlerman JB, Ettner SL, et al. Methods for improving regression analysis for skewed continuous or counted responses. Annu Rev Public Health 2007;28:95–111
- Pope GC, Kautter J, Ellis RP, et al. Risk adjustment of Medicare capitation payments using the CMS-HCC model. Health Care Financ Rev 2004;25:119–41
- Centers for Disease Control and Prevention (CDC). National Diabetes Statistics Report. Atlanta, GA: Centers for Disease Control and Prevention, 2014. http://www.cdc.gov/diabetes/data/statistics/2014StatisticsReport.html. Accessed 19 June, 2014
- Centers for Disease Control and Prevention (CDC). Vital signs: awareness and treatment of uncontrolled hypertension among adults–United States, 2003-2010. MMWR Morb Mortal Wkly Rep 2012;61:703–9
- Centers for Disease Control and Prevention (CDC). Current depression among adults—United States, 2006 and 2008. MMWR Morb Mortal Wkly Rep 2010;59:1229–35