
Abstract
Objective:
To quantify the cost of acute major adverse cardiac events (MACE; myocardial infarction [MI] and stroke) stratified by cardiovascular disease (CVD) risk factors in commercially, Medicare Supplemental-, and Medicaid-insured patients with type 2 diabetes mellitus (T2DM).
Methods:
US administrative claims data were used to identify patients with T2DM aged ≥18 and continuously enrolled with insurance benefits from July 1, 2009–June 30, 2010 (baseline). Patients were classified into three baseline CVD risk groups (highest, medium, and lowest) and followed from July 1, 2010 until 1 year or censoring (follow-up) to measure per-patient per-month (PPPM) all-cause healthcare costs. Multivariable regression compared costs between patients with/without MACE during follow-up. Patients with MACE were further followed for up to 1 year after initial event to quantify longitudinal event costs.
Results:
Sample comprised 1,415,598 T2DM patients. Over average follow-up ranging from 301–343 days across CVD risk groups, 10,399 patients experienced MACE. Expected multivariable-adjusted mean PPPM costs of MACE per 100 covered patients within each CVD risk group varied by payer and generally increased with CVD risk (range = $1555 in lowest-risk commercially insured patients to $18,727 in highest-risk Medicaid-insured patients). Longitudinal costs of MACE were lowest among Medicare Supplemental-insured patients with stroke ($22,657 initial event, $2488 PPPM up-to 1-year follow-up care) and highest among Medicaid-insured patients with MI ($41,505 initial event, $4799 PPPM up to 1-year follow-up care).
Conclusions:
These results illustrate the potential clinical and economic importance of considering patients’ CVD risk and medications’ cardiovascular safety profile when treating T2DM patients.
Introduction
Patients with type 2 diabetes mellitus (T2DM) are at high risk for cardiovascular disease (CVD) because of macrovascular disease and metabolic complications such as hypertension and hyperlipidemia that are highly comorbid in T2DMCitation1. In 2008, the US Food and Drug Administration (FDA) introduced new guidelines for the development of drugs and therapeutic biologics for the treatment of T2DMCitation2. This guidance made recommendations on how to demonstrate that new anti-diabetic therapies are not associated with unacceptable increases in cardiovascular risk. Among the recommendations, the FDA stipulated that phase 2 and phase 3 trials should prospectively adjudicate major adverse cardiovascular events (MACE), including myocardial infarction (MI), stroke, and cardiovascular mortalityCitation2.
While healthcare payers will likely take interest in the direct clinical evidence that will be generated from future trials examining the cardiovascular safety of T2DM medications, complementary economic data will be critical to understanding the potential financial implications of safety findings. Several previous studies have examined issues related to the cost of macrovascular disease and specific cardiovascular events in patients with T2DMCitation3–9. The most recently published of these studies, conducted by Ward et al.Citation9, provides some of the most direct dollar estimates for two of the key FDA-suggested cardiovascular safety outcomes, MI and stroke. The authors estimated that, from the perspective of a comprehensive US healthcare payer, acute event and follow-up care costs would equal $56,445 per patient with T2DM over a 1-year period after MI and $42,119 per patient with T2DM over a 1-year period after ischemic stroke. A substantial limitation of their analysis, however, is that their estimates were based on micro-costing methods, which draw on numerous disparate sources and populations to develop cost estimates and are, therefore, subject to many sources of uncertainty. Among the other previously published studies, other limitations on the usefulness of the data to US payers exist, including ex-US settings, outdated cost estimates, and focus on only commercially insured populations. Furthermore, whereas broad generalizability of individual cost estimates to large payer populations is desirable, important heterogeneities may exist in healthcare costs of MACE when considering factors such as patient age, baseline CVD risk, and payer type. If such heterogeneities exist, cost estimates that take these factors into account could be used by payers to more accurately understand the importance of cardiovascular safety of T2DM medications within their own specific populations and sub-populations.
Motivated by the aforementioned issues, this study sought to quantify the cost of two FDA-suggested acute MACE end points (MI and stroke) by the presence of CVD risk factors in commercially, Medicare Supplemental-, and Medicaid-insured patients with T2DM.
Methods
Data source
This study’s data sources were administrative claims data contained in the Truven Health MarketScan Commercial Claims and Encounters (commercial), Medicare Supplemental and Coordination of Benefits (Medicare Supplemental), and Multi-State Medicaid databases (Truven Health, Ann Arbor, MI). These databases comprise enrollment information, inpatient and outpatient medical, and outpatient pharmacy claims data for individuals with employer-sponsored primary (∼37 million individuals annually), Medicare Supplemental (∼4 million individuals annually), or Medicaid (∼6 million individuals annually) health insurance. The administrative claims within the Medicare Supplemental database contain both the Medicare-covered portion of payment (represented co-ordination of benefits) and the employer-paid portion of payment. The Multi-State Medicaid database comprises claims from 15 states that are heterogeneous with respect to size, geography, and industrial composition. Further identifying information about the included Medicaid states is restricted by confidentiality agreements between Truven Health Analytics and the data-contributing state Medicaid agencies. These databases have been used in multiple published evaluations related to healthcare costs and diabetesCitation10.
The study databases satisfy the conditions set forth in Sections 164.514 (a)–(b)1ii of the Health Insurance Portability and Accountability Act of 1996 privacy rule regarding the determination and documentation of statistically de-identified data. Institutional Review Board (IRB) approval to conduct this study was not sought because the MarketScan Research Databases fall under the 45 CFR 46.101(b)(4) exemption from IRB review in US Department of Health and Human Services (HHS) regulations (Title 45 of the Code of Federal Regulations, Part 46).
Patient selection criteria
To maximize the study sample’s overall generalizability to all patients with T2DM, patients were selected in a manner that deliberately resulted in a prevalence-based sample of patients with T2DM that would be reflective of a continuum of potential disease severity. To that end, patients eligible for the analysis were required to have continuous enrollment in medical and pharmacy benefits from July 1, 2009 to June 30, 2010 (baseline period), be aged ≥18 years as of July 1, 2009, and have either at least one inpatient or non-diagnostic (e.g., excluding claims for laboratory or radiology services) outpatient medical claim with a diagnosis code for T2DM (International Classification of Diseases, 9th Revision, Clinical Modification [ICD-9-CM] codes 250.x0 or 250.x2) in any position or at least two outpatient prescription claims for oral anti-diabetic drugs during the baseline period. Because MI and stroke can be fatal at presentation and impose an elevated risk of mortality thereafter, patients were not required to have a minimum duration of follow-up after July 1, 2009 in order to mitigate survival biasCitation11,Citation12. Sensitivity analyses were also conducted among patients with a full year of follow-up. Patients were excluded from the analysis if they had at least one medical claim with a diagnosis code for type 1 diabetes (ICD-9-CM 250.x1 or 250.x3) or gestational diabetes (ICD-9-CM 648.8x) in any position from July 1, 2009 to June 30, 2011. Furthermore, patients enrolled in the Multi-State Medicaid database with ‘dual eligibility’ for Medicare at any point between July 1, 2009 and June 30,2011 were excluded from the study because of the inability to observe their prescription claims data, which are covered under Medicare Part D and not collected in the database. Finally, commercially and Medicaid-insured patients were excluded from the study samples if they were aged 64–65 years during the follow-up period.
Method of follow-up and outcome measurement
Starting on July 1, 2010, patients were followed until 1 year (i.e., June 30, 2011) or censored at inpatient death or disenrollment from their health insurance benefit (follow-up period) to measure the occurrence of MACE and per-patient per-month (PPPM) all-cause healthcare costs. A calendar-date-based 1-year follow-up period was chosen for the evaluation of outcomes because, on an annual basis, a payer is responsible for reimbursement of the healthcare services provided during that year, regardless of when during the year the services occur. For example, members who experience MACE toward the end of the year and subsequently switch health plans will no longer result in costs from the original payer’s perspective.
However, the longitudinal costs of MACE that begin at the onset of an event may be important to payers with which individuals tend to stay enrolled for longer periods (e.g., self-insured employers, Medicare Supplemental plans, and sicker patients who may be more likely to stay enrolled with their plans). Accordingly, this study also quantified the longitudinal cost of MACE in terms of the initial event and up to 1 year of related follow-up care. Initial event costs were those corresponding to the first observed hospitalization for MACE during follow-up. Follow-up care costs were those corresponding to medical claims with diagnosis codes (recorded in the primary position for inpatient, any diagnosis position for outpatient) for the initial event type during a 1-year period after the initial event. The healthcare costs associated with outpatient pharmaceutical claims for medications used in the treatment of cardiovascular conditions were also measured. In these analyses, the costs of MI and stroke were measured separately. Patients experiencing both an MI and a stroke during the follow-up period could contribute to both the sample quantifying the longitudinal cost of MI and the sample quantifying the longitudinal cost of stroke.
MACE were identified using previously validated administrative claims-based criteria, specifically: stroke was identified on the basis of at least one inpatient medical claim with an ICD-9-CM diagnosis code of 430.xx, 431.xx, 433.x1, 434.x1, or 436.xx in the primary position; MI was identified on the basis of at least one inpatient medical claim with an ICD-9-CM diagnosis code of 410.xx in the primary positionCitation13,Citation14. Thus, MACE measured within the present study represented acute events requiring admission to the inpatient setting.
All healthcare costs were expressed in 2011 constant dollars, adjusted using the Medical Care component of the Consumer Price IndexCitation15. Healthcare costs were measured using the financial fields on administrative claims in the MarketScan databases and represent the gross covered payments to providers, including both payer reimbursements and patient out of pocket expenses. Costs for services provided under capitated payment arrangements were imputed using a Truven Health Analytics algorithm that computes a payment ‘proxy’ for healthcare services used, based on the average payments for non-capitated claims at the region, year, and procedure level within the MarketScan databasesCitation16.
CVD risk groups and other covariates
Patients were classified into CVD risk groups that were defined using data from the baseline period: highest risk, defined as being aged 40 years or older and having at least one baseline claim for atherosclerosis, stroke, MI, unstable angina, coronary re-vascularization, or heart failure; medium risk, defined as being aged 55 years or older (men) or 60 years or older (women) and having at least one baseline claim for dyslipidemia, hypertension, or tobacco use disorder; and lowest risk, the remaining patients.
Other covariates, which were used to describe the study sample and adjust the multivariable models, included patient demographics measured as of July 1, 2010 and patient clinical characteristics measured throughout the baseline period. These patient characteristics are listed in .
Table 1. All study-eligible patients with T2DM: patient characteristics stratified by CVD risk group and payer type.
Statistical analyses
Bivariate analyses were used to display summaries of variable distributions, generally stratified by CVD risk group and payer type. Univariate analyses displayed information on the longitudinal costs of MACE; these analyses were not stratified by CVD risk group due to relatively small sample sizes.
Within each CVD risk group and payer type, generalized linear models with a log link and gamma error distribution compared all-cause PPPM healthcare costs between patients with vs without MACE (composite of MI and/or stroke) at any time during the 1-year follow-up period, adjusting for the patient characteristics that are listed in . The recycled prediction method was used to generate predicted adjusted mean healthcare costs for patients with MACE and patients without MACE from the multivariable model resultsCitation17. The difference between the predicted adjusted means was taken as the incremental PPPM cost difference between patients with vs without MACE within the given CVD risk group. The variance inflation factor was used to assess multi-collinearity of the models’ independent variables, indicating no influential multi-collinearity. Sensitivity analyses of the model specification were also performed and are described in the discussion section.
Expected mean PPPM costs of MACE per 100 covered patients with T2DM within each CVD risk group were calculated from the multivariable-adjusted results as: proportion of patients with MACE within CVD risk group * incremental PPPM cost difference between patients with vs without MACE within CVD risk group * 100.
Data extraction and statistical analyses were performed using SAS™ Version 9.2 (SAS Institute, Cary, NC). p values <0.05 were considered, a priori, to be statistically significant.
Results
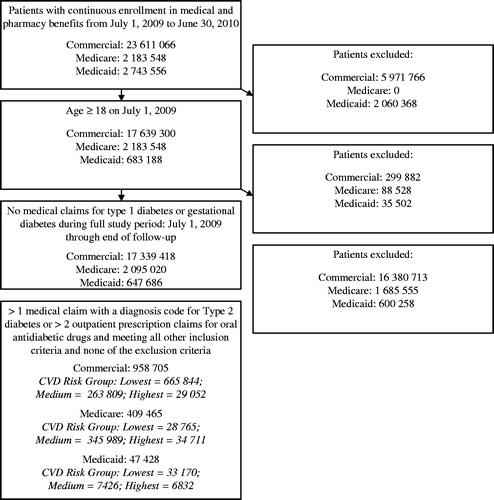
displays a flow chart showing how patients were selected into the analysis. The final study sample for the primary objective comprised 1,415,598 patients with T2DM. Among these patients, 10,399 patients experienced MACE (MI and/or stroke); of these patients, 5591 and 4600 qualified for the analyses of the longitudinal cost MI and/or stroke, respectively; while the remainder were excluded due to aging into Medicare coverage after the acute event.
Figure 1. Patient selection.
Incremental cost differences between patients with vs without MACE
displays patient characteristics of all study-eligible patients, stratified by CVD risk group and payer type. Within each payer type, the values of the measured health indices (higher values being indicative of poorer health) increased with increasing CVD risk. Commercially insured patients had the numerically lowest values of health indices, whereas Medicaid-insured patients generally had the highest values of health indices.
displays the multivariable-adjusted mean PPPM all-cause healthcare costs for all study-eligible patients with or without MACE at any point during the 1-year follow-up period, stratified by CVD risk group and payer type. The proportion of patients with MACE generally grew with increasing CVD risk and, for any CVD risk group, was always greatest among Medicare Supplemental-insured patients. In all nine comparisons, multivariable-adjusted PPPM costs were significantly (all p < 0.001) greater among patients with MACE than among patients without MACE. The magnitudes of these cost differences were largest among Medicaid-insured patients in all CVD risk groups.
Table 2. All study-eligible patients with T2DM: multivariable-adjusted mean PPPM all-cause healthcare costs for patients with T2DM with or without MACE during 1-year follow-up period.
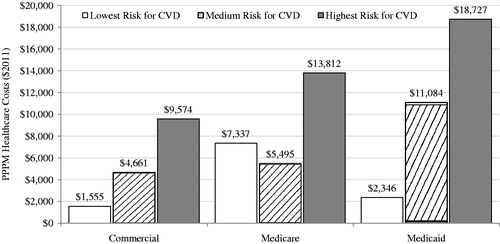
displays the expected mean PPPM costs of MACE per 100 covered patients with T2DM within each given CVD risk group. These calculations take into account both the proportion of patients with MACE and the magnitude of cost differences between patients with vs without MACE, which together drive the overall cost burden of MACE. Expected PPPM costs of MACE increased with CVD risk, except in the Medicare Supplemental-insured patients, for whom the medium CVD risk category had the lowest expected PPPM cost of MACE. Over all of the groups, these costs ranged from $1555 in lowest-risk commercially insured patients to $18,727 in highest-risk Medicaid-insured patients.
Figure 2. Expected mean PPPM costs of MACE per 100 covered patients with T2DM within CVD risk group by payer type. CVD, cardiovascular disease; MACE, major adverse cardiovascular events (stroke and myocardial infarction); PPPM, per-patient per-month. Expected PPPM costs were calculated from the multivariable-adjusted results as: proportion of patients with MACE within CVD risk group * incremental PPPM cost differences between patients with vs without MACE within CVD risk group * 100. ‘Highest risk’ defined as being aged >40 and having ≥1 baseline claim for atherosclerosis, stroke, MI, unstable angina, coronary re-vascularization, or heart failure; ‘medium risk’ defined as being aged ≥55 (men) or ≥60 (women) and having ≥1 baseline claim for dyslipidemia, hypertension, or tobacco use disorder; ‘lowest risk’ comprised the remaining patients. Medicare is patients with Medicare Supplemental insurance.
Sensitivity analyses conducted among patients with a full year of follow-up are displayed in Appendix A. These results generally produced lower, by an average of $1600, differences in multivariable-adjusted PPPM costs between those with vs without MACE. This directional impact on the results is expected given the potential survival bias towards healthier individuals being retained in the sample introduced by requiring a full year of follow-up.
Longitudinal costs of MACE
displays detailed information on the longitudinal costs (i.e., costs for initial event plus follow-up care over up to 1 year following the initial event) of MACE among patients who experienced MACE during the 1-year follow-up period. For the initial event, MACE costs were numerically highest among Medicaid patients both in terms of the mean and the median. The same trend was present for PPPM follow-up care over up to 1 year following the initial event. Follow-up care costs were driven primarily by medical healthcare service use, of which the largest cost driver was inpatient service use.
Table 3. Patients with T2DM experiencing MACE: patient characteristics and longitudinal costs of MACE (initial event & PPPM costs for up to 1 year of MACE-specific follow-up care).
Discussion
This study quantified the cost of two FDA-suggested MACE end-points (MI and stroke) by the presence of CVD risk factors in commercially, Medicare Supplemental-, and Medicaid-insured patients with T2DM. As expected, MACE were associated with substantial healthcare costs, and these costs varied widely by both CVD risk and payer.
Two previous studies specifically examined the costs of MI and stroke among patients with T2DM using designs similar to that used in the present study. Straka et al.Citation4 studied patients from a large managed care organization who were hospitalized for cardiovascular reasons, including MI (n = 1420) and ischemic stroke (n = 552), among other reasons, between January 1, 2000 and June 30, 2006. They reported that the mean costs (in 2006 USD) of the initial hospitalizations were $26,035 (range in 2011 USD in the present study = $29,541–$41,505) for MI and $11,802 (range in 2011 USD in the present study = $22,657–$40,370) for ischemic strokeCitation4. Estimated costs for cardiovascular-related follow-up care over 1 year were $12,256 for MI and $7521 for ischemic stroke. The higher costs found within the present study may be driven by medical cost inflation and changes in patterns of care that have taken place over time. Ward et al.Citation9 estimated that, from the perspective of a comprehensive US healthcare payer, acute event and follow-up care costs would equal $56,445 per patient with T2DM over a 1-year period after MI and $42,119 per patient with T2DM over a 1-year period after ischemic stroke. These estimates are similar to the estimates reported in the present study for the longitudinal cost of MACE. The unique contribution of the present study is the stratification of MACE cost estimates by payer type and CVD risk, resulting in data that payers may use to better understand the cost implications of targeted efforts to manage high-risk sub-populations of patients within their covered populations. For example, Medicaid payers considering expected returns to MACE prevention strategies may sharply under-estimate such returns when using MACE cost estimates generated from data in commercially-insured populations, which were shown to be far less costly in the present study.
This study’s estimated cost differences between patients with vs without cardiovascular events could have varied according to the degree to which cardiovascular-related factors were adjusted for within the multivariable models. As a sensitivity analysis, we fit models in which circulatory disease-related diagnoses/cardiovascular medications were not excluded from any of the following measures: the Deyo-Charlson Comorbidity Index, the number of unique ICD-9-CM diagnosis codes at the third digit of specificity, and the number of unique outpatient medications. Additionally, we also fit models using a strategy in which baseline healthcare costs were included as covariates in the models. Results to the sensitivity analyses are displayed in Appendix B. The model specifications made little difference to the study’s estimated cost differences between patients with vs without cardiovascular events.
Limitations
This study has important limitations. Although findings from this study covered three large payer types, each database was a non-probability sample, and, thus, findings may not be generalizable to the entire US population. Administrative claims data are subject to coding error, which can result in measurement error for variables based on codes. Some Medicare patients in the lowest CVD risk group may have had little contact with the healthcare system, resulting in misclassification of true CVD risk, a potential explanation for the unexpected finding that the medium CVD risk category had the lowest expected PPPM cost of MACE. This analysis does not account for the ongoing cost of MACE that occurred during the baseline period or earlier. Finally, this analysis captured only the direct healthcare costs of MACE and did not measure other potential indirect costs such as lost productivity.
Conclusion
In this study of more than 1 million patients with T2DM, MACE were associated with substantial PPPM healthcare costs that generally grew with CVD risk and differed by payer type. These results illustrate the potential clinical and economic importance of considering patients’ CVD risk and medications’ cardiovascular safety profile when selecting medications for patients with T2DM. Payers may be able to use this information to better understand the potential financial implications of clinical evidence that is generated from future trials that evaluate the cardiovascular safety of T2DM medications.
Transparency
Declaration of funding
This study was sponsored by AstraZeneca, Fort Washington, PA, and Bristol-Myers Squibb, Plainsboro, NJ. All named authors meet the ICMJE criteria for authorship for this manuscript, take responsibility for the integrity of the work as a whole, and have given final approval to the version to be published.
Declaration of other relationships
SJ, KC, NP, and DS are employees of Truven Health Analytics, which was paid by the study sponsors to conduct this study. JS and IK are employees of AstraZeneca. MS is an employee of Bristol-Myers Squibb.
Acknowledgment
The authors wish to acknowledge Doug Weldon for his SAS programming support.
References
- Fowler MJ. Microvascular and macrovascular complications of diabetes. Clin Diabetes 2008;26:77-82
- U.S. Department of Health and Human Services, Food and Drug Administration, Center for Drug Evaluation and Research (CDER). Guidance for Industry: Diabetes Mellitus — evaluating cardiovascular risk in new antidiabetic therapies to treat type 2 diabetes. Silver Spring, MD: Office of Communications, Division of Drug Information, Center for Drug Evaluation and Research, Food and Drug Administration, 2008. http://www.fda.gov/downloads/Drugs/GuidanceComplianceRegulatoryInformation/Guidances/ucm071627.pdf. Accessed May 1, 2014
- Pelletier EM, Smith PJ, Boye KS, et al. Direct medical costs for type 2 diabetes mellitus complications in the US commercial payer setting: a resource for economic research. Appl Health Econ Health Policy 2008;6:103-12
- Straka RJ, Liu LZ, Girase PS, et al. Incremental cardiovascular costs and resource use associated with diabetes: an assessment of 29,863 patients in the US managed-care setting. Cardiovasc Diabetol 2009;8:53
- Gandra SR, Lawrence LW, Parasuraman BM, et al. Total and component health care costs in a non-Medicare HMO population of patients with and without type 2 diabetes and with and without macrovascular disease. J Manag Care Pharm 2006;12:546-54
- Ringborg A, Yin DD, Martinell M, et al. The impact of acute myocardial infarction and stroke on health care costs in patients with type 2 diabetes in Sweden. Eur J Cardiovasc Prev Rehabil 2009;16:576-82
- Carral F, Aguilar M, Olveira G, et al. Increased hospital expenditures in diabetic patients hospitalized for cardiovascular diseases. J Diabetes Complications 2003;17:331-6
- O'Brien JA, Patrick AR, Caro J. Estimates of direct medical costs for microvascular and macrovascular complications resulting from type 2 diabetes mellitus in the United States in 2000. Clin Ther 2003;25:1017-38
- Ward A, Alvarez P, Vo L, et al. Direct medical costs of complications of diabetes in the United States: estimates for event-year and annual state costs (USD 2012). J Med Econ 2014;17:176-83
- Truven Health Analytics. MarketScan Bibliography. Ann Arbor, MI: MarketScan, 2015. http://marketscan.truvenhealth.com/marketscanuniversity/publications/2012%20Truven%20Health%20MarketScan%20Bibliography.pdf. Accessed June 20, 2013
- Kapur A, De Palma R. Mortality after myocardial infarction in patients with diabetes mellitus. Heart 2007;93:1504-6
- Collins TC, Petersen NJ, Menke TJ, et al. Short-term, intermediate-term, and long-term mortality in patients hospitalized for stroke. J Clin Epidemiol 2003;56:81-7
- Roumie CL, Mitchel E, Gideon PS, et al. Validation of ICD-9 codes with a high positive predictive value for incident strokes resulting in hospitalization using Medicaid health data. Pharmacoepidemiol Drug Saf 2008;17:20-6
- Metcalfe A, Neudam A, Forde S, et al. Case definitions for acute myocardial infarction in administrative databases and their impact on in-hospital mortality rates. Health Serv Res 2013;48:290-318
- United States Bureau of Labor Statistics. Consumer Price Index Detailed Report Tables Annual Average 2011. Washington, DC: United States Bureau of Labor Statistics, Division of Consumer Prices and Price Indexes, 2011. http://www.bls.gov/cpi/cpid11av.pdf. Accessed May 1, 2014
- Kim MH, Johnston SS, Chu BC, et al. Estimation of total incremental health care costs in patients with atrial fibrillation in the United States. Circ Cardiovasc Qual Outcomes 2011;4:313-20
- Kleinman LC, Norton EC. What’s the risk? A simple approach for estimating adjusted risk measures from nonlinear models including logistic regression. Health Serv Res 2009;44:288-302
Appendix A