
Abstract
Objectives:
The present study aimed to compare the projected long-term clinical and cost implications associated with liraglutide, sitagliptin and glimepiride in patients with type 2 diabetes mellitus failing to achieve glycemic control on metformin monotherapy in France.
Methods:
Clinical input data for the modeling analysis were taken from two randomized, controlled trials (LIRA-DPP4 and LEAD-2). Long-term (patient lifetime) projections of clinical outcomes and direct costs (2013 Euros; €) were made using a validated computer simulation model of type 2 diabetes. Costs were taken from published France-specific sources. Future costs and clinical benefits were discounted at 3% annually. Sensitivity analyses were performed.
Results:
Liraglutide was associated with an increase in quality-adjusted life expectancy of 0.25 quality-adjusted life years (QALYs) and an increase in mean direct healthcare costs of €2558 per patient compared with sitagliptin. In the comparison with glimepiride, liraglutide was associated with an increase in quality-adjusted life expectancy of 0.23 QALYs and an increase in direct costs of €4695. Based on these estimates, liraglutide was associated with an incremental cost-effectiveness ratio (ICER) of €10,275 per QALY gained vs sitagliptin and €20,709 per QALY gained vs glimepiride in France.
Conclusion:
Calculated ICERs for both comparisons fell below the commonly quoted willingness-to-pay threshold of €30,000 per QALY gained. Therefore, liraglutide is likely to be cost-effective vs sitagliptin and glimepiride from a healthcare payer perspective in France.
Introduction
Diabetes mellitus (both type 1 and type 2) represents a significant challenge for healthcare providers in France with the prevalence in 2013 estimated at 7.5% and predicted to increase to 8.2% by 2035Citation1. The disease is associated with a large clinical burden, with 22,953 deaths attributable to diabetes in 2013 in FranceCitation1. As well as the clinical burden, diabetes is associated with an economic burden estimated to be between United States dollars ($) 17–32 billion in 2010, with this predicted to rise to between $21–40 billion in 2030Citation2. The main driver of this expenditure, that accounts for 10% of national healthcare expenditures in France, is treatment of diabetes-related complicationsCitation2. Long-term clinical trials have shown there is potential to reduce this burden by optimizing therapyCitation3.
Traditionally, maintaining glycemic control has formed the cornerstone of diabetes treatment, but evidence suggests that controlling other risk factors is also important in reducing the long-term risk of complications. This includes blood pressure, body weight and serum lipid levels. The benefits of multifactorial intervention have been demonstrated in a number of studies (both clinical trials and cost-effectiveness analyses), including the Steno-2 study, which compared conventional treatment for multiple risk factors vs intensive multifactorial treatmentCitation4–8. Intensive treatment was associated with reduced risk of all-cause mortality, cardiovascular events, end-stage renal disease, retinopathy, and neuropathy, over 13 years of follow-up. Most long-established diabetes interventions have been shown to improve glycemic control, but do little to address other risk factors (such as weight gain, hypoglycemia, and systolic blood pressure), and meet the multi-faceted needs of modern patients with type 2 diabetesCitation9.
Clinical development programs have targeted the modulation of incretin activity to identify new therapeutic options that better meet the need for a multi-factorial intervention in diabetesCitation10. This has led to the development of two new classes of anti-diabetic agents: degradation-resistant glucagon-like peptide-1 (GLP-1) receptor agonists (that mimic the action of GLP-1), such as liraglutide, and inhibitors of dipeptidyl peptidase-4 (DPP-4, the protease that rapidly degrades GLP-1), such as sitagliptin.
Whilst the interventions that target the incretin axis may provide a more complete approach to treatment of type 2 diabetes than traditional second-line interventions, such as sulfonylurea, they also come at an increased acquisition cost in the short-term, although this can be partially offset by the avoidance of treatment of diabetes-related complications as a result of better control. In a healthcare system with limited funds, the aim is to maximize health outcomes across the population with the finite resources available. Healthcare payers must make decisions on how best to allocate scarce resources to maximize health outcomes across the population. Economic evaluations of alternative treatment strategies (e.g., new and existing medications) are playing an increasingly important role in informing these decisionsCitation11,Citation12. The majority of economic evaluations are based on modeling techniques which allow projections of long-term costs and clinical outcomes, allowing healthcare payers to make decisions before long-term clinical trials evaluating these drugs are available. This is particularly relevant to the French setting, where the Haute Autorité de Santé (HAS) has recently released revised guidelines on the conduct of health economic evaluation (including type of analysis, perspective, population, interventions, time horizon, discounting, calculation of cost-effectiveness, and modeling methods)Citation13. This, along with the changing legislation around approval of pharmaceuticals in France, has led to an increased interest in health technology assessment in the French setting over recent years.
Cost-effectiveness analyses of liraglutide have been published for the other settings, but, to date, no such analysis has been conducted for FranceCitation14,Citation15. The aim of the present analysis was to assess the cost-effectiveness of liraglutide 1.2 mg vs sitagliptin, and vs glimepiride, as an add-on to metformin in patients with type 2 diabetes mellitus failing to achieve glycemic control on metformin monotherapy in France.
Methods
Clinical data sources
Two cost-effectiveness analyses were performed based on the LIRA-DPP4 trial (liraglutide vs sitagliptin) and the LEAD-2 study (liraglutide vs glimepiride)Citation16–18. The LIRA-DPP4 trial study enrolled patients with type 2 diabetes mellitus who had inadequate glycemic control (HbA1c 7.5–10.0%) on metformin in Europe and North America. Patients were randomly allocated to receive 1.2 mg liraglutide (n = 225), 1.8 mg liraglutide (n = 221), or 100 mg sitagliptin (n = 219) with metformin treatment continued. The LEAD-2 study enrolled patients with HbA1c between 7–11% (if previously treated with oral hypoglycemic agent monotherapy for at least 3 months) or HbA1c 7–10% (if previously treated with oral hypoglycemic agent combination therapy for at least 3 months). Patients were randomly allocated to receive 0.6 mg liraglutide (n = 242), 1.2 mg liraglutide (n = 240), 1.8 mg liraglutide (n = 242), 4 mg glimepiride (n = 242), or placebo (n = 121), all plus metformin. However, only the sub-group of patients in which liraglutide or glimepiride was added to ongoing metformin monotherapy (∼30% of the total trial population) was included in the present analyses, as this was considered to be more reflective of clinical practice and brings the analysis into line with the sitagliptin comparison.
Model description
The cost-effectiveness analysis was performed using the IMS CORE Diabetes Model (IMS Health, Basel, Switzerland), the architecture, assumptions, features, and capabilities of which have been previously publishedCitation19. The model is a validated, non-product specific diabetes policy analysis tool and is based on a series of inter-dependent sub-models that simulate the complications of diabetes (angina, myocardial infarction, congestive heart failure, stroke, peripheral vascular disease, diabetic retinopathy, macular edema, cataract, hypoglycemia, ketoacidosis, lactic acidosis, nephropathy and end-stage renal disease, neuropathy, foot ulcer and amputation, and non-specific mortality)Citation20,Citation21. Each sub-model has a semi-Markov structure and uses time, state, time-in-state and diabetes type-dependent probabilities derived from published sources. Monte Carlo simulation using tracker variables overcomes the memory-less properties of the standard Markov model, and allows interconnectivity and interaction between individual complication sub-models. Long-term outcomes projected by the model have been validated against real life data in 2004 and more recently in 2014Citation20,Citation21.
The model was used to project life expectancy, quality-adjusted life expectancy, cumulative incidence of diabetes-related complications, time to onset of diabetes-related complications and direct medical costs based on the outcomes of the LIRA-DPP4 and LEAD-2 studies. Future costs and clinical benefits were discounted symmetrically by 3% per annum in line with published health economic guidance for FranceCitation13. The time horizon was set to patient lifetimes in the base case to capture all relevant long-term complications, associated costs, and to assess their impact on life expectancy and quality-adjusted life expectancy.
Simulated cohort and treatment effects
The baseline cohort characteristics were taken from the LIRA-DPP4 trial and the LEAD-2 trial sub-group (). In the analysis of liraglutide vs sitagliptin, treatment effects applied in the first year of the modeling analysis were taken from the 52-week end-point of the trial (), as using the longest-duration data available from the trial was considered the most appropriate approach to inform long-term modeling. In the comparison of liraglutide and glimepiride, treatment effect data were based on the 26-week trial data (). Assumptions regarding progression of risk factors in the following years of the simulation were aligned with the cost-effectiveness analysis of liraglutide in the Spanish settingCitation15. HbA1c was assumed to remain unchanged for the duration of the analysis. As such, the treatment-specific HbA1c reduction was applied at year 1 of the analysis and maintained for the rest of the simulation. A relatively constant HbA1c level may be a plausible assumption under adequate monitoring and timely treatment intensification, as demonstrated in the Action in Diabetes and Vascular disease (ADVANCE) trialCitation22. With this assumption, it was also possible to capture the legacy effect, whereby early benefits in glycemic control are maintained, even after the HbA1c reduction no longer persists, as this is not otherwise explicitly captured in the modelCitation23. Systolic blood pressure increased based on the UKPDS progression equation, whilst serum lipids followed the Framingham progression equationsCitation19. Patients were assumed to receive liraglutide, sitagliptin, or glimepiride for 5 years, before intensifying treatment to basal insulin (previous therapy withdrawn). Alternative assumptions around timing of treatment switching were evaluated in sensitivity analyses. On treatment intensification, BMI differences between the treatment arms were abolished and hypoglycemic event rates were assumed to be the same in both arms, but no other treatment effects were applied. Treatment costs were considered to be equivalent in all arms when patients were receiving basal insulin (based on the defined daily dose of insulin glargine), as this is likely to be a conservative assumption.
Table 1. Baseline characteristics of the simulated cohorts.
Table 2. Treatment effects applied in the first year of the analysis.
Estimation of direct costs and health state utilities
In the base case analyses, costs were accounted from a healthcare payer perspective in France. The costs of diabetes medications, self-monitoring of blood glucose, concomitant medications (statins, aspirin, and angiotensin-converting enzyme inhibitors), and diabetes-related complications were captured (supplementary information). Costs were identified through a literature search of the Medline database, with searches carried out in October 2013. Articles published in both French and English were included. Where necessary, costs were inflated to 2013 values, using the consumer prices indexCitation24. Health state utilities used in the analysis were as per previously published cost-effectiveness analyses of liraglutideCitation14,Citation15.
Sensitivity analysis
A series of sensitivity analyses were conducted to identify key drivers of outcomes and assess the robustness of results of the two analyses. The influence of time horizon on the outcomes projected by the model was investigating by running analyses over 5, 10, and 20 years. Similarly, the effect of alternative discount rates on calculated outcomes was investigated in analyses in which they were set to 0% and 5% per annum. Analyses with indirect costs included were conducted, to capture the impact of lost workplace productivity. Literature review only identified French-specific days off work estimates following a major hypoglycemic event, and, therefore, estimates for other complications came from other settingsCitation25,Citation26. The impact of using an alternative source for the cost of complications was assessed using values identified in an alternative literature review (all values differed from the base case analysis)Citation27. The importance of changes in physiological parameters were investigated in five sensitivity analysis for each comparison, with differences in HbA1c, systolic blood pressure, blood lipids, BMI, and hypoglycemic event rates individually abolished between the liraglutide and comparator arms. A further analysis in which only statistically significant differences between treatments were applied was performed for each comparison. For each comparison, two analyses were conducted using alternative assumptions around long-term progression of HbA1c. In the first, the HbA1c values in the two treatment arms became equal on intensification, while in the second HbA1c was assumed to progress according to the UKPDS progression curve for the duration of the analysis. The effect of the timing of treatment switching was examined by varying the treatment switch to 7 and 3 years in both arms of the analyses. Analyses in which patients switched from liraglutide 1.2 mg to liraglutide 1.8 mg after 2 years of treatment were conducted. Only costs were altered in these analyses, with clinical outcomes remaining unchanged as data to inform these changes were not available (it is likely that this is a conservative assumption). A scenario was evaluated in which the baseline cohort was based on the patients enrolled in the EVIDENCE study, an observational study of liraglutide in the French setting, representing a typical cohort of patients with type 2 diabetes receiving liraglutide in FranceCitation28. A probabilistic sensitivity analysis was performed, with sampling around all model variables based on default distributions defined by the IMS CORE Diabetes Model.
Results
Liraglutide vs sitagliptin: base case
Treatment with liraglutide was associated with increases in discounted life expectancy and quality-adjusted life expectancy of 0.19 years (95% confidence interval [CI] = 0.17–0.21) and 0.25 quality-adjusted life years (QALYs, 95% CI = 0.24–0.26) in comparison with treatment with sitagliptin (). The clinical benefits in the liraglutide arm were primarily driven by improved glycemic control with liraglutide over sitagliptin, resulting in a reduction in the incidence of all diabetes-related complications. The mean time to onset of diabetes-related complications was also increased with liraglutide, with the mean time free from all complications increased from 6.8 years with sitagliptin to 7.7 years with liraglutide.
Table 3. Cost-effectiveness outcomes of the base case analyses.
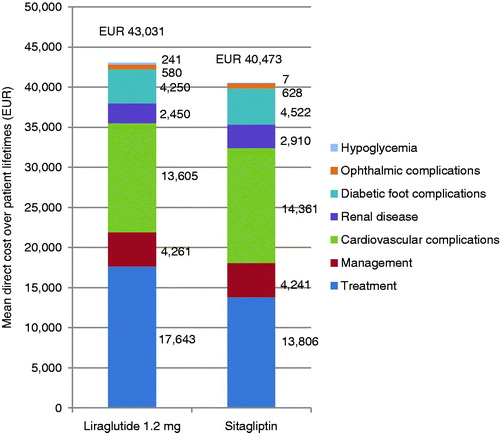
Liraglutide was associated with higher mean direct costs vs sitagliptin by €2558 per patient (95% CI = €2427–€2689). This increase was driven by the increased acquisition costs of liraglutide over sitagliptin in the first 5 years of the simulation (). However, the higher pharmacy costs were partially offset by the reduced costs of treating diabetes-related complications. The most notable savings were made as a result of cardiovascular complications avoided, where treatment with liraglutide was associated with cost savings of €756 per patient. Based on these estimates, liraglutide was associated with an incremental cost-effectiveness ratio (ICER) of €10,275 per QALY gained vs sitagliptin in France.
Figure 1. Mean direct costs associated with liraglutide 1.2 mg and sitagliptin over patient lifetimes. EUR, 2013 Euros.
Liraglutide vs sitagliptin: sensitivity analyses
Sensitivity analyses (shown in full in ) found that the cost-effectiveness outcomes were most sensitive to changes in the time horizon of the modeling analysis. As the time horizon was reduced, the ICER increased, with a 5-year time horizon producing an ICER of €114,401 per QALY gained. This was primarily due to the improvements in physiological parameters associated with liraglutide reducing the risk of long-term complications, as these benefits are not fully realized over shorter time horizons. Changing the discount rate also reflected the long-term benefits associated with liraglutide, with the ICER increasing when a discount rate of 5% was applied, and falling when a discount rate of 0% was applied.
Table 4. Liraglutide vs sitagliptin: Results of the sensitivity analyses.
Abolishing each of the treatment effects in turn identified that the key driver of improved health outcomes with liraglutide was the improvement in HbA1c. When this difference was abolished (i.e., the change was assumed to be the same as in the sitagliptin arm), the incremental quality-adjusted life expectancy benefit fell from 0.25 QALYs to 0.05 QALYs, and the ICER increased to €81,511 per QALY gained. Removing other treatment differences and applying only statistically significant differences had a smaller impact on the outcomes relative to the base case. Using alternative assumptions (either assuming that HbA1c was equal following treatment intensification or using the UKPDS progression curve) around the long-term progression of HbA1c resulted in changes in the cost-effectiveness outcomes, with ICERs increased when the alternative approaches were used.
Changing the timing of treatment switching led to changes in the ICER. It was found to increase when patients received incretin therapy for 7 years, due to the increased acquisition costs of liraglutide, and fell when treatment switching was brought forward. Switching patients receiving liraglutide from 1.2 mg to 1.8 mg after 2 years led to an increased ICER of €17,071 per QALY gained, due to the increased acquisition cost of the higher liraglutide dose.
Taking into account indirect as well as direct costs reduced the cost increase associated with liraglutide and consequently the ICER decreased by ∼€1000 per QALY gained (from €10,275 to €9197 per QALY gained).
Liraglutide vs sitagliptin: PSA
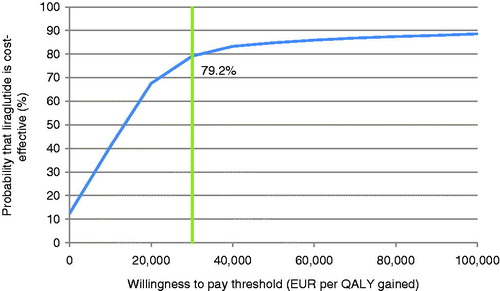
PSA with sampling around cohort characteristics, treatment effects, complication costs, and utilities showed similar mean results to the base case, but increased measures of variance around the mean outcomes. The mean incremental improvement in quality-adjusted life expectancy with liraglutide was 0.24 QALYs at an increased cost of €2799 vs sitagliptin. This produced an ICER of €11,777 per QALY gained. The incremental cost-effectiveness scatterplot presents the incremental costs vs incremental effectiveness (QALYs gained) for liraglutide vs sitagliptin (), and shows 1000 mean values, each from a cohort of 1000 patients run through the model with sampling from distributions around model input parameters. The majority (80.1%) of points fell in the upper right quadrant, with both increased effectiveness (i.e., incremental quality-adjusted life expectancy) and increased total costs for liraglutide compared with sitagliptin. The data from the scatterplot were used to generate a cost-effectiveness acceptability curve (CEAC, ). Based on this analysis, assuming a willingness-to-pay threshold of €30,000 per QALY gained, the modeling analysis indicated that there was a 79.2% probability that liraglutide would be cost-effective vs sitagliptin.
Figure 2. Liraglutide vs sitagliptin: Cost-effectiveness scatterplot for the probabilistic sensitivity analyses. EUR, 2013 Euros, QALY, quality-adjusted life year.
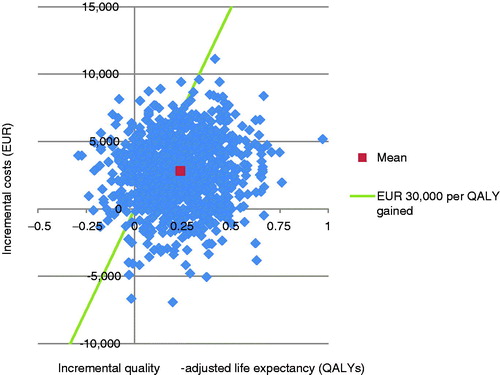
Figure 3. Liraglutide vs sitagliptin: Cost-effectiveness acceptability curve for the probabilistic sensitivity analysis. EUR, 2013 Euros; QALY, quality-adjusted life year.
Liraglutide vs glimepiride: base case
Liraglutide therapy was associated with increased discounted life expectancy by 0.16 years (95% CI = 0.14–0.18 years) and increased discounted quality-adjusted life expectancy by 0.23 QALYs (95% CI = 0.22–0.24) compared with glimepiride (). The clinical benefits in the liraglutide arm were primarily driven by a reduction in BMI with liraglutide over glimepiride. The mean time to onset of diabetes-related complications was increased with liraglutide, with the mean time free from all complications increased from 6.3 years with glimepiride to 6.6 years with liraglutide.
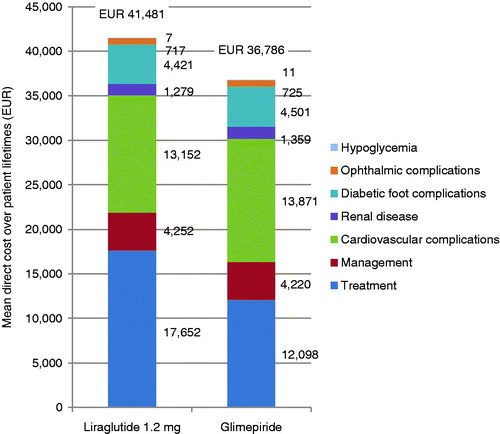
Liraglutide was associated with increased mean direct costs by €4695 (95% CI = €4582–€4807), vs glimepiride (). This increase in costs was driven by the increased acquisition cost of liraglutide over glimepiride during the first 5 years of the simulation. However, this was partially offset by the reduced costs of treating diabetes-related complications; most notably cardiovascular complications where liraglutide was associated with mean savings of €719. These projections of cost and clinical outcomes produced an ICER of €20,709 per QALY gained.
Figure 4. Mean direct costs associated with liraglutide 1.2 mg and glimepiride over patient lifetimes EUR, 2013 Euros; QALYs, quality-adjusted life years.
Liraglutide vs glimepiride: sensitivity analyses
As in the comparison with sitagliptin, sensitivity analyses for the liraglutide vs glimepiride comparison () found that outcomes were most sensitive to changes in time horizon. At a time horizon of 5 years the ICER increased to €57,285 per QALY gained. As in the analysis vs sitagliptin, this was as a result of the long-term benefits of liraglutide therapy not being fully captured at shorter time horizons. Applying alternative discount rates also showed the long-term benefits associated with liraglutide. Removing differences between the treatment arms identified that the key driver of cost-effectiveness was the reduction in BMI with liraglutide, as opposed to a BMI increase with glimepiride. In the scenario with no difference in BMI, the ICER was €27,675 per QALY gained. Applying only the statistically significant differences (of BMI and systolic blood pressure) resulted in an ICER of €35,884 per QALY gained. Using alternative assumptions (either assuming that HbA1c was equal following treatment intensification or using the UKPDS progression curve) around the long-term progression of HbA1c resulted in changes in the cost-effectiveness outcomes, with ICERs increased when the alternative approaches were used, but these remained below €30,000 per QALY gained.
Table 5. Liraglutide vs glimepiride: Results of the sensitivity analyses.
Changing the timing of treatment switching led to changes in the ICER. ICERs increased when patients received liraglutide or glimepiride for 7 years, and fell when treatment switching was brought forward. Switching patients receiving liraglutide from 1.2 mg to 1.8 mg after 2 years led to an increased ICER of €28,533 per QALY gained, due to the increased acquisition cost of the higher liraglutide dose.
Taking into account indirect as well as direct costs reduced the cost increase associated with liraglutide and consequently the ICER decreased by ∼€1200 per QALY gained.
Liraglutide vs glimepiride: PSA
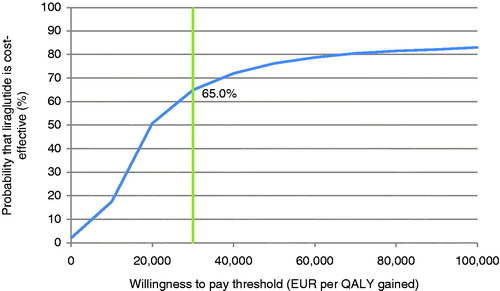
PSA with sampling around cohort characteristics, treatment effects, complication costs, and utilities showed similar mean results to the base case, but increased measures of variance around the mean outcomes. The mean incremental improvement in quality-adjusted life expectancy with liraglutide was 0.23 QALYs at an increased cost of €4495 vs glimepiride. This resulted in an ICER of €19,803 per QALY gained. The incremental cost-effectiveness scatterplot presents the incremental costs vs incremental effectiveness (QALYs gained) for liraglutide vs glimepiride (), and shows 1000 mean values, each from a cohort of 1000 patients run through the model with sampling from distributions around model input parameters. The majority (86.6%) of points fell in the upper right quadrant with both increased effectiveness (i.e. incremental quality-adjusted life expectancy) and increased total costs for liraglutide compared with glimepiride. The data from the scatterplot were used to generate a cost-effectiveness acceptability curve (). Based on this analysis, assuming a willingness-to-pay threshold of €30,000 per QALY gained, the modeling analysis indicated that there was a 65.0% probability that liraglutide would be cost-effective vs glimepiride.
Figure 5. Liraglutide vs glimepiride: Cost-effectiveness scatterplot for the probabilistic sensitivity analyses. EUR, 2013 Euros, QALY, quality-adjusted life year.
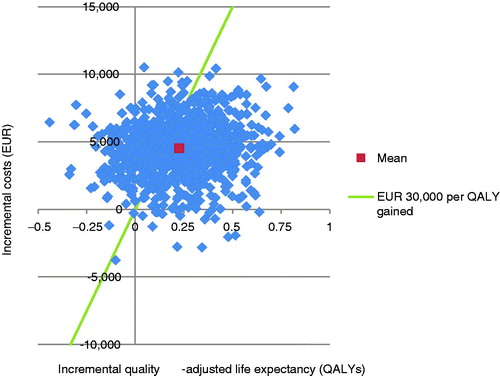
Figure 6. Liraglutide vs glimepiride: Cost-effectiveness acceptability curve for the probabilistic sensitivity analysis. EUR, 2013 Euros; QALY, quality-adjusted life year.
Discussion
The present long-term cost-effectiveness analyses have demonstrated that liraglutide 1.2 mg is associated with improved life expectancy and quality-adjusted life expectancy compared with sitagliptin and glimepiride. Clinical improvements in both comparisons resulted from a reduced incidence and increased time to onset of diabetes-related complications. The gains in quality-adjusted life expectancy with liraglutide over alternative treatments are likely to be considered significant by a healthcare payer. Liraglutide was associated with an increase in direct medical costs over patient lifetimes in both comparisons. This was due to increased pharmacy costs with liraglutide over the short-term, but was partially offset by reduced costs of treating diabetes-related complications over the long-term. Based on the projected outcomes, liraglutide was associated with ICERs of €10,436 and €20,709 per QALY gained vs sitagliptin and glimepiride, respectively, in the French setting for patients with type 2 diabetes not achieving glycemic targets on metformin monotherapy. These ICERs fall below the commonly quoted willingness-to-pay threshold of €30,000 per QALY gained, and, therefore, liraglutide is likely to be considered cost-effective. As interest in economic evaluation of new health technologies in France increases, the results of studies such as the present analysis are likely to become increasingly important for healthcare decision-making.
Metformin remains the first-line therapy for patient with type 2 diabetes, but modulation of incretin activity, through addition of a GLP-1 receptor agonist or a DPP-4 inhibitor, represents a potential therapy option for patients failing to achieve glycemic control. The GLP-1 receptor agonists and DPP-4 inhibitors offer alternatives to long-standing second-line treatment options, such as sulfonylureas (associated with increased risk of hypoglycemic events and modest weight gain)Citation29. Modern treatment of type 2 diabetes is based around maintaining glycemic control, but also addressing the comorbidities associated with diabetes, specifically obesity, hypertension, and dyslipidemia, and the trial data suggest that incretin therapy may be useful in terms of managing a variety of risk factorsCitation16–18. Through maintaining this multi-factorial control, the risk of long-term diabetes-related complications can be reduced. The present analysis also suggests that these approaches may be cost-effective from a healthcare payer perspective in France.
A systematic review by Zueger et al.Citation30 identified two previous studies comparing the cost-effectiveness of liraglutide and sitagliptin, one comparing liraglutide and glimepiride, and one comparing liraglutide with both sitagliptin and glimepiride. These studies evaluated cost-effectiveness in the UK, Spain, the US, and ChinaCitation14,Citation15,Citation31,Citation32. The results of the comparison with sitagliptin in the present analysis are in agreement with previous analyses, with liraglutide associated with increased effectiveness and increased costs. In all three settings, ICERs fell below commonly quoted country-specific willingness-to-pay thresholds. Results for the comparison with glimepiride vary across the two previously published analyses. In the UK, 1.2 mg liraglutide was found to be cost-effective, agreeing with the results of the present analysis. However, in the analysis in the Chinese setting, 0.6 mg liraglutide and 1.2 mg liraglutide were found to be dominated by glimepiride (associated with worse clinical outcomes at a higher cost), while 1.8 mg liraglutide was found to improve clinical outcomes but was not considered cost-effective. The results of the analysis in the Chinese setting are likely to differ from the present analysis and the UK analysis due to the clinical trial on which the analyses were based. The present analysis and the UK analysis used the same data to inform the comparison (LEAD 2, a multi-national study carried out in 21 countries), whereas the analysis in the Chinese setting used an alternative trial carried out in Asia. Use of alternative models (CORE Diabetes Model and UKPDS Outcomes Model) may also have affected the agreement of the modeling analysis.
One potential shortcoming of the present analysis is that the health-state utilities used were not specific to the French setting. There is evidence that suggests that the same health state may be valued differently in alternative settings, with a number of country-specific EQ-5D value sets now availableCitation33. Recently a French-specific valuation set for the EQ-5D has been publishedCitation34. The present study investigated the possibility of using this valuation set to modify the utility values used, but this was not possible as the required patient-level data was not accessible. As the France-specific EQ-5D valuation set becomes more widely used, the opportunity to use France-specific values in economic evaluation should be taken up, increasing the relevance of analyses to the French setting and healthcare payers.
A potential limitation of the comparison with sitagliptin is that all parts of the LIRA-DPP4 trial used to inform the analysis were open label (the LEAD-2 study was double-blinded). This may have led to patients having different expectations of the effects of liraglutide or sitagliptin, which may have influenced adherence to lifestyle recommendations, although the extent of any such effect is difficult to assess. The impact of this potential effect on the present study has been minimized by only using trial end-points measured through objective tests (such as HbA1c and systolic blood pressure). Moreover, the findings of the trial reported in the LIRA-DPP4 study are similar to other head-to-head trials comparing GLP-1 receptor agonists with DPP-4 inhibitorsCitation35,Citation36.
In real-world clinical practice, the impact of adherence to the diabetes medications evaluated may also need to be considered. Whilst adherence to alternative GLP-1 receptor agonists has been assessed, currently there is no evidence to suggest that injectable GLP-1 receptor agonists are associated with lower adherence rates than oral DPP-4 inhibitors or glimepirideCitation37,Citation38. Moreover, the impact of adherence on cost-effectiveness is difficult to assess, as both clinical outcomes and costs will be affected by adherence rates and insufficient data is currently available. To date, the impact of adherence on an economic evaluation has only been assessed in theoretical examples, due to the large number of assumptions around both costs and effects that this entailsCitation39.
The present analysis relies on short-term clinical data to make long-term predictions of outcomes over long-term time horizons using risk equations based on surrogate outcomes. This approach has been criticized in two recent reviewsCitation40,Citation41. However, this is a limitation inherent to most cost-effectiveness modeling studies, and studies of this type represent one of the best available options for making estimates of long-term clinical and economic outcomes in the absence of long-term clinical data. Moreover, the use of long-term time horizons for diabetes modeling is supported by published guidanceCitation42. The generalizability of the risk equations used in modeling analyses must also be considered, with data (such as that from the UKPDS) now historic and perhaps not representative of modern diabetes treatment in France. There is likely to be considerable uncertainty around risk equations (used to calculate incidence of complications) and progression equations (used to calculate long-term changes in surrogate outcomes) over long-term time horizons, and these may not reflect the population evaluated in the present analysis due to insufficient calibration. As a result there is unavoidable uncertainty around how well the modeling analysis represents the real world. The present study aims to minimize this limitation, through use of a recently validated model to conduct the analysis, and basing changes in physiological parameters on data collected in two randomized controlled trialsCitation22,Citation23. Furthermore, extensive sensitivity analysis has been conducted to investigate uncertainty and the impact of alternative model inputs.
Conclusions
Long-term projections based on two recent clinical trials provided evidence that liraglutide is cost-effective vs sitagliptin and glimepiride in patients with type 2 diabetes failing metformin monotherapy in France.
Transparency
Declaration of funding
The study was supported by funding from Novo Nordisk.
Declaration of financial/other relationships
RR has served as an advisor or consultant for AstraZeneca, Lilly; Boehringer Ingelheinm; Janssen; MSD; Novo Nordisk; Sanofi; Abbvie; Novartis; Roche. LM has served as an advisor or consultant for Amgen Inc.; AstraZeneca Pharmaceuticals LP; GlaxoSmithKline; Ipsen; Lilly; Mayoly Spindler; Menarini; Novo Nordisk; Pfizer Inc; Abbvie; Novartis; Roche. BH and WV are employees of Ossian Health Economics and Communications, which received a consulting fee from Novo Nordisk to support the study. TV, HD, PE, and MG are employees of Novo Nordisk.
References
- International Diabetes Federation. IDF Diabetes Atlas, 6th edn. Brussels: Belgium International Diabetes Federation, 2013
- Zhang P, Zhang X, Brown J, et al. Global healthcare expenditure on diabetes for 2010 and 2030. Diabetes Res Clin Pract 2010;87:293-301
- UK Prospective Diabetes Study (UKPDS) Group. Intensive blood-glucose control with sulphonylureas or insulin compared with conventional treatment and risk of complications in patients with type 2 diabetes (UKPDS 33). Lancet 1998;352:837-53
- Gaede P, Vedel P, Larsen N, et al. Multifactorial intervention and cardiovascular disease in patients with type 2 diabetes. N Engl J Med 2003;348:383-93
- Gaede P, Lund-Andersen H, Parving HH, et al. Effect of a multifactorial intervention on mortality in type 2 diabetes. N Engl J Med 2008;358:580-91
- Gaede P, Valentine WJ, Palmer AJ, et al. Cost-effectiveness of intensified versus conventional multifactorial intervention in type 2 diabetes: results and projections from the Steno-2 study. Diabetes Care 2008;31:1510-15.
- Webb DR, Khunti K, Gray LJ, et al. Intensive multifactorial intervention improves modelled coronary heart disease risk in screen-detected Type 2 diabetes mellitus: a cluster randomized controlled trial. Diabet Med 2012;29:531-40
- Sandbæk A1, Griffin SJ2, Sharp SJ2, et al. Effect of early multifactorial therapy compared with routine care on microvascular outcomes at 5 years in people with screen-detected diabetes: a randomized controlled trial: the ADDITION-Europe Study. Diabetes Care 2014;37:2015-23
- Nathan DM, Buse JB, Davidson MB, et al. Medical management of hyperglycemia in type 2 diabetes: a consensus algorithm for the initiation and adjustment of therapy: a consensus statement from the American Diabetes Association and the European Association for the Study of Diabetes. Diabetes Care 2009;32:193-203
- Drucker DJ, Nauck MA. The incretin system: glucagon-like peptide-1 receptor agonists and dipeptidyl peptidase-4 inhibitors in type 2 diabetes. Lancet 2006;368:1696-705
- Husereau D, Drummond M, Petrou S, et al. Consolidated Health Economic Evaluation Reporting Standards (CHEERS) statement. Int J Technol Assess Health Care 2013;29:117-22
- O'Reilly D, Gaebel K, Xie F, et al. Health economic evaluations help inform payers of the best use of scarce health care resources. Int J Circumpolar Health 2011;70:417-27
- Haute Autorité de santé. Choices in Methods for Economic Evaluation. Saint-Denis La Plaine: Haute Autorité de santé Communication Department, 2012. http://www.has-sante.fr/portail/upload/docs/application/pdf/2012-10/choices_in_methods_for_economic_evaluation.pdf. Accessed August 28, 2014
- Davies MJ, Chubb BD, Valentine WJ. Cost-utility analysis of liraglutide compared with sulphonylurea or sitagliptin, all as add-on to metformin monotherapy in Type 2 diabetes mellitus. Diabet Med 2012;29:313-20
- Mezquita Raya P, Pérez A, Ramírez de Arellano A, et al. Incretin therapy for type 2 diabetes in Spain: a cost-effectiveness analysis of liraglutide versus sitagliptin. Diabetes Ther 2013;4:417-30
- Pratley RE, Nauck M, Bailey T, et al; 1860-LIRA-DPP-4 Study Group. Liraglutide versus sitagliptin for patients with type 2 diabetes who did not have adequate glycaemic control with metformin: a 26-week, randomised, parallel-group, open-label trial. Lancet 2010;375:1447-56
- Pratley R, Nauck M, Bailey T, et al. One year of liraglutide treatment offers sustained and more effective glycaemic control and weight reduction compared with sitagliptin, both in combination with metformin, in patients with type 2 diabetes: a randomised, parallel-group, open-label trial. Int J Clin Pract 2011;65:397-407
- Nauck M, Frid A, Hermansen K, et al. Efficacy and safety comparison of liraglutide, glimepiride, and placebo, all in combination with metformin, in type 2 diabetes: the LEAD (liraglutide effect and action in diabetes)-2 study. Diabetes Care 2009;32:84-90
- Palmer AJ, Roze S, Valentine WJ, et al. The CORE Diabetes Model: projecting long-term clinical outcomes, costs and cost-effectiveness of interventions in diabetes mellitus (Types 1 and 2) to support clinical and reimbursement decision-making. Curr Med Res Opin 2004;20(1 Suppl):5-26
- Palmer AJ, Roze S, Valentine W, et al. Validation of the CORE Diabetes Model against epidemiological and clinical studies. Curr Med Res Opin 2004;20(Suppl 1):27-40
- McEwan P, Foos V, Palmer JL, et al. Validation of the IMS CORE Diabetes Model. Value Health 2014;17:714-24
- van Dieren S1, Kengne AP, Chalmers J, et al. Intensification of medication and glycaemic control among patients with type 2 diabetes - the ADVANCE trial. Diabetes Obes Metab 2014;16:426-32.
- Holman RR, Paul SK, Bethel MA, et al. 10-year follow-up of intensive glucose control in type 2 diabetes. N Engl J Med 2008;359:1577-89
- Institut national de la statistique et des études économiques. Indices pour les revalorisations de pensions alimentaires. Paris: Institut mational de la statisique et des études éeconomiques, 2014. http://www.insee.fr/en/themes/conjoncture/serie_revalorisation.asp. Accessed August 28, 2014
- Allicar MP, Megas F, Houzard S, et al. Frequency and costs of hospital stays for hypoglycemia in France in 1995. Presse Med 2000;29:657-61
- Sørensen J, Ploug UJ. The cost of diabetes-related complications: registry-based analysis of days absent from work. Econ Res Int 2013;2013:Article ID 618039
- Beaudet A, Grabbi E, Maurel F, et al. Review of cost of diabetes complications in four European Countries. Value Health 2013;16:A443-4
- Gourdy P, Penfornis A, Charpentier G, et al. Effectiveness and tolerability with liraglutide among patients with type 2 diabetes – 2-year data from EVIDENCE: a prospective, follow-up, post-marketing study. Abstract presented at European Association for the Study of Diabetes annual meeting 2014, Vienna
- Inzucchi SE, Bergenstal RM, Buse JB, et al. Management of hyperglycemia in type 2 diabetes: A patient-centered approach: Position statement of the American Diabetes Association (ADA) and the European Association for the Study of Diabetes (EASD). Diabetes Care 2012;35:1364-79
- Zueger PM, Schultz NM, Lee TA. Cost Effectiveness of Liraglutide in Type II Diabetes: A Systematic Review. Pharmacoeconomics 2014;32:1079-91
- Lee WC, Samyshkin Y, Langer J, et al. Long-term clinical and economic outcomes associated with liraglutide versus sitagliptin therapy when added to metformin in the treatment of type 2 diabetes: a CORE Diabetes Model analysis. J Med Econ 2015;15(2 Suppl):28-37
- Gao L, Zhao FL, Li SC. Cost-utility analysis of liraglutide versus glimepiride as add-on to metformin in type 2 diabetes patients in China. Int J Technol Assess Health Care 2012;28:436-44
- Szende A, Oppe M, Devlin N, eds. EQ-5D Value sets: inventory, comparative review and user guide. Dordrecht, Netherlands: Springer, 2007
- Chevalier J, de Pouvourville G. Valuing EQ-5D using time trade-off in France. Eur J Health Econ 2013;14:57-66
- Bergenstal RM, Forti A, Chiasson J, et al. Once weekly taspoglutide, a human GLP-1 analog, is superior to sitagliptin in improving glycaemic control and weight loss in patients with type 2 diabetes (T2D): results from the T-emerge 4 trial. Diabetes 2010;59(1 Suppl):A16 (58-OR)
- Bergenstal RM, Wysham C, MacConell L, et al. Efficacy and safety of exenatide once weekly versus sitagliptin or pioglitazone as an adjunct to metformin for treatment of type 2 diabetes (DURATION-2): a randomised trial. Lancet 2010;376:431-9
- Malmenäs M, Bouchard JR, Langer J. Retrospective real-world adherence in patients with type 2 diabetes initiating once-daily liraglutide 1.8 mg or twice-daily exenatide 10 μg. Clin Ther 2013;35:795-807
- Pelletier EM, Pawaskar M, Smith PJ, et al. Economic outcomes of exenatide vs liraglutide in type 2 diabetes patients in the United States: results from a retrospective claims database analysis. J Med Econ 2012;15:1039-50
- Cobden DS, Niessen LW, Rutten FF, et al. Modeling the economic impact of medication adherence in type 2 diabetes: a theoretical approach. Patient Prefer Adherence 2010;4:283-90
- Raimond V, Josselin JM, Rochaix L. HTA agencies facing model biases: the case of type 2 diabetes. Pharmacoeconomics 2014;32:825-39
- Asche CV, Hippler SE, Eurich DT. Review of models used in economic analyses of new oral treatments for type 2 diabetes mellitus. Pharmacoeconomics 2014;32:15-27
- American Diabetes Association Consensus Panel. Guidelines for computer modeling of diabetes and its complications. Diabetes Care 2004;27:2262-5