
Abstract
Objective:
To assess downstream healthcare resource utilization (HRU) and costs among immediate release (IR) hydrocodone patients by days’ supply and average doses/month in the prior 6 months.
Methods:
Retrospective analysis using healthcare claims from Truven MarketScan commercial, Medicare supplemental, and Medicaid multistate databases was performed. Patients prescribed IR hydrocodone during the 6-month baseline (July–December 2011), and with continuous enrollment during baseline and the 12-month follow-up (2012) were selected. HRU and per-patient-per-month (PPPM) costs (2014 US dollars) were assessed at follow-up. Descriptive analyses and multivariate regressions were conducted to compare HRU and costs at follow-up by days’ supply (<60 vs ≥60 days) and average doses per month (≤60 vs >60 doses/month) of IR hydrocodone at baseline.
Results:
In total, 1,698,845 commercial, 264,038 Medicare, and 151,063 Medicaid IR hydrocodone patients were identified. During follow-up, commercial patients with prior ≥60 days’ supply were more likely to have an inpatient admission (13.2% vs 7.5%), outpatient hospital visit (69.1% vs 57.0%), office visit (97.6% vs 91.0%), emergency room (ER) visit (28.1% vs 21.4%), and had higher PPPM total costs ($1494 vs $842) than the <60 days’ supply sub-group (all p < 0.05). Among commercial patients the adjusted odds ratio for prior ≥60 days’ supply of IR hydrocodone vs prior <60 days’ supply was 1.62 (inpatient), 1.33 (outpatient), 2.58 (office visit) and 1.48 (ER) (all p-values <0.05). Adjusted all-cause total costs were higher ($1245 vs $851, p <0.05) among commercial patients with longer days’ supply than those with shorter days’ supply. Trends were similar with ≤60 vs >60 doses per month sub-groups and across all plan types.
Conclusion:
Increased days’ supply and higher doses/month of IR hydrocodone in the prior 6 months may help to predict levels of HRU and costs in the following year, providing an opportunity to identify patients in order to implement interventions to improve their quality of care.
Introduction
According to a 2011 Institute of Medicine of the National Academies report, there are ∼100 million adults (∼44% of adults) in the US who experience chronic painCitation1 and the worldwide prevalence ranges from 10–55%Citation2. Previous studies have documented adverse effects of chronic pain on physical and mental healthCitation3, and reduced ability to perform daily activitiesCitation3,Citation4, which further impacts employment and economic well-beingCitation3. The complex nature of chronic pain, including substantial health and financial burden, makes the management of chronic pain a clinical challengeCitation3.
Opioids are often used to manage chronic painCitation5, and immediate-release (IR) hydrocodone is among the most widely prescribed opioid analgesic in the USCitation6. A recent report found that almost half of new patients prescribed opioids for more than 30 days in the first year continued to use them for 3 or more years, with about half of those patients prescribed only IR opioidsCitation7. Seventy-five per cent of patients identified as being chronic users of IR hydrocodone (based on average daily dose exceeding 20 mg) were found to have a diagnosis of neuropathic pain, back pain, and/or osteoarthritisCitation8. Furthermore, chronic users of IR hydrocodone were found to have higher rates of certain comorbidities such as liver-related conditions, mental health conditions, as well as hip/knee replacements, and spinal surgeries, as compared with non-chronic hydrocodone usersCitation8. Higher comorbidity levels and poor health among patients taking IR hydrocodone on a chronic basis suggest that these patients may have higher healthcare resource utilization (HRU) and costs than non-chronic IR hydrocodone patients. Moreover, utilization patterns of IR hydrocodone in the prior year may help to predict future healthcare service utilization and costs, providing an opportunity to identify patients in order to implement interventions to improve their quality of care. However, to the best of our knowledge, no prior study has assessed the impact of different levels of IR hydrocodone use on downstream HRU and costs.
The objective of the current study was to assess downstream annual HRU and costs among IR hydrocodone patients by days’ supply and average doses per month for IR hydrocodone in the prior 6 months.
Materials and methods
Data source
This study utilized administrative claims data from the 2011–2012 Truven MarketScan Commercial Claims and Encounters Research Database, Medicare Supplemental Database, and Medicaid Multistate Database, which are components of the Truven Health MarketScan Research DatabasesCitation9. The MarketScan data are submitted by employers, managed care organizations, hospitals, and Medicare and Medicaid programs. The MarketScan claims databases provide a nationally representative data sample of the US population with employer-provided health insurance, capturing the full continuum of care in all settings, including but not limited to: physician office visits; hospital stays; retail, mail order, and specialty pharmacies. Moreover, the databases allow tracking of patients over multiple years and also across health plans. In addition, the MarketScan databases contain detailed outpatient prescription drug information. Since these databases are primarily used for research purposes, they are Health Insurance Portability and Accountability Act (HIPAA) compliant and, thus, exempt from Institutional Review Board (IRB) approvalsCitation9.
Sample selection
The study index date was set to January 1, 2012. Patients were identified if they had at least one IR hydrocodone prescription during the 6-month baseline period (July 1, 2011–December 31, 2011). Any IR hydrocodone prescription that was not pain-related (e.g., therapeutic class descriptions for antitussive or sympathomimetic) was excluded. Patients were required to have continuous insurance (medical and pharmacy) enrollment for the 6-month baseline period and the 12-month follow-up period (ending December 31, 2012). Patients were excluded if they had a claim for an extended-release/long acting (ER/LA) opioid during the baseline period.
Study measures
Baseline demographic characteristics including age and gender were reported for each patient. Clinical status was assessed during the baseline period using the Charlson Comorbidity Index (CCI) which was adapted to predict costsCitation10 by summarizing the overall burden of potential co-morbid diseases within the claims data. IR hydrocodone prescription data were utilized to estimate the number of days’ supply and average number of doses per month of IR hydrocodone in the baseline period. The study sample was then categorized into the following sub-groups by days’ supply of IR hydrocodone in the baseline period: <60, ≥60, and ≥90 days. Days’ supply was defined as the maximum period of consecutive days with supply during the baseline period. The ‘consecutive’ calculation allowed a maximum gap of 30 days between two consecutive prescription pick-ups to reflect real-world behavior (e.g., delays in picking up prescriptions and non-adherence). Similarly, the study sample was categorized into the following sub-groups based on the average number of IR hydrocodone doses per month in the baseline period: ≤60, >60, ≥90, and ≥120, which was calculated as the total number of IR hydrocodone doses prescribed during the baseline period divided by 6 months. Initial cut points for the ≥60 days’ supply and >60 doses per month sub-populations were defined a priori to identify patients that received a minimum of 2 full months of therapy (at least one monthly refill) or more than two doses per day on average, respectively.
Study outcomes
Levels of HRU and costs in the follow-up period were estimated for the overall sample as well as the sub-groups defined by days’ supply and doses per month during the baseline period. The HRU events included inpatient admission, outpatient hospital visit, office visit, and emergency room visit. All-cause costs were stratified by medical costs, opioid prescription costs, and other pharmacy costs. As the study assessed the costs from the perspective of a payer, included in the reported medical costs were all non-pharmacy claims paid by the plan for care of the member, claims paid by the plan for care of the member, excluding co-insurance and co-pays. These may include, but are not limited to: inpatient, outpatient, emergency room, medical equipment, and others; however, the patient’s portion (out-of-pocket costs) was not included. Medical services and prescriptions completely paid out-of-pocket or paid by other supplemental insurances were not captured in this study. Each type of cost was reported at the per-patient per-month (PPPM) level, which was calculated by dividing the annual per-patient costs by 12 months. All healthcare costs were adjusted to 2014 US dollars using the medical component of the Consumer Price Index.
Statistical analysis
Descriptive analyses were conducted to summarize and compare baseline demographic information, HRU, and costs by baseline days’ supply. Costs were based on the paid amounts as reported in the Truven MarketScan database for each claim. Mean and standard deviation (SD) were reported for continuous variables; frequency and percentages for categorical variables. Comparisons of study measures between the sub-groups based on baseline IR hydrocodone days’ supply or average doses per month were based on t-tests and chi-square test for continuous and categorical variables, respectively. As there were differences observed in the baseline demographic and cost measures, multivariate regressions were conducted to assess the adjusted difference in HRU and cost by days’ supply and doses per month. Logistic regression was used to estimate HRU in the follow-up period, adjusting for baseline patient characteristics, including demographics and clinical characteristics, and total healthcare costs during the 6-month baseline period. Adjusted odds ratios (ORs) for HRU by baseline days’ supply and average doses per month for IR hydrocodone were reported. A generalized linear model (GLM) with log link and gamma distribution was used to estimate all-cause total costs. Based on the coefficients of the regression results, the predicted all-cause total costs by baseline days’ supply and average doses per month were estimated using the method of recycled predictionsCitation11. We used the regression coefficients to predict the mean adjusted outcomes by assuming that all patients were in each of the sub-groups for baseline days’ supply or average doses per monthCitation11. A p-value <0.05 was considered statistically significant.
Results
A total of 1,698,845 commercial, 264,038 Medicare, and 151,063 Medicaid IR hydrocodone patients met the sample selection criteria for the study (). Patient baseline characteristics are presented in . Patients in the commercial and Medicaid samples with <60 days’ supply of IR hydrocodone during baseline were significantly younger than the sub-groups with ≥60 days’ supply, while patients in the Medicare sample with <60 days’ supply were significantly older than the group with ≥60 days’ supply. Across all three insurance types, the sub-groups with <60 days’ supply had a significantly lower co-morbidity burden than the sub-groups with ≥60 days’ supply, as measured by the CCI. Baseline costs among the commercial and Medicaid samples were significantly higher in the ≥60 days’ supply sub-groups as compared to the <60 days’ supply sub-groups, whereas, for patients in the Medicare sample, the sub-group with ≥60 days’ supply of IR hydrocodone had significantly lower baseline costs than the sub-group with <60 days’ supply.
Figure 1. Sample selection. *Prescriptions for IR hydrocodone that were not pain-related (e.g., antitussive or sympathomimetic) were excluded.
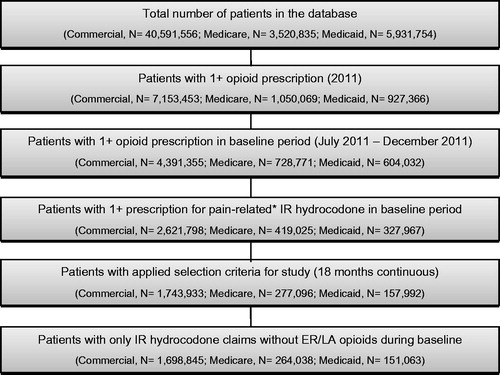
Table 1. Patient baseline characteristics.
Unadjusted results
In the commercial sample, 7.5% of patients with baseline <60 days’ supply had an inpatient admission during the follow-up period compared to 13.2% of patients with baseline ≥60 days’ supply (). Similarly, 57.0% of patients with baseline <60 days’ supply had an outpatient hospital visit during follow-up compared to 69.1% of patients with baseline ≥60 days’ supply, and 21.4% of patients with baseline <60 days’ supply had an emergency room visit compared to 28.1% of patients with baseline ≥60 days’ supply. There was also a lower likelihood of office visits among patients in the baseline <60 days’ supply sub-group (91.0%) than the baseline ≥60 days’ supply sub-group (97.6%). For Medicare and Medicaid samples, patients with baseline <60 days’ supply of IR hydrocodone were significantly less likely to have at least one inpatient admission, outpatient hospital visit, or emergency room visit than were patients with either baseline ≥60 days’ supply or ≥90 days’ supply (see Appendix A for details). Across insurance types, the results indicated a plateau effect once the baseline days’ supply exceeded 60 days (i.e., the likelihood of having HRU did not increase noticeably after the 60 days’ supply cut point).
Figure 2. Any HRU event during the 12-month follow-up period, by baseline days’ supply or doses per month of IR hydrocodone for commercial patients. *p-value is <0.05 vs <60 days’ supply or ≤60 doses/month.
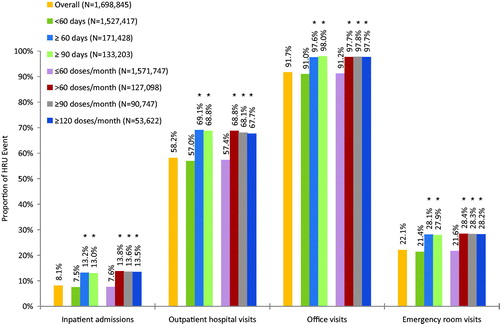
In the commercial sample, similar HRU results were found when assessed by baseline average doses per month (). There was a lower likelihood of having any of the specified HRU events (i.e., inpatient admission, outpatient hospital visit, office visit, emergency room visit) for patients with baseline ≤60 doses per month compared to patients with either baseline >60, ≥90, or ≥120 doses per month. Appendix B provides additional results for the Medicare and Medicaid samples—similar patterns were identified, but were not statistically significant in all sub-groups.
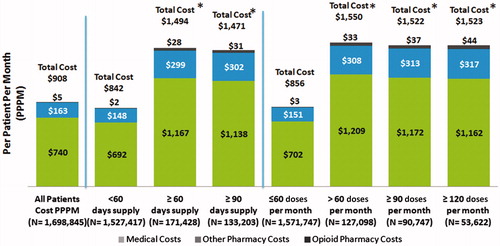
The unadjusted PPPM costs for the IR hydrocodone population were $908 in the follow-up period (). Unadjusted all-cause total costs during the follow-up period were consistently higher among patients with higher days’ supply at baseline as well as those with higher mean doses per month at baseline (). In the commercial sample, PPPM costs were $1494 for patients with baseline ≥60 days’ supply as compared to $842 for patients with baseline <60 days’ supply (p < 0.05). Similar differences were found between baseline ≥90 and <60 days’ supply groups. PPPM costs were $1550 for patients with baseline >60 doses per month as compared to $856 for patients with baseline ≤60 doses per month (p < 0.05). In each sub-group opioid pharmacy costs represented a small proportion of total costs, which were mainly driven by medical costs. Similar trends were observed in the Medicare and Medicaid samples.
Figure 3. PPPM costs for commercial patients.
Adjusted results
After controlling for baseline confounding factors among commercially insured patients, the sub-group with baseline ≥60 days’ supply of IR hydrocodone had significantly higher odds for inpatient admissions (OR = 1.62), outpatient hospital visits (OR = 1.33), office visits (OR = 2.58), and emergency room visits (OR = 1.48), as compared to baseline <60 days’ supply (). When compared to baseline <60 days’ supply, the ≥90 days of supply sub-group also had higher odds for each HRU event. The trend was similar across Medicare and Medicaid samples, except for Medicare patients with baseline ≥60 days’ supply and ≥90 days’ supply where no differences were found in office visits. For Medicaid patients with baseline ≥60 days’ supply and ≥90 days’ supply, no differences were found with inpatient admissions (Appendix C).
Figure 4. Odds ratio of HRU event by baseline days’ supply or doses per month of IR hydrocodone for commercial patients. All HRU events have p-value <0.05 for comparison against <60 days’ supply or ≤60 doses/month.
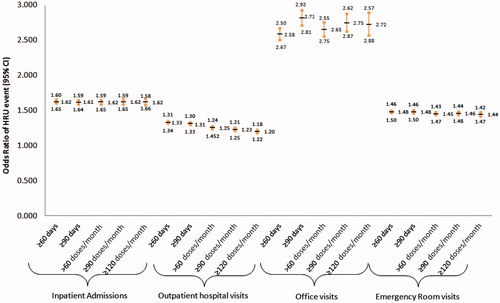
Similar results were found for the sub-groups with elevated doses per month. In the commercial sample, the baseline >60 doses per month sub-group had significantly higher odds of inpatient admissions (OR = 1.62), outpatient hospital visits (OR = 1.25), physician office visits (OR = 2.65), and emergency room visits (OR = 1.45) as compared to the sub-group with baseline ≤60 doses per month (). The baseline ≥90 doses per month and ≥120 doses per month sub-groups also showed similar trends for each HRU event. The trend was similar across the Medicare and Medicaid samples; however, not all trends were statistically significant in all Medicaid sub-groups (Appendix C). For Medicaid patients with baseline ≥90 doses per month and ≥120 doses per month, no differences were found in inpatient admissions.
The predicted, adjusted PPPM costs were significantly higher among patients with baseline ≥60 days’ supply of IR hydrocodone as compared to patients with baseline <60 days’ supply in the commercial ($1245 vs $851), Medicare ($1954 vs $1596), as well as Medicaid ($1372 vs $1206) samples (all p < 0.05). Similar differences were noted in the baseline ≥90 days’ supply group as compared to the baseline <60 days’ supply group ( and ).
Table 2. Predicted, adjusted all-cause total costs during the 12-month follow-up based on regression analyses. Adjusted all-cause total costs by baseline days’ supply for IR hydrocodone.
Table 3. Predicted, adjusted all-cause total costs during the 12-month follow-up based on regression analyses. Adjusted all-cause total costs by baseline average doses per month for IR hydrocodone.
When assessed by baseline doses per month, the predicted adjusted PPPM costs were significantly higher among patients with >60 doses per month as compared to patients with ≤60 doses per month in the commercial ($1250 vs $864), Medicare ($1959 vs $1617), as well as Medicaid ($1376 vs $1225) samples (all p < 0.05). Similar differences were noted in the ≥90 and ≥120 doses per month as compared to ≤60 doses per month group ( and ).
Discussion
To the best of our knowledge this is the first study to assess how utilization patterns of IR hydrocodone, based on either days’ supply or average doses per month in the prior 6 months, may help to predict costs in the following year. Results from this analysis found that high utilizers (sub-groups with ≥60 days’ supply or >60 doses per month of IR hydrocodone) during baseline, had higher comorbidity burden at baseline in the commercial and Medicaid samples and increased HRU and PPPM all-cause total costs in the following year across all insurance types compared with low utilizers (sub-groups with <60 days’ supply or ≤60 doses per month of IR hydrocodone). This study showed that total, all-cause costs were dominated by non-pharmacy expenditures. Even when considering pharmacy costs alone, opioid pharmacy represented only a small fraction of costs within this category. These results suggest higher healthcare costs among high opioid utilizers may be due to increased disease severity and higher co-morbidities.
We observed a plateau effect in HRU and PPPM costs in the 1-year follow-up period when classifying patients beyond the baseline ≥60 days’ supply or >60 doses per month of IR hydrocodone threshold, suggesting that once high utilizers reached a prior threshold of ≥60 days’ supply or >60 doses per month, downstream costs (i.e., in the following year) remained relatively stable. Thus, utilization patterns of IR hydrocodone may help to predict future costs, providing an opportunity for identifying relevant patient sub-populations and intervening as appropriate. The importance of identifying future high cost patients was recently discussed in an article in the policy journal Health AffairsCitation12 focused on the use of big data in identifying and managing high-cost patients; and the authors discussed that significant savings could occur if the prediction of high cost patients is accurate and the management of these patients is tailored appropriately.
The findings from this study are consistent with previous research that assessed the patterns of opioid use and HRU and costs in the real world practice. For example, Cicero et al.Citation13 found that patients with chronic opioid use (>180 therapeutic days or more in the calendar year) had higher concurrent healthcare utilization, including increased physician office visits, emergency room visits, and number of days in the hospital, as compared with acute opioid use (1 prescription for <10 therapeutic days in the calendar year). Another study by Leider et al.Citation14 reported higher follow-up outpatient visits, emergency room visits, and hospital admissions among patients with long-term use of opioids (≥120 days) as compared to those with minimal opioid exposure (no more than one claim for any opioid or no more than two claims for any other pain-related medications). Although the above studies are consistent with these cost findings, the current study is the first to demonstrate that increased days’ supply and higher doses per month of IR hydrocodone in the prior year may help to predict levels of HRU and costs in the following year.
This study highlights the cost burden of pain. Pain severe enough to require daily, around-the-clock, long-term opioid treatment and for which alternative treatment options are inadequate, is an expensive conditionCitation15. The patient population with this condition represents a major source of medical and pharmacy spending, with recent reports that the national cost of pain ranges from $560–$635 billion, greater than the annual costs of heart disease ($309 billion), cancer ($243 billion), and diabetes ($188 billion)Citation15. In the current study, costs related to pain were dominated by non-pharmacy direct medical expenditures. Furthermore, the opioid pharmacy spend represented only a small fraction of the total pharmacy-related costs.
On a per-patient per-month basis, total all-cause costs in the study translate to $908. This represents an average cost per patient that is roughly twice the average cost of all members of a typical commercial plan ($489), highlighting how pain can contribute a significant cost and burden of illnessCitation16. In the current study, total all-cause costs on a per-patient per-month basis for Medicare and Medicaid were $1699 and $1129, respectively. This high cost burden observed in the overall IR hydrocodone patient population is amplified when considering patients with a longer history or with greater prescribed volume of IR hydrocodone. Patients with higher use of IR hydrocodone, measured either by the number of days of supply or the average number of doses prescribed per month over the past 6 months, have higher average monthly costs per patient. In all groups, however, opioids represent a small share of total expenses, although that proportion grows with higher IR hydrocodone use.
Identifying high utilizers of healthcare services is important from a disease management perspective. Disease management interventions may include promoting collaborative practice between physician and support-service providers, increasing patient education, and preventing avoidable medical complications through evidence-based practice guidelines. Identifying high utilizers of healthcare services is crucial from budgetary perspective as well, as the general rule is that a small proportion of individuals with a given disease account for the majority of healthcare costs. A report from the IMS Institute for Healthcare Informatics estimated that the top 1% of privately insured health plan members in the US, based on per person healthcare costs, account for 25% of total costs; and that the top 5% account for 50% of total costsCitation17. Bron et al.Citation18 estimated that, among type 2 diabetes patients receiving oral hypoglycemic agents, 23.5% of these patients accounted for 80% of total costs. In addition to identifying patterns of opioid use and HRU and costs in a real world setting, as a potential next step, it is also important to understand length of opioid therapy and utilization patterns of opioids among IR hydrocodone patients to better inform appropriate treatment decisions and to provide a better understanding of how IR opioids are used to manage pain.
The current study findings need to be interpreted in the light of its limitations. The results presented are most generalizable to similar commercially-insured, Medicare supplemental insurance, and Medicaid patients and may not be generalizable to other populations. Medical services and prescriptions completely paid out-of-pocket or paid by other supplemental insurances were not captured in this study. The results of this study rely on the accuracy of the claims data, so any coding error or discrepancy in the data could have affected the results. The observational nature of the study design does not allow for causal inferences.
Conclusion
Patients with extended length of days’ supply and higher doses per month in the prior 6 months for IR hydrocodone had higher HRU and costs in the following year. Utilization patterns of IR hydrocodone may help to predict future costs, providing an opportunity to identify patients in order to implement interventions to improve their quality of care.
Transparency
Declaration of funding
This manuscript was funded by Purdue Pharma L.P.
Declaration of financial/other relationships
AK, AC, and CP are employees for Evidera, a consulting firm that received funding from Purdue Pharma L.P. for this research. PH is an employee for Purdue Pharma L.P., and JAB and RBJ were employees for Purdue Pharma at the time of the study. HW is a consultant on this project. JME peer reviewers on this manuscript have no relevant financial or other relationships to disclose.
Acknowledgments
Lucy Pan of Evidera is acknowledged for her help with the discussion section. Shuo Yang and Samuel Huse of Evidera are acknowledged for their assistance with the analysis, and Taylor Whitworth of Evidera is acknowledged for her assistance in manuscript preparation.
References
- Institute of Medicine Committee on Advancing Pain Research, Care, and, Education. The National Academies Collection: reports funded by National Institutes of Health. Relieving pain in America: a blueprint for transforming prevention, care, education, and research. Washington, DC: National Academies Press, 2011
- Harstall C, Ospina M. How prevalent is chronic pain? Pain clinical updates. Vol 6. Seattle, WA: International Association for the Study of Pain, 2003. p 1-4
- Smith BH, Elliott AM, Chambers WA, et al. The impact of chronic pain in the community. Famil Pract 2001;18:292-9
- Gureje O, Von Korff M, Simon GE, et al. Persistent pain and well-being: a World Health Organization Study in Primary Care. JAMA 1998;280:147-51
- Argoff CE, Silvershein DI. A comparison of long- and short-acting opioids for the treatment of chronic noncancer pain: tailoring therapy to meet patient needs. Mayo Clin Proc 2009;84:602-12
- Kuehn BM. Opioid prescriptions soar: increase in legitimate use as well as abuse. JAMA 2007;297:249-51
- Express Scripts. A Nation in pain: focusing on U.S. opioid trends for treatment of short-term and longer-term pain. 2014
- Rice J, Samuelson T, Birnbaum H, et al. Characteristics and use patterns of chronic hydrocodone users. J Pain 2012;13:S80
- Danielson E. Health research data for the real world: The MarketScan® Databases. Truven Health Analytics, 2014
- Charlson ME, Charlson RE, Peterson JC, et al. The Charlson comorbidity index is adapted to predict costs of chronic disease in primary care patients. J Clin Epidemiol 2008;61:1234-40
- Graubard BI, Korn EL. Predictive margins with survey data. Biometrics 1999;55:652-9
- Bates DW, Saria S, Ohno-Machado L, et al. Big data in health care: using analytics to identify and manage high-risk and high-cost patients. Health Affairs 2014;33:1123-31
- Cicero TJ, Wong G, Tian Y, et al. Co-morbidity and utilization of medical services by pain patients receiving opioid medications: data from an insurance claims database. Pain 2009;144:20-7
- Leider HL, Dhaliwal J, Davis EJ, et al. Healthcare costs and nonadherence among chronic opioid users. Am J Manage Care 2011;17:32-40
- Gaskin DJ, Richard P. The economic costs of pain in the United States. J Pain Off J Am Pain Soc 2012;13:715-24
- Fitch K, Pyenson BS, Iwasaki K. Medical claim cost impact of improved diabetes control for medicare and commercially insured patients with type 2 diabetes. JMCP Oct 2013;19:609-20, 620a-620d
- IMS Institute for Healthcare Informatics. Essential health benefit packages explained: understanding high-cost patients. www.theimsinstitute.org. Accessed 2014
- Bron M, Guerin A, Latremouille-Viau D, et al. Distribution and drivers of costs in type 2 diabetes mellitus treated with oral hypoglycemic agents: a retrospective claims data analysis. J Med Econ 2014;17:646-57
Appendix A: Health Resource Utilization (HRU), by baseline days’ supply for IR hydrocodone
Number of HRU events during the 12-month follow-up period.
Any HRU event during the 12-month follow-up period.
ppendix B: Health Resource Utilization (HRU), by baseline average doses per month for IR hydrocodone
Number of HRU events during the 12-month follow-up period.
Any HRU event during the 12-month follow-up period.
Appendix C: Odds ratio of HRU event by baseline days’ supply or doses per month of IR hydrocodone