
Abstract
Objective:
To discuss the influences of economic factors on the treatment outcomes of cancer patients and the relaxation effects of medical insurance policies on the influences of economic factors.
Method:
The concentration index (CI) and horizontal inequality (HI) of treatment outcomes of cancer patients were calculated and the role of the economy, disease, and other factors to HI was analyzed by describing the influence of treatment expense on the treatment outcomes of different cancer patients.
Results:
The study showed that the equity of the death rate and the effective rate of six types of cancer patients was good. The HI of the cure rate was 0.225, indicating a strong, pro-rich inequity of the cancer inpatient cure rate, while the contribution of the economic factors to HI was 0.158. The uncured rate in the low-cost group represented the rate of patients who discontinued the treatment; the HI was −0.324, indicating a strong, pro-poor inequity. The relaxation effect on the HI of the cured rate by medical insurance was 14.9%, while the effect on the HI of the uncured rate was 18.7%.
Conclusion:
At present, medical insurance has demonstrated relaxation effects on the fairness of treatment outcomes to some extent. The main reason for this inequity comes from the payment of the items at present. To relieve such inequity to a greater extent, the payment system should be changed and diagnosis-related groups should be implemented.
Background
Health is a universal human aspiration and a basic human need. The poor, who frequently require more services, are often the least able to pay, while the wealthy disproportionately utilize more services, even though they have fewer needs. As an important outcome of the healthcare system, equity in health service utilization has attracted attention in China in recent yearsCitation1.
A common interpretation of equity in medical care delivery is that medical care is allocated on the basis of medical need rather than other factors, such as income, race, or area of residenceCitation2. For different groups of people, systematic differences in healthcare availability that are avoidable through reasonable action is unfair, and these differences are referred to as imbalanced health inequityCitation3,Citation4.
With improving levels of economic development and the impact of the ageing of the population, the disease spectrum in China has changed enormously, with infectious disease being more effectively controlled. According to the fourth national health services survey results, chronic diseases have become the primary problem affecting residents’ health. Among the many chronic diseases that affect residents’ health, cancer is a disaster for residents and their families—it not only affects residents’ health status seriously and reduces their quality-of-life, but also places a heavy burden on their families due to continuing medical expenses.
In 2005, the total economic burden of cancer patients in China totalled 86,849 billion Yuan, accounting for 7.3% of the total economic burden for all diseasesCitation5. However, the most unbearable burdens for cancer patients are the low cure and high fatality rates in addition to the enormous cost of treatment. Most people believe that the high cost of treatment offers better results because of the higher cost of newer medicines or advanced techniques, and those patients utilizing these new treatments see better results. In other words, this means that wealthy patients have a higher chance of survival than poor patients, given that the same type of cancer is diagnosed. This inequality is observed in patients without insurance or those with basic medical insurance that does not cover most new, expensive treatments.
All patients want the best medical treatment when they are diagnosed with any disease, but health insurance cannot satisfy this desire for economic reasons. Is it worth spending a large amount of money on a terminal cancer patient? People have the right to fight for their lives, but poor patients may be deprived of such rights. The equity in health service results for cancer patients is the main target of this study.
According to the fourth national health services survey results from 2008, 28.1% of people in China were not covered by basic medical insurance. Among those with medical insurance, 72.6% have urban employee basic medical insurance in which the insured are reimbursed for outpatient and emergency medical expenses by paying with a Medicare-like card, and 94.8% of hospitalized patients received only 66.2% reimbursement for their medical expenses. Additionally, 79.3% of people with urban resident basic medical insurance were reimbursed for one-third of their outpatient and emergency medical expenses, and inpatients received a total healthcare reimbursement of 49.2%. Among new residents of the rural co-operative medical care system (NCMS), 33.5% of outpatients are reimbursed or pay their medical expenses from family accounts, 65.6% of outpatients pay their medical expenses out of pocket, and 85.3% of hospitalized patients were reimbursed for their medical expenses, which only covered 34.6% of their total hospitalization expensesCitation6–8.
Currently, people in China are not completely covered when they receive treatment for cancer, and a significant amount of expenses are paid out of pocket. The low cure rate for cancer has been established; when the patients are not able to pay for their healthcare expenses, the cure rate is lower. Some people have to abandon treatment to save money for their families, even when they know that this means a zero chance of survival from cancer.
The main objective of this paper is to explore the impact of economic factors (the medical consumption ability) on the cure results of tumor inpatients, the relationship between economic factors and abandoning treatment rate for the cure result of tumor inpatients, the relationship between the economic level (the medical consumption ability) and cure results of tumor inpatients, and the influence of the economic level and medical needs on the cure results for tumor inpatients.
Materials and methods
Data
The data utilized in this study are from a hospital in western China, comprising the largest tertiary-level hospital in the Shanxi province of China. The information from the medical records homepage for all discharged patients from 2009–2011 is used to build a database to analyze the inequity of the health treatment results of cancer patients.
This paper only used the data generated from cancer inpatients (including those affected by benign tumors and pre-invasive carcinomas). We selected the inpatients from C00 to D36 by ICD10.0 to build the cancer inpatient database. Four categories of inpatient information were collected in the database: (1) general information and health status, (2) the disease and treatment, (3) the cure result, and (4) inpatient expenses and insurance compensation. A total of 50,886 cases were in the database after data cleaning, resulting in 44,289 patients with malignant tumors and 6522 patients with pre-invasive carcinomas.
Because all data were taken from the same hospital, the cure rate, death rate, effective rate, and uncured rate for the same disease are comparable.
Methods to measure health utilization inequality and inequity
Concentration index and horizontal inequity
The concentration index CI is employed in this paper to measure inequality in treatment results for tumor inpatients. The concentration index is becoming a standard tool for the measurement of income-related health inequalityCitation9. The concentration index is zero if there is no income-related inequality for health utilization. If the concentration index takes a positive (negative) value, a pro-rich (pro-poor) inequality is present in the inpatient utilization. The general formula for the concentration index defines this index in terms of the covariance between the health variable and the fractional rank in the income distributionCitation10:
(1)
where C is the concentration index; y is the inpatient cure result index; μ is the mean of the inpatient cure result index; and r is the fractional rank in the income distribution.
The method of decomposition of the concentration index is used to analyze the correlation between the contributions of the various determinants of utilization with the inequality in inpatient utilization and to calculate the horizontal inequity. A decomposition of the concentration index, proposed by Wagstaff et al.Citation11, is a straightforward way to decompose the measured degree of inequality into the contributions of various explanatory factors. According to this method, the concentration index of the inpatient cure result can be decomposed into contributions of determinants to the income-related inequality using the method of decomposition of the concentration indexCitation11. In keeping with previous studies, the inequality of the inpatient is decomposed into the following three components in this paperCitation12,Citation13: (1) the contribution of individual income; (2) the contribution of the disease impact variables; and (3) the contribution of the residual term, which identifies the degree to which the residual is correlated with the income rank. To decompose the inequality of inpatient utilization, a regression model is given by
(2)
where yi is the inpatient cure result; xm is the income; xn are the disease impact variables; xp are the other variables; βm, βn, and βm are coefficients; and ɛi is the implied error term, which includes approximation errors. The concentration index for y can then be written as:
(3)
where Ĉ is the concentration index of the inpatient utilization result and Ĉm, Ĉn, and Ĉp are the concentration indexes of xm, xn, and xp. The first term on the right side of equation (Equation3
(3) ) denotes the contribution of economic factors to inequality, the second denotes the contributions of the disease variables, the third denotes the contributions of the other variables and the last term is the generalized concentration index of ɛi. The horizontal inequity (HI) of inpatient utilization can be computed by subtracting the contribution of the disease variables from the concentration index of inpatient utilizationCitation11.
Regression models
Two non-linear regression models are employed to decompose the concentration index and to decompose the change in the concentration index. Because the distribution of the residual of treatment results is normal, probit regression models are used to analyze the influence of determinants on the probability of the inpatient cure result. The linear approximation to the non-linear model is then performed to estimate the marginal effects evaluated at the means in the process of decomposing the concentration indexCitation13.
Variables
Inpatient cure result
There are five types of results for hospital medical treatment: ‘Healed’, ‘Better’, ‘Fail to cure’, ‘Death’, and ‘Other’.
‘Healed’ means that the disease symptoms have totally vanished and the organ function of the patient is fully restored or sustained minor damage after treatment of the disease.
‘Better’ means that the symptoms of the disease have vanished but the organs were severely damaged in terms of functionality after treatment.
‘Fail to cure’ means that the disease was unaffected or became worse after treatment.
‘Other’ includes those who are discharged against the doctor's advice or have not finished treatment.
The indices we adopted to show the results of the medical treatment includes the following: Clinical Effective rate; Cure rate; Death rate; and Uncured rate.
Clinical Effective rate: We use the Clinical Effective rate to indicate a positive result of medical treatment, which refers to the percentage of ‘healed’ and ‘better’ for the evaluation of inpatient treatment. This index shows that some of the patients’ conditions have been suppressed and the symptoms have been greatly eased through medical treatment.
Cure rate: The Cure rate refers to the percentage of ‘healed’ patients in the evaluation of inpatient treatment. This index shows that inpatients were healed through medical intervention, which is the best expected result of medical treatment.
Uncured rate: Uncured rate refers to the percentage of ‘Fail to heal’ in the evaluation of inpatient treatment. We adopt this index to show the conditions in which the inpatients did not improve from medical treatment.
The medical standard on malignancy from the sample hospital is the highest in Western China, so we assume that there are no delays or missed treatments for malignancy patients because of low-level medical standards.
Clinical death rate: The Clinical death rate refers to the percentage of cases that result in the death of inpatients during hospitalization in the total case load. In this paper, we adopt this index to show the severity of the illness and negative results of patient treatment.
Independent variables
To be consistent with the method of decomposing the concentration index, independent variables in the regression model are classified into three groups: income, need, and other variables.
Economic factors are measured by the medical consumption expenditure. Consumption expenditure is used rather than self-reported income because income is more likely to be misreported, and consumption expenditure is a better proxy for the resources availableCitation14–16. This paper used the cost of treatment and cash outlays after the reimbursement to represent the medical consumption expenditure. Based on the FFS (Fee for Service) payment system that is used in the sample hospital, inpatients accept the treatment when they can afford the fees and skip treatment whenever they cannot afford them. The inpatients are reimbursed by their medical insurance after paying for inpatient treatment according to a certain scale.
This paper used the cost of treatment to represent medical expenditures for inpatients to study the inequity of the cure result for cancer inpatients, in which it is assumed that all inpatients without medical insurance are covered and that they use the cash outlays after reimbursement to represent income to study the changes of inequity from medical insurance. The contribution of income is defined as the product of the concentration index of the income.
The disease need factor is an elusive concept that has seen a variety of interpretations in relation to the definition of equity in healthcare deliveryCitation17. Here, need variables include sex, age, and disease status. Disease status mainly includes the seriousness of the illness, the type of tumor, and complications of the condition.
Other variables include inpatient days, health insurance schemes, and operation conditions.
Results
Descriptive analysis
We chose five main malignancies and carcinoids to explore the impact of the economic factors on the cure results, which includes lung cancer, breast cancer, esophageal cancer, stomach cancer, and hepatocellular carcinoma (HCC) ().
Table 1. Description of variable in Probit regression models.
Breast cancer has the highest cure rate (38.3%) and the lowest death rate (0.59%) among the five malignant tumor types and has the lowest risk among these five types of cancer. Lung cancer has the lowest cure rate (7.93%), while HCC has the lowest effective rate (79.69%) and the highest death rate (2.75%) and uncured rate (6.12%).
The inpatient expenses for stomach cancer are the highest among all other tumor types, and the expenses for lung cancer are the lowest, including those for carcinoid-related conditions.
Impact of economic factor on the cure result of tumor inpatients
Effective rate
In the view of the clinical effective rate of various diseases, the effective rate of benign tumors is not significantly higher than that of malignant tumors and is even lower than that of patients with breast cancer in the low-cost group. According to the clinical effective rate for various cancers in different cost groups, the clinical effective rate of cancers improved with cost increases, while the increase rates of various cancers were different. The effective rate improvement in HCC was the most significant, which increased from 56% in the 20% cost group to 90% in the 80% cost group. In addition, the effective rate of lung cancer also showed an increase in the different cost groups, but the increase was relatively smaller, from 79% to 91%, in the 20% cost group.
The clinical effective rate of breast cancer was the highest, and was even higher than that of benign tumors in the lowest cost group and the second-lowest cost group. Aside from the fact that the effective rate of the 20% group in the lowest cost group was lower than 80%, the clinical effective rate in the other groups stayed at a relatively high level of 95% without major fluctuations.
Out of the six diseases in this study, the effective rate in the 20% group with the lowest cost was much lower than that in the other groups, which was 10–30% lower than the average effective rate. This trend was consistent with the performance for the five malignancies and one benign tumor. Therefore, the clinical effective rate cannot be ensured when the hospitalization expenses are lower than a certain level. However, when the cost is above 40%, the performance of the clinical effective rate is stable with a small, increasing range.
Among the different diseases, the effective rate of the HCC was the lowest among all malignant tumors and had the lowest cost in all the cost groups. The cure rate of lung cancer in the low-cost group was higher than that of esophagus cancer and gastric cancer. With the cost increase, however, the effective rates of esophagus cancer and gastric cancer all exceeded that of lung cancer.
Cure rate
In the view of cure rates of all diseases, the cure rate for benign tumors was far beyond that of malignancies, and the cure rate remained at 90% when the cost was above the level of the 60% group. The cure rates of the five malignancies all showed improvement with the increase of treatment costs. The cure rates of the five malignancies in the 20% group with the lowest self-payment were all concentrated in the 4–14% range, but without a large difference. However, the cure rates in the 20% group with the highest costs showed a significant difference. The cure rates of breast cancer (63.8%) and gastric cancer (65.5%) were all higher than 60%, while the cure rate of lung cancer was relatively low, at only 18% ().
Figure 1. Cure rate of different tumors in different expense groups.
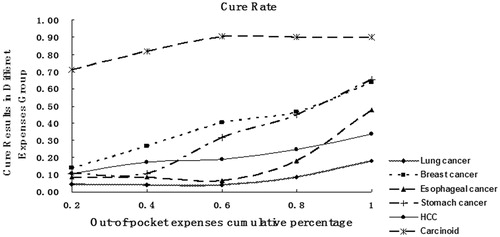
The cure rate of lung cancer was the lowest among the five cancers with a small increase with cost. The cure rates in groups with the lowest, second-lowest, and mid-range costs were all ∼4% without significant changes. The cure rate in the group with second-highest cost improved once to 8%, while improvement in the highest group was up to 18%. The hospitalization cost of lung cancer was certainly the lowest among these five cancers, which may be because this hospital adopted traditional treatment measures for lung cancer. These traditional treatments may have caused the cure rate to be relatively low, in addition to the corresponding treatment cost.
The effective rate of liver cancer was the lowest while the cure rates in all groups were not as low. The cure rates of HCC in groups with the lowest and second-lowest costs were on par with that of breast cancer and higher than those of the other three cancers. With the cost increases, the cure rates of gastric carcinoma and esophageal cancer improved rapidly and became higher than that of HCC. However, the cure rate of HCC in the group with the highest costs was up to 33.6%, which increased by 314% compared with 10.6% of the cure rate in the group with the lowest cost.
The cure rate of gastric carcinoma improved the most significantly with the cost increase. The cure rate in the group with the highest cost increased by 606.54% compared with that in the group with the lowest cost.
It seems that the higher-cost group is associated with improved outcomes in the five main cancers, while the carcinoids show little difference in that the cure rate remained at a certain level and did not improve when costs increased more than the mid-range level. The carcinoid outcomes show that the cost will not always impact the outcomes when the cost is high enough to allow most inpatients to be cured. The result does not try to prove that the relation between cost and improved outcomes is positively related, but shows that, if the costs do not reach a certain level, even cancers that can be cured will not be cured. The treatment of cancer is very complex and requires the latest medical technology, and this treatment cost will become a barrier that prevents poor inpatients from being cured.
Death rate
The clinical death rates of five malignancies and the benign tumor demonstrated different trends without any increases or decreases in cost when comparing the different cost groups of several diseases. The death rate for the benign tumor was much lower than that of malignancies. The death rate of breast cancer was the lowest among these five cancers, while the death rate of HCC was the highest in all the cost groups. These data showed that the death rate will not decrease with a cost increase. Critical conditions and even death were observed in all cost groups.
Data from these 3 years showed that the death rate of hospitalized patients with malignancies neither decreased upon an increase in the hospitalization cost nor improved upon a decrease in hospitalization cost. The trends of the different diseases were significantly different. For example, the death rates of lung cancer in the groups with the lowest cost and the highest cost all increased, the death rate of gastric carcinoma in the middle-cost group on the lower side increased, and the death rates of lung cancer and breast cancer in all groups were even.
Uncured rate
As a negative index of treatment outcomes, the uncured rates of all diseases reduced with the cost increase, and the uncured rates of all diseases in the group with the lowest cost were much higher than that in the other groups. According to the different trends in the death rate and uncured rate, we found that the uncured outcome in patients may not be caused by the complexity and severity of the illness but by patients actively abandoning treatment when they are faced with the enormous medical expenses for treatment coupled with an uncertain treatment outcome ().
Figure 2. Uncured rate of different tumors in different expense groups.
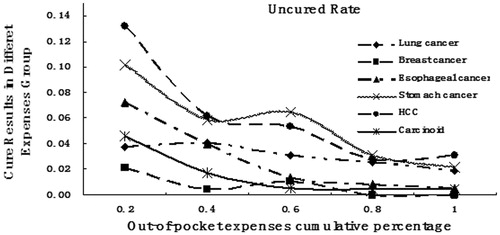
If the uncured rate in the low-cost group was treated as the rate of patients abandoning treatment, the result can be explained. Patients consistently abandoned treatment at the beginning when the cost was relatively low. Therefore, the uncured rate in the group with the lowest costs was much higher than that in other groups.
With the progression of treatment, some patients also abandoned treatment for economic reasons. However, fewer people gave up treatment as the costs of the group increased. As a result, the uncured rate also reduced with cost increases. Although there were uncured cases in the group with the highest cost, the proportion was much lower than that of other groups, which was almost close to the death rate.
Discussion
Analysis on the equity of treatment outcome
It is believed that all patients with malignancies will use all their income for treatment if there is a chance for a cure. Therefore, self-payment and hospitalization costs were assumed to be the measure of the income situation of the residents, respectively. It was found that the effective rate fairness of the malignancies was good by using the fairness study with the treatment outcome of malignancies. The death rate did not show unfairness caused by different incomes, while the cure rate and uncured rate showed unfairness to some extent ().
Table 2. Concentration index and horizontal inequity index in treatment result.
It was found that the high uncured rate in the low-income group actually referred to the rate at which medical treatment was abandoned. Because its value was negative, which meant that the inequity of the uncured rate was pro-poor, the concentration index and horizontal inequality of the uncured rate was calculated. In fact, if the uncured situation was caused by a complex or extremely severe disease, the costs should be higher than the general hospitalization cost. However, the result in the data analysis showed that the uncured rate in the low-cost group was much higher, which was identical to the behavior of giving treatment. In other words, many people who received healthcare abandoned treatment in the early treatment stage. Thus, any person suffering from cancer may give up his or her life by abandoning treatment.
The concentration index was decomposed by fitting the probit model. As the variables were divided into four groups—economic factors, demand factors, other factors, and residual—the contribution of each group was generated by adding up the contributions of variables within each group (). If there was equity, the expenditure factor should be zero or should demonstrate an impact in the same direction as the demand factor.
Table 3. Decomposition of inequality in cure rate and uncured rate.
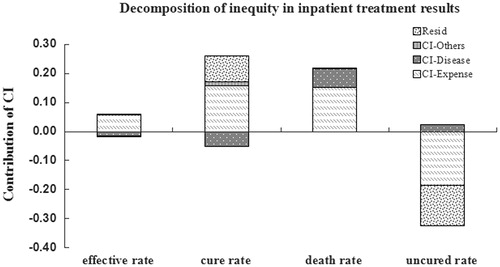
The contributions of the demand factor and economic factor had homodromous effects in the result of the death rate, and it shows that there is no inequity in the death rate of tumor inpatients. While the economic factor and demand factor had shown previous action in the other results of the effective rate, cure rate, and uncured rate, economic factors made the greatest contribution to the inequality of treatment results ().
Figure 3. Decomposition of inequity in inpatient treatment results.
The research results show that economic factors were the main factor in the contribution to concentration index. There was a strong pro-rich inequity in the inpatient cure rate (HI = 0.2251) in the under-developed western region, which means that, as the costs paid by the patient increased, the cure rate increased. There was a strong pro-poor inequity for the inpatient uncured rate (HI = −03236), which means that, as the costs paid by the patient decreased, the uncured rate increased (abandoned treatment). This also means that, as the treatment expenditures paid by the inpatients increased, the cure rate increased while the uncured rate decreased, despite the fact these patients had a more serious health status.
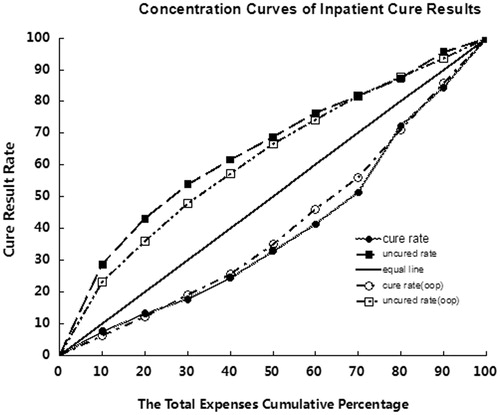
Medical insurance compensation has relaxation effects on inequity to some extent, but the effect is not significant. The horizontal inequality of the cure rate was reduced by 14.9% and the horizontal inequality of the uncured rate was reduced by 18.7%, while the compensation portion of the medical insurance can be more than 30%. However, the decrease of the inequity was much lower than the proportion of medical insurance ().
Figure 4. Concentration curves of inpatient cure results.
The factor that has the greatest effect on the concentration index of cure rate is still economic factors by medical insurance compensation. In other words, for patients suffering from the same disease, the population that cannot afford the high level of expenses has no choice, but death if the increased cost means a higher cure rate. Although the medical insurance compensation has large relaxation effects on the effective rate, it still cannot effectively reduce the horizontal inequality of the cure rate. It can also be said that patients who cannot afford the high level of expenses cannot enjoy a higher cure rate through medical insurance compensation.
Influences of medical insurance compensation on therapeutic outcome
In view of the medical insurance compensation proportion for the five malignancies and the benign tumor, the compensation proportions of these diseases are all in the 30–35% range without significant differences. Moreover, the lower the self-payment is, the larger the compensation proportion will be. The compensation proportions in all groups with the highest self-payment were all less than 20% (). This also complies with the current medical insurance policy in China; as the cost increases, reimbursement decreases. In addition, there is a cap limit and restriction on the drugs reimbursed. On the one hand, in groups with the highest cost, imported drugs with good curative effects and high prices or new therapeutic measures with high prices are always chosen. However, all of these drugs and therapeutic measures are out of the scope of medical insurance, so medical insurance cannot compensate to decrease the cost to the patient. On the other hand, it is these therapeutic measures and drugs that greatly improve the cure rate in groups with the highest costs.
Table 4. Insurance compensation ratio in different expense group.
Therefore, there is a great paradox. Medical insurance exists to reduce the huge expense burden that is produced in the therapeutic process, but people have to accept the reduction of the medical insurance compensation proportion when pursuing treatment with a high cure rate. Although the medical insurance offers low compensation, people with high economic incomes will still choose a therapeutic plan without medical insurance compensation to pursue a higher cure rate. However, many people with mid-range incomes have to sacrifice the cure rate to reduce economic loss by obtaining medical insurance compensation. It is a cruel reality in which the reduction of economic loss and the improvement of the cure rate have become two contradictory options when facing malignancies with high fatality rates and malignancies that are significantly difficult to cure.
Catastrophic health expenditure refers to the household health expenditure (Out-of-pocket Payment, OOP) proportion of household non-food expenditure that exceeds a certain defined standard, which is generally set at 40%. In this research, we found that the average cost of hospitalization for cancer patients is 12,713 RMB, and cancer is much more likely to cause catastrophic health expenditures than any other disease. The OOP of inpatients covered by Urban Employee Basic Medical Insurance (UEBMI) is 4690 RMB. The incidence of catastrophic expenditure for inpatients covered by UEBMI is 37.21%. Although the catastrophic expenditure incidence for UEBMI patients was much higher than the common level (less than 20%), it is the lowest among three types of medical insurance, which is the reason why the concentration index for the uncured rate for UEBMI is better than the alternative. The incident of catastrophic expenditure for inpatients covered by the New Rural Cooperative Medical Scheme (NCMS) is 82%, which is as high as inpatients uncovered by medical insurance, so the concentration index of the uncured rate (abandon treatment rate) for those inpatients is also high ().
Table 5. The OOP and incidence of catastrophic expenditure of the difference coverage of various insurance.
Although the patients who had catastrophic health expenditures obtained nearly 30% reimbursement from medical insurance, they still cannot afford the treatment cost. They abandoned treatment or left the hospital against doctors’ advice, even though they knew they would remain uncured. Thus, medical insurance did not effectively protect low-income patients who had no opportunity to choose relatively cheaper medicines and therapeutic measures. Such a treatment plan also required patients to pay more than 40% of the cost, so many patients chose to abandon treatment for conditions in which the cure rate could not be guaranteed.
A medical insurance policy has the original intention of reducing medical expenses and ensuring medical service to residents. However, this policy cannot ensure that patients with low income receive complete and basic treatment at a low price and reduce the rate of treatment abandonment when facing chronic diseases with high treatment costs and low cure rates. In addition, patients with middle and high income have to pay out-of-pocket for drugs and therapeutic plans without medical insurance compensation because they believe that the insurance companies will provide any compensation for their treatment.
The key is the payment method of medical insurance
China took a giant step in reforming its health sector in 2009. Remarkable increases in insurance coverage and inpatient reimbursement were accompanied by increased use and coverage of healthcare. Important advances have been made in ensuring equal access to services and insurance coverage across and within regions. However, these increases have not been accompanied by reductions in catastrophic health expensesCitation18,Citation19. The unit cost of in-patient chemotherapy on average was quite high for a developing country compared to per capita income of the common personCitation20,Citation21.
To improve the cure rate of cancers, drugs should be developed, medical technology should be updated, and doctors should continue to perform research and studies, all of which mean higher costs. Without greater repayment, no hospital is willing to provide new technology, and no doctor can continue to research and develop new therapeutic plans. Therefore, higher costs will bring higher cure rates, and patients have to pay more when pursuing higher cure rates. These are the rules of the market.
Medical insurance cannot ensure coverage without limits. However, how can we ensure that fewer low-income patients abandon treatment and enjoy a higher cure rate? The best way to solve this problem may be changing the payment system at present.
Patients cannot predict the total cost at the beginning of hospitalization in a FFS payment system, especially poor patients who abandon treatment early because they cannot estimate the total cost. If the payment and medical insurance compensation can be addressed according to the diagnosis, the severity and the treatment way of disease (DRGs), patients can predict the amount they will need to pay and the medical insurance they will need to obtain in advance. Therefore, the possibility of abandoning treatment at an early stage due to the lack of capability of cost prediction can be largely decreased.
In addition, with an FFS payment system, patients can choose to pay higher costs and obtain drugs and therapeutic plans with better curative effects according to their income situation. However, patients suffering from the same disease may have differences in cure rate because of the income gap with two completely different outcomes. With the DRGs system, doctors can choose the most suitable therapeutic method according to the illness state of the patient, and the medical quality of the hospital can be evaluated according to the cure rate. Therefore, patients at different income levels can have the same chance of being cured, and some unnecessary medical cost can be reduced.
Conclusion
At present, medical insurance has relaxation effects on the inequity of therapeutic outcomes to some extent, with limitations. The main reason for such inequity is the FFS payment system implemented at present. Patients can abandon or continue treatment at any time. To alleviate the inequity, the payment system should be changed, and DRGs should be an option. Therefore, the rate of patients abandoning treatment can be effectively reduced, and the influence of economic factors on the treatment outcome of tumor patients can be reduced by a uniform charge for the same disease.
Transparency
Declaration of funding
No funding was declared for this manuscript.
Declaration of financial/other relationships
The authors were supported by CMB health policy research project on the reform of the payment system of healthcare in the Shanxi province of China study, 2009, and Shaanxi provincial science and technology department of soft science research project number 2014KRM99-01. JME peer reviewers on this manuscript have no relevant financial or other relationships to disclose.
Acknowledgement
The authors would like to thank China Medical Board of New York Inc (CMB) for financial support; this work was also supported by Shannxi government (serial number: 2014KRM99-01).
References
- Marmot M. Achieving Health equity: from root causes to fair outcomes. Lancet 2007;370:1153-63
- Wagstaff A, Van Doorslaer E. Measuring and testing for inequity in the delivery of health care. J Hum Resour 2000;35:716-33
- Van Doorslaer E, Koolmana X, Jones AM. Explaining income-related inequalities in doctor utilization in Europe. Health Econ 2004;13:629-47
- Settumba SN, Sweeney S, Seeley J, et al. The health system burden of chronic disease care: an estimation of provider costs of selected chronic diseases in Uganda. Trop Med Int Health 2015;20:781-90
- Fang P, Dong S, Xiao J, et al. Regional inequality in health and its determinants: evidence from China. Health Policy 2010;94:14-25
- Wang X, Zheng A, He X, et al. Integration of rural and urban healthcare insurance schemes in China: an empirical research. BMC Health Serv Res 2014;14:142
- National Bureau of Statistics of China. Statistical Bulletin of National Economy and Social Development in 2009
- Center for Health Statistics and Information of MOH. An analysis report of National Health Services Survey in 2008. Bejing: Xie He Medical University Press, 2009
- Wagstaff A, van Doorslaer E, Paci P. On the measurement of horizontal inequity in the delivery of health care. J Health Econ 1991;10:169-205
- Clarke P, Van Ourti T. Calculating the concentration index when income is grouped. J Health Econ 2010;29:151-7
- Wagstaff A, van Doorslaer E, Watanabe N. On decomposing the causes of health sector inequalities, with an application to malnutrition inequalities in Vietnam. J Econometrics 2003;112:219-27
- Wagstaff A, Paci P, van Doorslaer E. On the measurement of inequalities in health. Soc Sci Med 1991;33:545-57
- Wagstaff A, Van Doorslaer E. Measuring and testing for inequity in the delivery of health care. J Hum Resour 2000;35:716-33
- Wang H, Zhang L, Hsiao W. Ill health and its potential influence on household consumptions in rural China. Health Policy 2006;78:167-77
- Zhou Z, Gao J. Measuring the equity of inpatient utilization in Chinese rural areas. BMC Health Serv Res 2011;11:201
- Meyer BD, Sullivan JX. Measuring the well-being of the poor using income and consumption. J Hum Resour 2003;v38:1180-220
- Culyer AJ. Need: the idea won't do–but we still need it. Soc Sci Med 1995;40:727-30
- Yip W, Hsiao W. Harnessing the privatisation of China’s fragmented health-care delivery. Lancet 2014;384:805-18
- Meng Q, Xu L, Zhang Y, et al. Trends in access to health services and financial protection in China between 2003 and 2011: across-sectional study. Lancet 2012;379:805-14
- Richard G. Effects of health insuranceand race on early detection of cancer. Socioeconomic status. J Natl Cancer Inst 1999;91:1409-15
- Wani MA, Tabish SA, Jan FA, et al. Cost analysis of in-patient cancer chemotherapy at a tertiary care hospital. J Cancer Res Ther 2013;9:397-401