Abstract
Objectives. The Sami people constitute an ethnic minority in northern Norway. The objectives of this study were to compare municipalities with a majority of Sami in the population and a control group with regard to socioeconomic factors and health outcome.
Methods. Original data from Statistics Norway and Directorate of health on socioeconomic factors (education, unemployment, disability, poverty) and health outcomes [total mortality, cancer specific mortality, cardiovascular disease (CVD) specific mortality] were imported from the “Health Atlas” at the Northern Norway Regional Health Authority (NNRHA) trust. The 8 municipalities in the administration area of the Sami language law (Sami-majority group – 18,868 inhabitants) was compared with a control group consisting of 11 municipalities where the Sami constitute a small minority in the population (18,931 inhabitants). Most data were from 2005 and 2008.
Results. There was no significant difference in socioeconomic factors. Overall, cancer- and CVD-specific mortality rates were similar in both groups. The life expectancy was significantly longer among women in the Sami-majority area (81.3 vs. 79.5 years, p=0.035) and males (74.5 vs. 72.0 years, p=0.037).
Conclusion. Socioeconomic factors and cause-specific mortality rate were similar in the Sami-majority group and the control group. Residents of both sexes in Sami-majority areas enjoyed longer life expectancy.
The Sami people are the indigenous ethnic group of northern Scandinavia and the Kola Peninsula. The Norwegian government has ratified them as the indigenous people in Norway Citation1. The size of the present Sami population in the Scandinavian countries is not well known. Different estimates suggest the total population to consist about 110,000 people Citation2. The Norwegian Sami population is the largest, followed by the Swedish, the Finnish and the Russian. The majority of the Sami people in Norway live in the 3 northern counties (Finnmark, Troms and Nordland), and the Sami Parliament is located in Finnmark. The size of the Sami population in Norway has been reckoned to be approximately 75–100,000, but estimates vary in accordance with the criteria employed such as genetic heritage, mother tongue and sense of belonging to the Sami Citation3. Although the Sami in Norway are protected by a Sami Act, they have a different indigenous language and culture that may cause threshold, counter, queue and cultural challenges when assessing the public health care Citation4. Due to this fact, several national reports have put the Sami healthcare into focus Citation4–Citation6. However, it has been difficult to clarify whether they experience a health status of superior or inferior quality than other people in Norway due to lack of ethnic markers in national population records and censuses.
Socioeconomic factors as level of education, income and disability may influence on life expectancy Citation7–Citation10. The objectives of this study were to compare the Sami-speaking municipalities and a control group with regard to: (a) distribution of socioeconomic factors, (b) analyse life expectancy and mortality and (c) explore the major causes of death (cardiovascular disease and cancer).
Materials and methods
The Northern Norway Regional Health Authority (NNRHA) trust introduced in 2011 a regional “Health Atlas” (www.helse-nord.no/helseatlas/category27764.html) showing socioeconomic and health data for all 88 municipalities within northern Norway. The data implemented were socioeconomic and health variables mostly from 2005 to 2008. An overview of variables included in the survey, their sources and time periods are shown in . Although gender-specific data were available on community level with regard to disability, life expectancy, total mortality, cardiovascular disease (CVD)-related mortality and cancer-specific mortality, such data (gender specific) were not available for the other variables.
Table I. The variables implemented in the analysis and their source
Although 40 Norwegian municipalities have Sami residents, 8 main municipalities have been included in the administration area of the Sami language law. The latter were selected as the Sami-majority group of municipalities in this study. They had in 2009 a total number of 18,868 inhabitants and are located in the rural inland areas. The coastal municipalities of northern Norway have generally few Sami people and 11 of them were chosen as the control group of municipalities. They had in total 18,931 inhabitants and were selected based on rural location, distance to hospital and a similar population in size, ratio between gender and age as the Sami-speaking municipalities. The difference in share of Sami between the 2 groups has been shown to be substantial by a Gallup poll conducted in October 2000. In this poll people of Finnmark County were asked if they could speak Sami [a frequently employed criterion for Sami Citation3] and 5 municipalities from the Sami-majority group and 8 from our control group were included. Sami speakers constitute 71% in the Sami-majority municipalities, but only 6% in the control group of municipalities. Based on this fact, several studies have employed the administration area of the Sami language law as a marker of a population with a Sami majority Citation3 Citation11–Citation14.
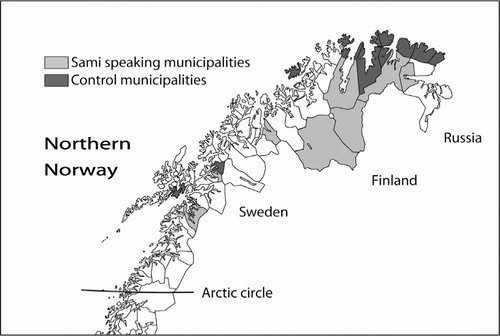
The locations of all municipalities in both groups are shown in . The female/male ratio was 0.94 and 0.95 in the Sami-majority and the control group, respectively. The percentage, aged at least 67 years, was 16.2 and 17.1% and 80 years or more 5.1 and 5.2%, respectively. None of the municipalities had any hospital or hospital unit. The names of the Sami-speaking municipalities were (with their Norwegian names in parentheses): Deatnu (Tana), Unjárga (Nesseby), Porsanger/Porsángu (Porsanki), Kárásjohka (Karasjok), Guovdageaidnu (Kautokeino), Gáivuotna (Kåfjord), Ástávuona (Lavangen) and Divtasvuona (Tysfjord). The municipalities included in the control group were: Lødingen, Bjarkøy, Lebesby, Gamvik, Måsøy, Salangen, Båtsfjord, Berlevåg, Nordkapp, Hasvik and Vardø. Despite that both Vardø and Honningsvåg (in Nordkapp municipality) are registered as Norwegian towns, we argue that the number of inhabitants (about 2000 in each town) and their location support their classification as rural areas.
Fig. 1. Map of northern Norway and the Sami- and non-Sami-speaking municipalities.
Statistical analysis and authorization
No individual patient data were analysed. Anonymous and aggregated data for each municipality were imported from the “Health Atlas” to the study database (www.helse-nord.no/helseatlas/category27764.html). As mentioned, the “Health Atlas” had implemented data from Statistics Norway and Directorate of Health. The latter runs the Norwegian Patient Registry (NPR) data base. The Microsoft Excel 2007 version was employed for the final database, calculations and statistical analysis. Descriptive statistics and the t-test were used for the comparison between groups. Significance was set to 5%. The t-test was carried out 2-sided. The study was performed as a “quality of care analysis”. We had, as mentioned, no access to any individual patient data and consequently no approval from the Regional Committees for Medical and Health Research Ethics (REK) was necessary. Similarly, no approval from the Norwegian Social Science Data Services (NSD) was requested.
Results
None of the socioeconomic factors analysed (level of education, drop-outs from high-school, unemployment, disability, poverty) showed any significant differences between the 2 study groups. Looking at gender, the percentage receiving disability pension was lower in the control group (12.8 vs. 10.8%), but the difference did not reach statistical significance (p=0.065). Variations within each group were notable, especially with regard to unemployment and drop out from high school. Details are shown in .
Table II. How the variables differed between the 2 groups (Sami-majority and control group)
Life expectancy was higher in the Sami-majority group than in the control group, for both women (81.3 vs. 79.5 years, p=0.035) and men (74.5 vs. 72.0 years, p=0.037). Furthermore, the overall (p=0.110), cancer- (p=0.335 and p=0.0481) and CVD-specific mortality rate (p=0.213 and p=0.312) was similar in the 2 groups, respectively. Furthermore, females aged 0–74 years in the Sami-majority group experienced a significantly lower mortality rate (p=0.012). It was notable that the Sami-majority group experienced lower mortality figures in all analyses performed. Details are shown in .
Table III. The mortality rates and life expectancy figures in the Sami and the control groups. Mortality rates are annual numbers per 100,000 inhabitants. The figures were adjusted for age and gender differences
Discussions
In this study we have documented that socioeconomic factors known to influence on life expectancy did not differ between municipalities with a Sami majority population and the control group. The total, cancer- and CVD-specific mortality did not differ between the 2 groups. However, women in the Sami-majority areas aged 0–74 years experienced a significant lower total mortality rate. Furthermore, life expectancy was significantly longer in the Sami-majority group.
Although we showed superior life expectancy in the Sami-majority group, other investigators studying indigenous ethnic groups have observed opposite conclusions. Tjepkema and colleagues Citation10 employed the 1991–2001 Canadian census mortality follow-up study and compared 16,300 Aboriginal and 2,062,799 non-Aboriginal persons residing an urban area in 1991. The life expectancy at age 25 years was 4.7 and 6.5 years shorter for urban Aboriginal men and women, respectively. Alcohol-related deaths, motor vehicle accidents and infections were the culprits causing shortened life expectancy. Breast cancer-specific mortality rate was, however, lower among Aboriginal women. They suggested socioeconomic factors as community size, lone parenthood, educational attainment, income adequacy, occupation skill level, work status and immigration could explain 63% (for men) and 32% (for women) of the differences in hazard ratio. Similar findings have been observed for Registered Indians residing in Winnipeg, Vancouver and Canada as a whole Citation15–Citation17. For Status Indians, life expectancy at birth has been reported 8 years less for men and 7 years less for women Citation18.
Although Canadian Aboriginal people have a shortened life expectancy, this does not seem to be the fact among the Sami today. Per Sjölander Citation2, published recently, a health-related research on Sami cohorts published in scientific journals and anthologies and concluded similarly as our findings. He compared the health condition among the Sami and the majority non-Sami population. Relevant data from the Sami populations in Swedish were compared with corresponding data from Norwegian and Finnish Sami populations. The conclusion was that life expectancy and mortality patterns of the Sami are similar to those of the majority population. Furthermore, he reported that Sami lifestyle seems to contain elements that reduce the risk of developing cancer and CVDs, e.g. physical activity, diet rich in antioxidants and unsaturated fatty acids, and a strong cultural identity. The fact that the Sami-majority group in our study showed better absolute figures with regard to cancer and CVD mortality rate could support this statement. In a prior study in cooperation with the Cancer Registry of Norway (CRN) we documented a significantly lower incidence of cancer in the Sami-majority municipalities Citation3. Especially, breast and lung cancers were less common. This could partly explain the improved total mortality rate among females aged 0–74 years, as breast and lung cancers are common diseases among women aged 50–75 years.
One reason for the superiority of the Sami-majority areas in our study may be due to the fact that the comparator was not Norway in general, but remotely located communities within the same region. The national Norwegian median life expectancy figure (1995–2009) was 77 years among males and 82 years among females, respectively, better than the figures for the Sami-majority areas as found in our study.
Improved socioeconomic status is probably the main cause of good health outcome in the Sami-majority group. Low income seems to be a more powerful risk factor for mortality than low education Citation2. A recent study Citation9 comparing Denmark and USA strongly indicated poverty of even greater importance in Scandinavia than in North America. The poorest 10 percent of the Danish population had a mortality rate ratio of 3.32 (men) and 3.70 (women) compared to the richest 25 percent. The corresponding ratios in USA were 1.67 and 1.56. Similar findings have also been shown among Koreans Citation8. Focusing Sami and non-Sami it has been shown that the increase in income has been similar in both groups between 1970 and 2000 Citation2 Citation19. Non-reindeer-herding Sami, both men and women, now appear to have approximately the same level of education as other Swedes in the same geographic setting Citation2. This is in accordance with our findings of no difference in primary school alone and drop outs from high school between groups. Looking at risk factors potentially affecting life expectancy, the tobacco and alcohol habits appear to be roughly the same among the Sami and non-Sami Swedes Citation2 Citation19.
We did not analyse other causes of death than cancer and CVD. Other investigators have been concerned about a raised risk of suicide among Sami men Citation2 Citation20 Citation21.
Reindeer herding is an important cultural activity among the Sami and is associated with high risks for accidents. This was also commented as a significant factor among Aboriginals in Canada Citation10. We had no access to data on accidents or suicide in the 2 study groups. As new upcoming registries may offer data on vehicle accidents, this should be further elucidated.
Conclusion
Socioeconomic factors and mortality rate were similar in both groups. Except for lower total mortality among females aged 0–74 years in the Sami-majority group, there were no significant differences in total, cancer- and cardiovascular-specific mortality rate.
Conflict of interest and funding
The study was funded by the Northern Norway Regional Health Authority.
Acknowledgements
The authors wish to thank Aina Olsen at the NNRHA trust for useful suggestions and Finn Henry Hansen at the NNRHA trust for making the “Health Atlas” available to us.
References
- International Labour Organisation (ILO). C169 – Indigenous and tribal peoples convention, 1989 (No. 169). Convention concerning aboriginal populations and tribal people in independent nations. Geneva: International Labour Organisation (ILO). ; 1989. [cited 2011 Jan 19]. Available from: http://www.ilo.org/ilolex/cgi-lex/convde.pl?C169..
- Sjölander P. What is known about the health and living conditions of the indigenous people of northern Scandinavia, the Sami?. Glob Health Action. 2011;4. doi: 10.3402/ijch.v71i0.19127.
- Norum J, Olsen A, Småstuen M, Nieder C, Broderstad AR. Health consumption in Sami-speaking municipalities with regard to cancer and radiotherapy. Int J Circumpolar Health. 2011; 70: 319–28.
- Haldorsen T, Tynes T. Cancer in the Sámi population of North-Norway 1970–97. Eur J Cancer Prev. 2005; 14: 63–8. 10.3402/ijch.v71i0.19127.
- Nystad T, Melhus M, Lund E. The monolingual Sámi population is less satisfied with the primary health care. Tidsskr Nor Laegeforen. 2006;126:738–40. [in Norwegian].
- Department of Health. The Northern Norway Regional Health Authority's mission document 2012. Oslo: Department of Health, departments’ service centre. 2012. pp. 1–29.
- Elgar FJ. Income inequality, trust, and population health in 33 countries. Am J Public Health. 2010; 100: 2311–15. 10.3402/ijch.v71i0.19127.
- Khang YH, Yang S, Cho HJ, Jung-Choi K, Yun SC. Decomposition of socio-economic differences in life expectancy at birth by age and cause of death among 4 million South Korean public servants and their dependents. Int J Epidemiol. 2010; 39: 1656–66. 10.3402/ijch.v71i0.19127.
- Hoffmann R. Socioeconomic inequalities in old-age mortality: a comparison of Denmark and the USA. Soc Sci Med. 2011; 72: 1986–92. 10.3402/ijch.v71i0.19127.
- Tjepkema M, Wilkins R, Senécal S, Guimond E, Penney C. Mortality of urban aboriginal adults in Canada, 1991–2001. Prev Chronic Dis. 2011; 8: A06.
- Norum J, Nieder C. Sami-speaking municipalities and a control group's access to somatic specialized health care (SHC). A retrospective study on general practitioners’ referrals. Int J Circumpolar Health. 2012;71:17346. doi: 10.3402/ijch.v71i0.19127.
- Norum J, Hofvind S, Nieder C, Schnell EA, Broderstad AR. Mammographic screening in Sami speaking municipalities and a control group. Are early outcome measures influenced by ethnicity?. Int J Circumpolar Health. 2012;71:1–6. doi: 10.3402/ijch.v71i0.19127.
- Norum J, Berke FE, Nybrodahl I, Olsen A. Admission and stay in psychiatric hospitals in northern Norway among Sami and a control group. A registry-based study. Nord J Psychiatry. 2012. [Epub ahead of print].
- Størmer J, Norum J, Olsen LR, Eldevik P, Broderstad AR. Health consumption in Sami speaking municipalities and a control group with regard to medical imaging. Int J Circumpolar Health. 2012;71:17620. doi: 10.3402/ijch.v71i0.19127.
- Indian and Northern Affairs of Canada. Basic departmental data, 2004. Ottawa: Minister of Indian Affairs and Northern Development. 2005. Catalogue no.: R12-7/2003E. p. 1–136.
- Martens PJ, Sanderson D, Jebamani LS. Mortality comparisons of First Nations to all other Manitobans: a provincial population-based look at health-inequalities by region and gender. Can J Public Health. 2005; 96(Suppl 1): S33–8.
- British Columbia Provincial Health Officer. Pathways to health and healing: 2nd report on the health and well-being of aboriginal people in British Columbia. Provincial Health Officer's Annual Report 2007. Victoria: Ministry of Health Living and Sport. 2009. p. 1–348.
- Tjepkema M, Wilkins R, Pennock J, Goedhuis N. Potential years of life lost at ages 25 to 74 among status Indians, 1991 to 2001. Health Rep. Statistics Canada, Catalogue no. 82-003-XPE. . 2011;22:25–36.
- Nilsson L, Dahlgren L, Johansson I, Brustad M, Sjölander P, Van Gulpen B. Diet and lifestyle of the Sami of southern Lapland in the 1930s–1950s and today. Int J Circumpolar Health. 2011; 70: 301–18.
- Soininen L, Pukkala E. Mortality of the Sami in northern Finland 1979–2005. Int J Circumpolar Health. 2008; 67: 43–55.
- Silviken A, Haldorsen T, Kvernmo S. Suicide among indigenous Sami in Arctic Norway, 1970–1998. Eur J Epidemiol. 2006; 21: 707–13. 10.3402/ijch.v71i0.19127.