
Abstract
Aging is associated with the loss of facial subcutaneous fat and with increased abdominal subcutaneous fat. Site specific differences in adipocyte phenotype and/or gene expression may play a role in these age-related changes. In this study, we isolated and characterized human facial preadipocytes and investigated distinct metabolic properties such as a differentiation pattern in relation to abdominal preadipocytes. Subcutaneous preadipocytes were isolated from human facial and abdominal skin and cultured in the presence of differentiation factors including rosiglitazone, a known peroxisome proliferator-activated receptor gamma (PPAR-γ) agonist, isobutyl-methyl xanthine (IBMX) and insulin. Differentiation was characterized microscopically and by quantitative real-time PCR. Unexpected superior adipogenic capacity of facial preadipocytes was observed; more facial preadipocytes differentiated in response to rosiglitazone than abdominal preadipocytes and facial preadipocytes retained their ability to differentiate through passage 11 compared with passage 5 for abdominal preadipocytes. Experiments confirmed a reduced lipolysis response in facial versus abdominal adipocytes after exposure to isoproterenol, which was consistent with the reduced β2-adrenergic receptor expression by 60% in the facial cells. The expression of other lipid metabolic gene markers was similar in both facial and abdominal adipocytes with the exception of β3-adrenergic receptor which was only found in abdominal adipose tissue. Gene profiling, by microarray analysis, identified that several HOX genes are robustly reduced in facial adipocytes compared to abdominal adipocytes, suggesting different characteristics between the 2 fat depots. These differences may have implications for development of treatments for facial fat loss during aging.
Introduction
Facial fat loss is a common manifestation of aging.Citation1,2 Autologous fat grafting has become popular to restore facial volume loss in addition to other facial fillersCitation2 and the enrichment of adipocyte-derived stem/stromal cells (ASC) in fat grafting has been actively considered.Citation3,4 Factors that induce endogenous facial preadipocyte differentiation may eventually work to reverse facial fat loss and potentially be considered as alternative treatments to facial fillers. The development of such technologies will lead to novel powerful anti-aging tools to target the recessed hypodermis. Nevertheless, facial fat cell isolation and characterization has never been attempted therefore, we do not know if facial adipocyte differentiation is inhibited by factors induced by aging or whether certain pathways fundamental for adipocyte differentiation are lost.
Preadipocytes are composing 15-50% of cells in adipose tissues where they mainly reside although small portions are coming from circulating pool.Citation5 They tend to populate in the vascular smooth muscle cells and pericytes compartment of the adipose vasculature, but not in the vasculature of other tissues.Citation6 As known, the main function of preadipocytes is producing mature fat cells, so to deposit excessive energy source to benign storage format in our body. Fat cell differentiation is initiated by several signaling cascades activated by fatty acids and glucocorticoids.Citation5 PPARγ and C/EBP-α are the key transcription factors governing the adipogenesis process.Citation5 The capability of proliferation and differentiation of preadipocytes has known to be reduced with aging and this reduction is more profound in subcutaneous fat region than omental depot.Citation7 The decreased expression of PPARγ and C/EBP-α in preadipocytes from old subjects has been reported as one of the underlying mechanism.Citation7,8 Also increased inflammation and insulin resistance in preadipocytes from old animals have been observed and suggested as a mechanistic understanding for the reduced lipogenic activities in preadipocytes from aged subjects.Citation7,8 The rate of these changes in fat cells seems to be different in various depots, contributing metabolic complication and redistribution of body fat during aging.Citation5,7 Preadipocytes from various body sites possess depot-specific characteristics.Citation9 For example, peroxisome proliferator-activated receptor gamma (PPAR-γ) agonists induced more lipid droplets and glycerol 3-phosphate dehydrogenase enzymatic activity in subcutaneous preadipocytes compared with omental preadipocytes. Importantly, this difference was observed despite similar levels of expression of the PPAR-γ protein.Citation10 Also it has been shown that insulin mediated antilipolytic activity is higher in the subcutaneous compared to visceral depot. On the other hand catecholamine induced lipolytic activities were lower in subcutaneous than visceral region.Citation11-13 Interestingly, the lipolytic rates from the subcutaneous tissue and from different body parts were also varied. For example, abdominal subcutaneous fat tissue has higher lipolytic rate than femoral/gluteal region.Citation14 In addition to heterogeneous metabolic activities, many researchers have reported a distinct gene expression profile among different fat depots.Citation15,16 For example, Gesta et.al have shown the difference in gene expression pattern between visceral and subcutaneous fat cells (mature adipocytes as well as preadipocytes) from mice and human by microarray analysis, and found that developmental genes such as homeobox (HOX) genes are one of the most profoundly changed, suggesting a new function of these genes in body fat distribution.Citation16 Among the genes that posses a metabolic involvement, phospholipase A2, group 2A (PLA2G2A), fibroblast growth factor 10 (FGF10) and insulin –like growth factor binding protein 5 (IGFBP5) were found to be regulated depot specifically between abdominal compared to gluteal fat.Citation15 Differential fatty acid composition was also reported, showing abdominal fat tissue has more saturated fatty acids than gluteal region.Citation15
In this study, we undertook for the first time the isolation, culture, characterization, and induced differentiation in vitro of facial preadipocytes obtained from face lift surgery. The focus was to identify possible differences of the facial preadipocytes in differentiation pattern and metabolic properties in relation to abdominal preadipocytes isolated from the adjacent to the dermis subcutaneous layer.
Results
Culture and differentiation of facial preadipocytes
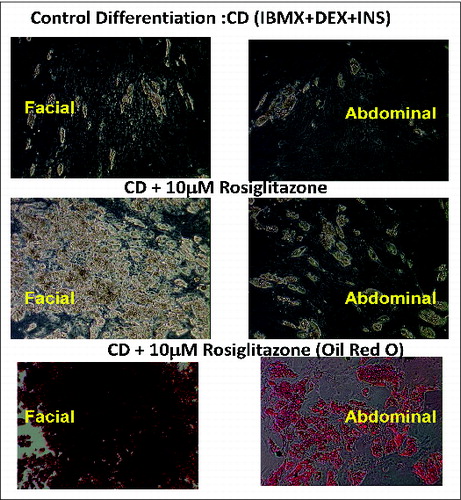
Rosiglitazone markedly increased the degree of adipocyte differentiation by day 15 of culture () of both facial and abdominal cells compared with control differentiated (CD) media alone. In addition, more facial preadipocytes (3 different preparations) exhibited differentiated characteristics (lipid droplets, Oil Red O accumulation) in the presence of control differentiation media plus rosiglitazone (CDR) than any of the abdominal preadipocyte preparations.
Figure 1. Facial preadipocytes are more responsive to rosiglitazone-containing differentiation compositions, relative to abdominal preadipocytes. Human facial and abdominal preadipocytes in control media (CD; insulin, dexamethasone, and IBMX), or CD plus 10 μM rosiglitazone (CDR). Lipid droplets are shown by Oil Red O staining. Microscopic images of the cells were taken on day 14 after plating. The pictures are representative of 3 individual experiments. DEX, dexamethasone; INS, insulin.
The ability to differentiate was maintained through multiple passages longer in facial preadipocytes than abdominal preadipocytes. demonstrates that facial adipocytes could be induced to differentiate though passage 5, whereas abdominal preadipocytes did not fully differentiate beyond passage 5. Consequently, it was determined that facial preadipocytes may be induced to differentiate at a passage greater than 10. The morphological and molecular characteristics at passage 11 were similar to those after the third passage (). Differentiated cells are identified by the large intracellular lipid droplets, as opposed to undifferentiated (UD) cells that have no lipid droplets; as also shown ().
Figure 2. Facial preadipocytes retain their ability to differentiate through later subpassages than abdominal preadipocytes. Human facial and abdominal preadipocytes at the indicated subpassages were induced to differentiate by CDR. Images of the cells were taken on day 14 after plating. The pictures are representative of 3 individual experiments. CDR, control differentiation media + 10 μM rosiglitazone; P, passage number.
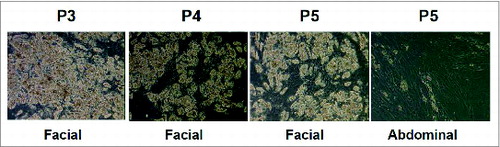
Figure 3. Morphology and gene expression of adipogenic markers in facial and abdominal preadipocytes. Facial and abdominal preadipocytes were grown for 14 d in the CD media or CDR media. (A) Images are representative of four individual experiments. (B) Gene expression was evaluated by qPCR and normalized by expression of the RPL13A gene. UD, undifferentiated (cultured in growth medium); CD, control differentiation; CDR, CD + 10 μM rosiglitazone; FABP4, fatty acid binding protein 4; FAS, fatty acid synthase; P, passage number; PPAR-γ, peroxisome proliferator-activated receptor gamma; qPCR, quantitative polymerase chain reaction.
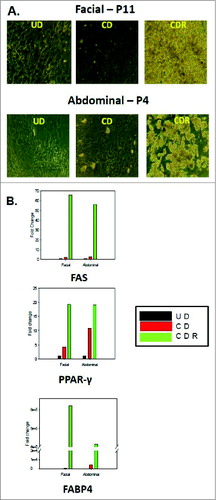
In , quantitative polymerase chain reaction (qPCR) analysis demonstrated that the expression of the major adipocyte markers (fatty acid binding protein 4 FABP4, PPAR-γ, and fatty acid synthase [FAS] [glucose transporter 4 (GLUT4), G-protein coupled receptor 81 (GPR81), leptin, and adiponectin not shown]) are similarly and significantly induced during differentiation of both facial and abdominal preadipocytes. The late-passage (passage 11) facial preadipocytes did not have significantly different expression levels of the adipogenic or the lipolytic genes tested (more than 20 genes, data not shown), compared to those of differentiated early-passage (passage 3-5) abdominal cells.
On day 14 or 15 after beginning the treatment with CDR media, preadipocyte cultures became fully differentiated adipocytes, as determined by morphological and adipocyte marker gene expression (FABP4, GLUT4, and PPAR-γ). To test the functional response of these cells, passage 3-5 facial and abdominal preadipocytes were treated with 2 μM of isoproterenol, a β2-adrenergic receptor agonist (). After 4 hours, glycerol release was 2 fold greater in abdominal than facial adipocytes. After 1 week of exposure to isoproterenol, differentiated facial adipocytes retained more number of fat cells with larger size than abdominally derived cells. Microscopic examination revealed more lipid droplets of greater diameter in the facial cells than in the abdominal adipocytes.
Figure 4. β-adrenergic receptor expression and responsiveness to isoproterenol in differentiated facial and abdominal preadipocytes. On day 14, cultures remained untreated (CDR) or were incubated with 10 μM isoproterenol (CDR+ IPTL) for up to one week. (A) Acute glycerol release after 5 hour isoproterenol treatment (2 μM). Data represented as mean ± SEM. Abdominal cells, n = 5 donors and facial cells, n = 7 donors. *Student t test P < 0.05. (B) Representative image of facial and abdominal adipocytes before and after 1 week of isoproterenol exposure. (C) After 1 week of isoproterenol treatment, the expression of lipid metabolic genes was evaluated by qPCR analysis and was normalized by expression of the RPL13A gene. Abdominal cells, n = 6 donors and facial cells, n = 4 donors. CD, control differentiation; CDR, CD + 10 μM rosiglitazone; ADRB2, β2-adrenergic receptor. Passages 2 until 6 were used for abdominal cells and passages 3 untill 11 were used for facial cells.
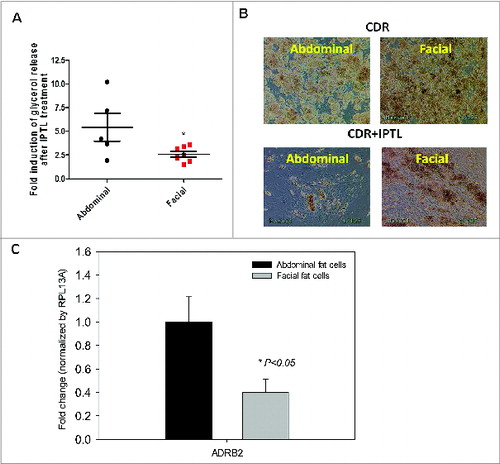
An array of genes associated with lipolysis was then tested to examine the possible differences in expression levels between facial and abdominal cells (Data not shown). From the 25 genes tested, only the expression of the β2-adrenergic receptor was significantly different (reduced by 60%) between facial and the abdominal adipocytes (), which was consistent with and supportive of our findings from the isoproterenol challenge.
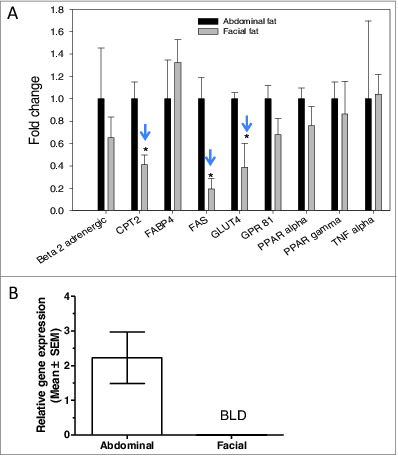
The differences noted above in expression of the β2-adrenergic receptors in differentiated preadipocytes from abdominal and facial sources were identified using cultured adipocytes. To determine whether the differences in gene expression observed between these tissues sites existed in vivo, we examined lipid metabolic gene expression using tissue obtained from age-matched individuals (45-60 y old) undergoing either facelift or abdominoplasty. Most gene markers were expressed at similar levels in tissues from both sites. As shown in , significantly less expression of FAS, CPT2 and GLUT4 in facial versus abdominal adipose tissue was observed. Although β2-adrenergic receptor expression levels were lower in facial versus abdominal adipose tissue, the difference was not significant. The expression the β3-adrenergic receptor was detected in abdominal adipose tissue, but was completely undetectable in the facial adipose tissue ().
Figure 5. Expression of adipocyte markers in facial and abdominal subcutaneous fat tissues. mRNA was isolated immediately following tissue harvest from females 50–60 years of age. Gene expression was evaluated by qPCR analysis; expression of fat cell markers was normalized by expression of the RPL13A gene (mean ± SEM). (A) Gene expression pattern in freshly harvested adipose tissues(n = 4 donors per group). (B) β3-adrenergic receptor expression in facial (n = 5 donors) and abdominal (n = 10 donors) tissues. *P < 0.05 versus abdominal cells. BLD, below limit of detection; CPT2, carnitine palmitoyltransferase 2; FABP4, fatty acid binding protein 4; FAS, fatty acid synthase; GLUT4, glucose transporter 4; GPR81, G-protein coupled receptor 8; PPAR-α, peroxisome proliferator-activated receptor α; PPAR-γ, peroxisome proliferator-activated receptor gamma; TNF-α, tumor necrosis factor α.
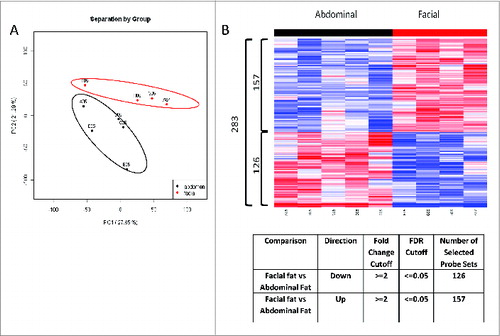
Microarray analysis was performed to identify any genes that are distinctly regulated in facial and abdominal preadipocytes differentiated in vitro. Depot specific patterns of gene expression were observed by principle component analysis (PCA). Abdominal samples were separated by facial samples in general, based on the overall expression profiles (). Total 283 probes differentially regulated between the 2 depots were identified as described in . 126 probe sets were significantly down-regulated in facial fat as compared to abdominal fat, with fold change not less than 2 and the overall FDR less than 0.05. Using the same criteria, 157 probe sets were significantly up-regulated in facial fat as compared to abdominal fat (). The detail expression profiles of these 283 probe sets were illustrated in heatmap . The lists of top 10 genes regulated differentially were summarized in .
Table 1. Genes differentially regulated in facial adipocytes compared to abdominal adipocytes
Figure 6. Depot specific gene expression profile in human facial vs abdominal adipocytes by Microarray analysis. (A) PCA analysis demonstrated a distinct gene expression pattern between 2 depots (Abdominal; n = 5, Facial; n = 4). (B) Heat-map illustration showing identified 283 probes differentially regulated between 2 depots. 126 probe sets were significantly down-regulated in facial fat as compared to abdominal fat. 157 probe sets were significantly up-regulated in facial fat cells as compared to abdominal fat cells.
Interestingly, the majority of the downregulated genes in facial or in other words the significantly upregulated genes in abdominal compared to facial adipocytes, were the HOX transcription factors, which have been reported to differ in other depot comparisons, for example, abdominal vs. gluteal regions.Citation15 A significant change of almost 9 fold up regulation in the facial adipocytes is also registered for the DIO2 gene (deiodinase, iodothryonine, type II), which is a marker of brown adipocytes.Citation17,18
Discussion
This is the first report describing the isolation, characterization, and culture of human facial preadipocytes. Although cultured facial and abdominal preadipocytes differentiate into adipocytes by the same lipogenic stimuli, they exhibit 2 clear differences. First, a higher proportion of facial cells differentiate, as determined by morphologic examination and lipid droplet quantitation. In addition, facial cells retain their ability to differentiate through more subpassages than abdominally derived cells. This is of prime interest since abdominal preadipocytes have not been shown to fully differentiate in culture beyond 5 passages.Citation19,20
The apparent difference between abdominal and facial cells or freshly isolated adipose tissues was in the expression of β-adrenergic receptor. Functionally, this was observed as a reduced lipolytic response to isoproterenol in facial adipocytes. A speculative explanation for such a site specific difference might be that fat depots from the abdominal area may be more sensitive to lipolytic stimuli, as they originate in the abdomen, which is used for fat storage. In addition, facial preadipocytes are more often exposed to the cold or UV radiation, which may certainly have an indirect effect on the volume loss, as cold exposure could potentially induce some of the metabolic aspects of beige or brown adipose tissue, such as mitochondria accumulation and production of mitochondrial uncoupling protein.Citation21 Our microarray analysis has demonstrated an increased ∼9 fold expression of DIO2 gene in facial adipocytes, which may support this idea since it is one of the profound markers of brown adipocytes. Citation17,18 There is some additional evidence that differential expression of DIO2 in subjects with Familial partial lipidistrophy (FPLD2) had higher levels of mRNA expression in the thigh than in the abdomen Subcutaneous abdominal tissue, which is another manifestation of a depot specific regulation.Citation22
In support of the UV radiation concept, our laboratory has reported that UV exposure can also lead to a cascade of reactions responsible for facial fat loss.Citation23,24
This work demonstrates that the greater responsiveness of facial preadipocytes to rosiglitazone could potentially be explained either by the absence of the natural PPAR-γ agonist in facial subcutaneous tissue or by the presence of an antagonist or inhibitor of lipogenesis. Since addition of rosiglitazone can fully restore the differentiation on the facial preadipocytes, strategies to compensate for facial fat loss by subcutaneous injection of such PPAR-γ agonist, could be less painful and more efficient than a fat transplant. Future studies will also investigate the insulin sensitivity of these cells that are currently addressed, since the facial fat cells are much more responsive to an agent as rosiglitazone than the abdominal fat cells. One of the major effects of the PPAR-γ activation by rosiglitazone involves increased insulin sensitivity.
It will be interesting to further explore the relationship of facial preadipocytes to their mesenchymal progenitors in a follow-up study. So far, both subcutaneous preadipocyte cell preparations were found to express the major mesenchymal stem cell markers (CD10, CD44, CD73, CD105, unpublished data). Future studies could address the loss of the expression of these genes in relation to subpassages in facial and abdominal preadipocytes.
One of the limitations of our study is related to the fact that the tissues derived from facelifts are very small in size and they often are depleted of the subcutaneous fat, due primarily to both surgical protocol and the nature of aged skin. Although we used published methods to isolate subcutaneous white adipocytes.,Citation23,25 the isolation procedure could potentially contain various mesenchymal cell types and adipose progenitors at various levels of lineage progression. Because most of the cultured cells exhibited a high degree of differentiation in the presence of rosiglitazone, we concluded that the preadipocytes isolated were committed unipotent post-mitotic adipose progenitors or even unipotent adipose progenitors. At this time it is unclear whether we also isolated resident multipotent mesenchymal stem cells, or adipose stem cells with high proliferative potential that could undergo terminal adipose differentiation in vitro.
The distinct regulation of HOX (homeobox) genes expression in facial adipocytes is an intriguing observation. Despite that none has previously attempted to isolate and characterize facial preadipocytes, many others have identified depot specific HOX genes expression pattern in different adipose sites,Citation26-28, suggesting their potential function driving a distinct depot characteristics. The HOX network are transcriptional factors, comprised of 39 genes regulating developmental process during embryogenesis, but also plays an important role in metabolic, somatic and congenital functions in adults.Citation26 Potential interaction of this molecular network and human adipogenesis has been suggested by Cantile et. al.Citation26 Recently, Gehrke et. al. suggested epigenetic regulation, in particular, DNA methylation of HOX genes as a mechanism that explains how this transcriptional factors exhibit such a distinct depot specific expression pattern.Citation15 A strong correlation between HOX gene expression and body fat mass has been observed. Citation16,26 Dankel et. al. found that the profound fat loss via bariatric surgery significantly upregulated the HOX gene expression in the abdominal subcutaneous adipose from the obese patient.Citation29 The mechanistic understanding of how the HOX network controls adipogenesis needs to be investigated in depth.
Fat and volume loss in the aging face can induce gravimetrical sagging, less firm dermis, and possibly wrinkled epidermis. The lack of significant differences in many lipid-processing genes between facial and abdominal adipocytes may indicate that the different responses observed between these cells might also be maintained by the presence of an inhibitor of lipogenesis in facial cells or by the absence of an endogenous activator (eg PPAR-γ agonist). The induction of subcutaneous facial adipocyte differentiation could potentially result in an improvement of facial contour, as well as a reduction of the appearance of skin defect around the same area. Therefore, characterization and better understanding of facial adipocytes could be useful in developing treatments for facial fat loss during aging.
Materials and Methods
Chemicals
Adipocyte tissue culture media (DMEM:F12 and antibiotics) and serum were from Life Technologies (Grand Island, NY). Fatty acid standards, Glycerol Determination Kit, Krebs-Ringer–bicarbonate buffer, glucose, collagenase, Medium 199, dexamethasone, insulin, and Oil Red O were purchased from Sigma-Aldrich (St. Louis, MO). Rosiglitazone and isobutylmethylxanthine (IBMX) were purchased from Cayman Chemicals (Ann Arbor, MI). Organic solvents were of high-performance liquid chromatography grade from Fisher (Pittsburgh, PA).
Preparation and culture of primary preadipocytes
Human primary preadipocytes from facial and abdominal sources, obtained with informed consent from a plastic surgery clinic. The subcutaneous fat tissue adjacent to the dermis was used only for the isolation of the preadipocytes and for both abdominal and facial skin specimens. The cells were isolated and cultured as previously described.Citation23,25 Tissue was obtained from four different donors for facial adipocytes and 5 different donors for abdominal adipocytes. All donors were females, age 45–60 y and the abdominal tissues were from individuals with BMI higher than 25. Briefly, individual donor samples from abdominal or facial operations were subjected to enzymatic digestion in Krebs-Ringer–bicarbonate buffer (pH 7.4) containing 6 mM glucose and 2 mg/ml collagenase for 30 minutes. The tissue digest was passed through a sterile, 230-micron stainless steel tissue sieve (Cellector, Bellco Glass Inc., Vineland, NJ) into a 50-ml sterile, plastic test tube. Undigested stromal-vascular tissue trapped on the sieve was discarded. The infranatant containing the preadipocyte fraction was collected, passed into another sterile tube, and the collagenase neutralized with an equal volume of growth medium containing Medium 199, 10% heat-inactivated fetal calf serum, and 1% antibiotic-antimycotic. After centrifugation, the pellet was resuspended in the above described growth medium, filtered, transferred to a sterile tissue culture flask, and maintained in an incubator at 37°C, 5% CO2. Cell attachment was allowed for 16–20 hours, after which floating cells were removed by aspiration, followed by addition of fresh growth medium. Cells were grown to > 80% confluence in growth medium and passaged at least twice before use.
Differentiation of primary preadipocytes
Cell differentiation was induced using a control differentiation (CD) media containing insulin (100 nM), dexamethasone (1 μM), and IBMX (250 μM), or CD + rosiglitazone (10 μM; CDR) media. CD or CDR media were added to the cultures 24 hours after the cells were seeded. The media was changed 3 d later and supplemented with fresh preparations CD or CDR media. After day 7 in culture, IBMX and rosiglitazone were removed from the culture media, and the cells cultured for 5-10 d more for observation of lipid droplet formation, which is indicative of the cells’ ability to differentiate. Images of cultured cells and their produced lipid droplets were acquired by an inverted microscope on days 12 and 15 of the culture.
Isoproterenol stimulation took place on day 15 and day 21. On day 15, a 2 μM of final concentration isoproterenol was added in the media (total of 1 ml) and 100 μl of media were removed after 1, 2, and 4 hours. For the longer term studies, 2 μM isoproterenol was maintained in the media until assay on day 21. The glycerol released into the media was monitored with an enzymatic assay (Sigma-Aldrich catalog number FG0100).
Oil Red O assay
Oil Red O (ORO) staining was used to image lipid accumulation in differentiated preadipocytes. Preadipocytes were seeded into a 24-well plate (75–80 × 104 cells per well) and treated as described above. On day 15 of the culture, the plates were removed from the incubator and the cells were rinsed with 1 ml of phosphate-buffered saline. The cells were fixed by the addition of 0.5 ml of 10% formaldehyde (buffered formalin solution). The plates were incubated at room temperature for 20 minutes.
ORO working solution was prepared immediately prior to the assay by adding 6 ml of stock solution (0.5% w/v in isopropanol) to 4 ml of ddH2O, and then filtering through a Whatman Grade No. One filter paper. After removal of buffered formalin, ORO working solution (0.5 mL) was added to each well. The plate then was incubated in the dark at room temperature for 1 hour. Subsequently, the wells were rinsed with 2×2 ml of phosphate-buffered saline to remove excess extracellular ORO.
Quantitative real-time PCR
Relative gene expression in adipocytes was analyzed by quantitative real-time PCR (SYBR® Green method). Total RNA was extracted using a Qiagen RNeasy Kit (Qiagen, Valencia, CA) along with DNase 1 treatment to minimize genomic DNA contamination. RNA quality was assessed by 2100 Bioanalyzer (Agilent, Santa Clara, CA) and reverse transcription was performed using 200 ng of total RNA, using a High-Capacity cDNA Kit (Applied Biosystems, Foster City, CA) in a total volume of 20 μl. All qPCR primers and SYBR Green Master Mix were purchased from (Qiagen, Valencia, CA) and each reaction contained 5 ng of cDNA, 1 μl of primer, and 12.5 μl of SYBR Green Master Mix in a total volume of 25 μl. The qPCR reaction was performed using an Applied Biosystems 7300 instrument. Relative quantification of expression was calculated using the comparative CT method normalized to RPL13A.
Data analysis
All studies were performed on cells between passage 3–5, unless otherwise stated. Differences of means between facial and abdominal cells for various endpoints were tested using student t-tests.
Microarray analysis
Preadipocytes were isolated from human abdominal and facial region (n = 5 and 4 repectively) and differentiated in vitro as described above. Cells were harvested for total RNA isolation followed by 14 d of differentiation. Total RNA was extracted using a Qiagen RNeasy Kit (Qiagen, Valencia, CA) along with DNase 1 treatment. RNA quality was assessed by 2100 Bioanalyzer (Agilent, Santa Clara, CA). Samples were hybridized to Affymetrix Human HT Plus2PM 16 array. To identify differential gene expression between abdominal and facial adipocytes, data were analyzed using Welch's t test. Differentially expressed probe sets were selected by both fold change (>= 2) and associated P-value (<0.05). In addition, false discovery rate (FDR) of selected probe sets was evaluated by comparing the number of selected probes in observed dataset with the number of selected probes in permutated data sets.
Disclosure of Potential Conflicts of Interest
Apostolos Pappas is an employee of Johnson & Johnson Consumer Companies, Inc. Su-Hyoun Chon was an employee of Johnson & Johnson Consumer Companies, Inc. at the time these studies were performed.
955402_Supplementary_Materials.zip
Download Zip (34.5 KB)Acknowledgments
We would like to thank Drs. Druie Cavender, Michael Southall, and Miri Seiberg for fruitful discussions and critical reading of this manuscript. We also acknowledge the helpful advice and teachings of Dr. Thierry Oddos on the preadipocyte culture. Medical writing and editorial assistance was provided by Dr. Alex Loeb, CMPP, of Evidence Scientific Solutions, Philadelphia, PA, which was funded by Johnson & Johnson Consumer Companies, Inc.
Funding
Johnson & Johnson Consumer Companies, Inc. funded the study.
References
- Coleman S, Saboeiro A, Sengelmann R. A comparison of lipoatrophy and aging: volume deficits in the face. Aesthetic Plast Surg 2009; 33:14-21; PMID:18987910; http://dx.doi.org/10.1007/s00266-008-9258-z
- Bucky LP, Kanchwala SK. The role of autologous fat and alternative fillers in the aging face. Plast Reconstr Surg 2007; 120:89S-97S; PMID:18090347; http://dx.doi.org/10.1097/01.prs.0000248866.57638.40
- Beeson W, Woods E, Agha R. Tissue engineering, regenerative medicine, and rejuvenation in 2010: the role of adipose-derived stem cells. Facial Plast Surg 2011; 27:378-87; PMID:21792781; http://dx.doi.org/10.1055/s-0031-1283056
- Cohen SR, Mailey B. Adipocyte-derived stem and regenerative cells in facial rejuvenation. Clin Plast Surg 2012; 39:453-64; PMID:23036296; http://dx.doi.org/10.1016/j.cps.2012.07.014
- Tchkonia T, Morbeck DE, Von ZT, Van DJ, Lustgarten J, Scrable H, Khosla S, Jensen MD, Kirkland JL Fat tissue, aging, and cellular senescence. Aging Cell 2010; 9:667-84; PMID:20701600; http://dx.doi.org/10.1111/j.1474-9726.2010.00608.x
- Tang W, Zeve D, Suh JM, Bosnakovski D, Kyba M, Hammer RE, Tallquist MD, Graff JM. White fat progenitor cells reside in the adipose vasculature. Science 2008; 322:583-6; PMID:18801968; http://dx.doi.org/10.1126/science.1156232
- Sepe A, Tchkonia T, Thomou T, Zamboni M, Kirkland JL. Aging and regional differences in fat cell progenitors - a mini-review. Gerontology 2011; 57:66-75; PMID:20110661; http://dx.doi.org/10.1159/000279755
- Karagiannides I, Tchkonia T, Dobson DE, Steppan CM, Cummins P, Chan G, Salvatori K, Hadzopoulou-Cladaras M, Kirkland JL. Altered expression of C/EBP family members results in decreased adipogenesis with aging. Am J Physiol Regul Integr Comp Physiol 2001; 280:R1772-R1780; PMID:11353682
- Cartwright MJ, Tchkonia T, Kirkland JL. Aging in adipocytes: potential impact of inherent, depot-specific mechanisms. Exp Gerontol 2007;42:463-471; PMID:17507194; http://dx.doi.org/10.1016/j.exger.2007.03.003
- Adams M, Montague CT, Prins JB, Holder JC, Smith SA, Sanders L, Digby JE, Sewter CP, Lazar MA, O'Rahilly S et al. Activators of peroxisome proliferator-activated receptor gamma have depot-specific effects on human preadipocyte differentiation. J Clin Invest 1997; 100:3149-53; PMID:9399962; http://dx.doi.org/10.1172/JCI119870
- Arner P. Differences in lipolysis between human subcutaneous and omental adipose tissues. Ann Med 1995; 27:435-8; PMID:8519504; http://dx.doi.org/10.3109/07853899709002451
- Bolinder J, Kager L, Ostman J, Arner P. Differences at the receptor and postreceptor levels between human omental and subcutaneous adipose tissue in the action of insulin on lipolysis. Diabetes 1983; 32:117-123; PMID:6337893; http://dx.doi.org/10.2337/diab.32.2.117
- Mauriege P, Galitzky J, Berlan M, Lafontan M. Heterogeneous distribution of beta and alpha-2 adrenoceptor binding sites in human fat cells from various fat deposits: functional consequences. Eur J Clin Invest 1987; 17:156-65; PMID:3034620; http://dx.doi.org/10.1111/j.1365-2362.1987.tb02395.x
- McQuaid SE, Humphreys SM, Hodson L, Fielding BA, Karpe F, Frayn KN. Femoral adipose tissue may accumulate the fat that has been recycled as VLDL and nonesterified fatty acids. Diabetes 2010; 59:2465-73; PMID:20682685; http://dx.doi.org/10.2337/db10-0678
- Gehrke S, Brueckner B, Schepky A, Klein J, Iwen A, Bosch TC, Wenck H, Winnefeld M, Hagemann S. Epigenetic regulation of depot-specific gene expression in adipose tissue. PLoS One 2013; 8:e82516; PMID:24340035; http://dx.doi.org/10.1371/journal.pone.0082516
- Gesta S, Bluher M, Yamamoto Y, Norris AW, Berndt J, Kralisch S, Boucher J, Lewis C, Kahn CR. Evidence for a role of developmental genes in the origin of obesity and body fat distribution. Proc Natl Acad Sci U S A 2006; 103:6676-6681; PMID:16617105; http://dx.doi.org/10.1073/pnas.0601752103
- Okla M, Ha JH, Lee M, Chung S. Establishment and characterization of in vitro model of human beige adipocytes using adenoviral delivery of BMP7 (133.1). FASEB J 2014;28(1) : supplement133.1; http://dx.doi.org/10.1096/fj.14-0101LTE
- Christoffolete MA, Linardi CC, de Jesus L, Ebina KN, Carvalho SD, Ribeiro MO, Rabelo R, Curcio C, Bianco AC, Kimura ET, et al. Mice with targeted disruption of the Dio2 gene have cold-induced overexpression of the uncoupling protein 1 gene but fail to increase brown adipose tissue lipogenesis and adaptive thermogenesis. Diabetes 2004; 53(3):577-84; PMID:14988240; http://dx.doi.org/10.2337/diabetes.53.3.577
- Zenbio INC. Subcutaneous human adipocyte instruction manual. US Patent 6,153,432; 2012; ZBM0001.03. Available from http://www.zen-bio.com/pdf/ZBM0001.01SQAdipocyteCare.pdf
- Wall ME, Bernacki SH, Loboa EG. Effects of serial passaging on the adipogenic and osteogenic differentiation potential of adipose-derived human mesenchymal stem cells. Tissue Eng 2007; 13:1291-8; PMID:17518709; http://dx.doi.org/10.1089/ten.2006.0275
- Seale P, Kajimura S, Spiegelman BM. Transcriptional control of brown adipocyte development and physiological function–of mice and men. Genes Dev 2009; 23:788-97; PMID:19339685; http://dx.doi.org/10.1101/gad.1779209
- Lado-Abeal J, Calvo RM, Victoria B, Castro I, Obregon MJ, Araujo-Vilar D. Regional decrease of subcutaneous adipose tissue in patients with type 2 familial partial lipodystrophy is associated with changes in thyroid hormone metabolism. Thyroid 2010; 20(4):419-24; PMID:20373986; http://dx.doi.org/10.1089/thy.2009.0267
- Li WH, Pappas A, Zhang L, Ruvolo E, Cavender D. IL-11, IL-1alpha, IL-6, and TNF-alpha are induced by solar radiation in vitro and may be involved in facial subcutaneous fat loss in vivo. J Dermatol Sci 2013; 71:58-66; PMID:23639700; http://dx.doi.org/10.1016/j.jdermsci.2013.03.009
- Li W-H, Pappas A, Zhang L, Cavender D Sunscreens may prevent UV-induced facial fat loss by blocking the production of IL-11. 2011; SID 2011 meeting abstract book 658.
- Crandall DL, Armellino DC, Busler DE, McHendry-Rinde B, Kral JG. Angiotensin II receptors in human preadipocytes: role in cell cycle regulation. Endocrinology 1999; 140:154-8; PMID:9886820; http://dx.doi.org/10.1210/endo.140.1.6430
- Cantile M, Procino A, D'Armiento M, Cindolo L, Cillo C. HOX gene network is involved in the transcriptional regulation of in vivo human adipogenesis. J Cell Physiol 2003; 194:225-36; PMID:12494461; http://dx.doi.org/10.1002/jcp.10210
- Tchkonia T, Lenburg M, Thomou T, Giorgadze N, Frampton G, Pirtskhalava T, Cartwright A, Cartwright M, Flanagan J, Kirkland JL et al. Identification of depot-specific human fat cell progenitors through distinct expression profiles and developmental gene patterns. Am J Physiol Endocrinol Metab 2007; 292:E298-E307; PMID:16985259; http://dx.doi.org/10.1152/ajpendo.00202.2006
- Karastergiou K, Fried SK, Xie H, Lee MJ, Divoux A, Rosencrantz MA, Chang RJ, Smith SR. Distinct developmental signatures of human abdominal and gluteal subcutaneous adipose tissue depots. J Clin Endocrinol Metab 2013; 98:362-71; PMID:23150689; http://dx.doi.org/10.1210/jc.2012-2953
- Dankel SN, Fadnes DJ, Stavrum AK, Stansberg C, Holdhus R, Hoang T, Veum VL, Christensen BJ, Vage V, Mellgren G et al. Switch from stress response to homeobox transcription factors in adipose tissue after profound fat loss. PLoS One 2010; 5:e11033; PMID:20543949; http://dx.doi.org/10.1371/journal.pone.0011033