Abstract
We have reported the production of white adipocytes in adipose tissue from hematopoietic progenitors arising from bone marrow. However, technical challenges have hindered detection of this adipocyte population by certain other laboratories. These disparate results highlight the need for sensitive and definitive techniques to identify bone marrow progenitor (BMP)-derived adipocytes. In these studies we exploited new models and methods to enhance detection of this adipocyte population. Here we showed that confocal microscopy with spectrum acquisition could effectively identify green fluorescent protein (GFP) positive BMP-derived adipocytes by matching their fluorescence spectrum to that of native GFP. Likewise, imaging flow cytometry made it possible to visualize intact unilocular and multilocular GFP-positive BMP-derived adipocytes and distinguished them from non-fluorescent adipocytes and cell debris in the cytometer flow stream. We also devised a strategy to detect marker genes in flow-enriched adipocytes from which stromal cells were excluded. This technique also proved to be an efficient means for detecting genetically labeled adipocytes and should be applicable to models in which marker gene expression is low or absent. Finally, in vivo imaging of mice transplanted with BM from adipocyte-targeted luciferase donors showed a time-dependent increase in luciferase activity, with the bulk of luciferase activity confined to adipocytes rather than stromal cells. These results confirmed and extended our previous reports and provided proof-of-principle for sensitive techniques and models for detection and study of these unique cells.
Introduction
Adipose tissue is the major energy reservoir in the body, playing pivotal roles in energy homeostasis, insulin sensitivity, inflammation and satiety. Superficially, adipose tissue from different anatomical locations appears to be homogeneous, however this is not the case. Fat from different body locations displays distinct phenotypic characteristics and impacts on health.Citation1,Citation2 The morphological and functional heterogeneity of the different regional fat depots is exemplified by the link between the metabolic disturbances of obesity and increased visceral rather than peripheral adiposity.Citation3-Citation5
Adipose tissue heterogeneity is linked to the presence of distinct adipocyte populations within the regional fat depots. Adipocytes in visceral fat exhibit higher rates of fatty acid turnover and lipolysis and are less sensitive to the lipolysis-suppressing effects of insulin than adipocytes from peripheral depots.Citation2 Visceral adipocytes also produce increased levels of inflammatory cytokines (e.g., interleukin-6 and TNFα) but less adiponectin and leptin than subcutaneous fat cells.Citation1 These differences connect increased visceral adiposity to the insulin resistance and inflammation that are characteristic of obesity.
The regional fat depots comprise distinct adipocyte populations that arise from equally distinct preadipocyte and progenitor cell populations. For example, human subcutaneous preadipocytes exhibit a higher capacity for adipogenic differentiation and survival than visceral preadipocytes from the same individual.Citation6,Citation7 These features may explain why expansion of visceral fat is generally characterized by lipid accumulation and hypertrophy of existing adipocytes rather than lipid deposition in newly generated adipocytes as occurs in subcutaneous fat. The lipid-engorged visceral adipocytes respond poorly to insulin and produce high levels of inflammatory cytokines.Citation8,Citation9 Therefore, the decreased adipogenic capacity of visceral preadipocytes may in part explain the detrimental impact of increased visceral adiposity on health.
Fate mapping studies have also demonstrated that different adipocyte populations have distinct developmental origins. Billon et al.Citation10 used the sox10 gene promoter to indelibly label neural crest-derived cells with yellow fluorescent protein (YFP). These studies identified a population of adipocytes in the cephalic region between the salivary gland and the ear generated from neuroectoderm rather than mesoderm. A similar strategy in which the gene promoter of the myogenic factor, myf5, was used to target YFP expression specifically to muscle progenitors revealed that brown adipocytes in intrascapular and perirenal fat arise from the muscle lineage.Citation11
We have used a variety of fate mapping strategies to show that a subpopulation of adipocytes arises from bone marrow (BM) progenitor cells. This phenomenon was originally observed in lethally irradiated mice transplanted with BM from donors expressing green fluorescent protein (GFP) under the control of the ubiquitin C gene promoter.Citation12 GFP+ adipocytes were detected in all major depots by fluorescence microscopy or flow cytometry and their numbers were increased in response to treatment with the thiazolidinedione, rosiglitazone (ROSI) or high fat diet.
Although one may hypothesize that these adipocytes were produced from marrow mesenchymal stem cells, subsequent competitive transplant experiments indicated a hematopoietic and myeloid lineage origin for BMP-derived adipocytes.Citation13 This was confirmed in mice by using the myeloid-specific LysM gene promoter to indelibly label cells arising from the myeloid lineage with LacZ. LacZ+ adipocytes were detected in these mice at levels consistent with that observed in marrow recipients. Since these mice did not receive BM transplant, we concluded that BMP-derived adipocytes are not generated as an artifact of myeloablative injury. These results demonstrated a hematopoietic rather than mesenchymal origin for this subset of adipocytes.
Although we have demonstrated the production of adipocytes from marrow-derived hematopoietic progenitors, technical challenges have hindered detection of this adipocyte population by other laboratories.Citation14-Citation16 These disparate results underscore the need for definitive techniques to detect genetic markers, which often evade detection due to variegated expression in different cell types. Therefore, in these studies we exploited new models and methods to enhance detection of the BMP-derived adipocyte population. Our results confirm and extend our previous reports and provide proof-of-principle for sensitive techniques and models for detection and study of these unique cells.
Results
Adipocyte lineage specification of BM progenitors
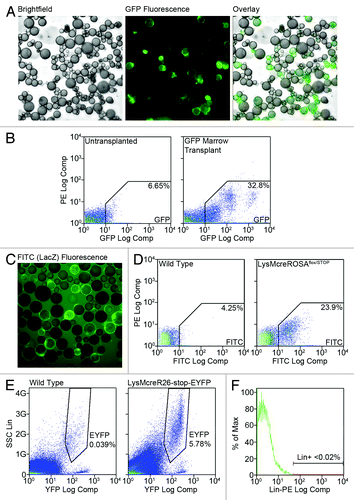
We previously reported the production of adipocytes from BM progenitors in lethally-irradiated mice transplanted with BM from donors globally expressing GFP.Citation12 These adipocytes were detected by immunohistochemistry, fluorescence microscopy and flow cytometry. Subsequent lineage analysis studiesCitation13 with a myeloid-targeted LacZ model demonstrated production of adipocytes from the myeloid lineage without myeloablative injury. Within 8–16 weeks BMP-derived adipocytes comprised from 5–25% of the total adipocyte pool depending on gender, depot location or time post-transplant/birth. Marrow-derived fat cells are particularly abundant in female gonadal fat where they comprised 20–30% of the adipocyte population within 16 weeks of transplant (), or birth in non-myeloablative models (). Levels between 4–10% were detectable in female gonadal fat as early as 4–6 weeks after birth (). BMP-derived adipocytes were not an artifact of the adherence of stromal cells to fat cells since less than 0.02% of the adipocyte fraction from collagenase-digested fat displayed stromal lineage markers () and could be distinguished from GFP+ adipocytes during flow cytometry.
Figure 1. Adipocytes are generated from BM progenitors. (A) Gonadal fat was recovered from female mice transplanted with GFP-expressing BM 16 weeks post-transplant. The fat was digested with collagenase and adipocytes were separated from stromal cells by flotation/centrifugation. (A) Representative brightfield and GFP fluorescence images of free-floating adipocytes are shown along with a digital overlay. (B) Gonadal adipocytes were prepared as in (A) from untransplanted and GFP marrow transplanted mice and analyzed by flow cytometry. Representative scattergrams are shown and the average percentages of all events falling in the GFP gate are indicated. (C) Gonadal fat was harvested from 16-week-old female LysMcreROSAflox/STOP mice. Following tissue digestion and cell separation, adipocytes were stained with FDG and examined by fluorescence microscopy. A representative fluorescence image is shown. (D) Gonadal adipocytes from wild type and LysMcreROSAflox/STOP mice were analyzed by flow cytometry. Representative scattergrams are shown and the average percentages of all events falling in the FITC gates are indicated. (E) Gonadal adipocytes from 4- to 6-week-old wild type and LysMcreR26-stop-EYFP mice were analyzed by flow cytometry. Representative scattergrams are shown and the average percentages of all events falling in the EYFP gates are indicated. (F) Gonadal adipocytes from 16 week GFP BM transplant recipients were stained with a cocktail of PE-conjugated antibodies to stromal lineage markers and analyzed by flow cytometry. Figure shows a representative histogram indicating the average percentage of lineage positive stroma cells in the adipocyte fractions.
Expression of marker genes is highly variegated in adipocytes
A drawback of many genetic markers is their variegated expression between different cell populations, even within a single cell type.Citation17-Citation20 shows this also applies to cytosolic GFP expression in adipocytes from GFP donor mice, which exhibited considerable differences in fluorescence intensity between individual adipocytes. Comparison of free-floating adipocytes from BM donor and recipient mice showed that GFP fluorescence in BMP-derived adipocyte was generally less intense than in donor adipocytes. Flow cytometric measurement of fluorescence levels in adipocytes and stromal cells from GFP BM donor and recipient mice confirmed that GFP expression in BMP-derived adipocytes was lower than a large portion of donor adipocytes and substantially lower than GFP+ stromal cells (). However, in spite of their modest fluorescence, these GFPDIM adipocytes could be distinguished from GFP- adipocytes by flow cytometry.
Figure 2. Fluorescent marker expression can be highly variegated in adipocytes. (A) Gonadal fat was harvested from UbqC-GFP donor mice and 16 week GFP BM transplant recipients. Fat was digested with collagenase and adipocytes isolated by flotation/centrifugation. Adipocytes from both sets of animals were examined by fluorescence microscopy. Representative images taken with the same exposure parameters demonstrate variegated GFP expression in marrow donors and generally low GFP expression in BMP-derived adipocytes. (B) Gonadal fat was harvested from wild type mice, UbqC-GFP donor mice and GFP BM recipients. Adipocytes and stroma were prepared from the fat as in (A) and analyzed by flow cytometry. The figure shows representative histograms of GFP fluorescence in each sample and confirms variegated GFP expression in donor mice and dim GFP fluorescence in BMP-derived adipocytes. (C) Wild-type female mice were transplanted with BM from mT/mG donor mice. Eight weeks post-transplant, gonadal adipose tissue was harvested, digested and free-floating adipocytes separated from stromal cells. Adipocytes were examined by brightfield and fluorescence microscopy and representative images of tdTomato positive BMP-derived adipocytes among non-fluorescent fat cells are shown. (D) Gonadal adipocytes from Tomato BM transplant recipient mice and untransplanted control mice were examined by flow cytometry. Representative flow scattergrams confirm production of Tomato-expressing BMP-derived adipocytes. (E and F) Gonadal fat from mT/mG donor mice was harvested, digested and free-floating adipocytes examined by fluorescence microscopy (E) and flow cytometry (F). (E) Prior to microscopy, adipocytes were fixed briefly with 4% paraformaldehyde in PBS, then stained with LipidTOX Green for 20 min and DAPI for 10 min. Representative bright field and fluorescence images show single nuclei associated with lipid droplets. Intact cells with bright (b), dim (d) or no (n) Tomato fluorescence are indicated. (F) Representative flow scattergram shows that a considerable number of donor adipocytes are Tomato negative while the remaining adipocytes express variable levels of tdTomato.
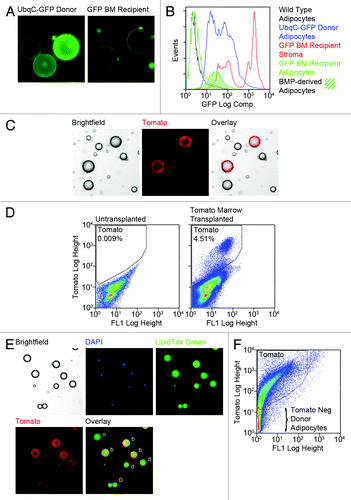
We also observed variegated expression of another fluorescent marker, tandem dimer (td) Tomato. We hypothesized that this protein might be a better marker than GFP given its spatial confinement to the cell membrane and higher quantum yield. Adipocytes expressing tdTomato were detected in mice transplanted with marrow from tdTomato+ donors by direct fluorescence microscopy of free-floating adipocytes (), or flow cytometry (). However, BMP-derived adipocyte production was lower than observed in experiments with GFP, leading us to question whether tdTomato expression was also variegated in adipocytes. Visual inspection of adipocytes from Tomato donor mice revealed cells with varying levels of red fluorescence, including cells with little or no fluorescence (). The variable or absent Tomato fluorescence was not due to cell lysis as all lipid droplets were associated with single nuclei (DAPI staining). Flow analysis of adipocytes from tdTomato donor mice revealed a broad continuum of Tomato fluorescence intensities (). Remarkably, Tomato fluorescence was undetectable in 15–42% of the adipocytes even though the Tomato gene was present throughout the population. The highly variegated expression of marker genes underscores the need for sensitive techniques to detect their protein production or the presence of the gene itself when expression is very low or absent.
Variegated marker expression is not due to cell death
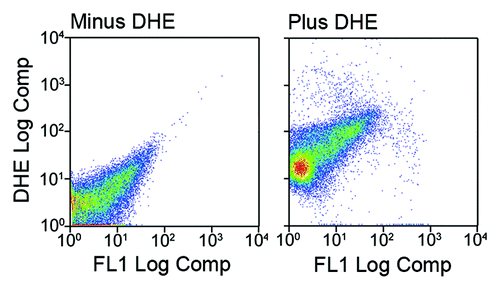
Low or absent marker expression could be due to the death of adipocytes during their isolation from fat tissue. To evaluate cell death in our adipocyte preparations, we stained free floating fat cells with dihydroethidium (DHE). This agent exhibits blue fluorescence in the cytosol until it undergoes mitochondrial oxidation, after which it exhibits intense red fluorescence when bound to nuclear DNA. Comparison of DHE-stained vs. unstained cells revealed that over 99% of adipocytes in our preparations exhibited red fluorescence (), indicating that not only were the isolated fat cells intact, but also metabolically active.
Figure 3. Adipocytes isolated by collagenase digestion are intact and metabolically active. Gondal adipose tissue was harvested from female mice and digested with collagenase. Adipocytes were separated from stromal cells by flotation and centrifugation. A portion of the free-floating adipocytes were stained with dihydroethidium (DHE). Over 99% of the stained cells exhibited red fluorescence indicating the presence of a nucleus and mitochondrial activity.
Confocal microscopy equipped with spectral detection distinguishes GFP+ adipocytes from non-fluorescent and autofluorescent cells
GFP fluorescence, especially when dim, is easily confused with autofluorescence due to endogenous fluorophores like reduced pyridine nucleotides [NAD(P)H] and oxidized flavins (FMN and FAD).Citation21 We used the inherent sensitivity of confocal microscopy coupled with spectrum acquisition to identify GFP+ BMP-derived adipocytes from non-fluorescent and autofluorescent fat cells in transplant recipient mice. Differential interference contrast and confocal images of free-floating adipocytes revealed both green fluorescent and non-fluorescent cells (). Since the green fluorescence was generally dim, emission spectra were acquired to distinguish bona fide GFP fluorescence vs. autofluorescence. A single large emission peak was detected in GFP+ adipocytes centered at 509 nm that overlapped exactly the emission spectrum of native GFP (). Several smaller peaks were also present between 550 and 700 nm. However, the emission spectrum of autofluorescent cells consisted of a broad doublet (520 and 544 nm) as well as smaller peaks between 550 and 700 nm. Little to no fluorescence was detected from non-fluorescent cells. Images of fluorescent cells after unmixing of the GFP signal showed cytosolic GFP encircling lipid droplets (). Thus, cells expressing low levels of fluorescent markers could be detected by confocal microscopy and marker expression verified by spectral analysis.
Figure 4. Confocal microscopy and spectral detection of GFP-positive BMP-derived adipocytes. Wild type female mice were transplanted with BM from UbqC-GFP donors. Eight weeks post-transplant, gonadal fat was recovered from the recipients, digested with collagenase and adipocytes isolated by flotation/centrifugation. Free-floating adipocytes were examined by differential interference contrast and confocal microscopy. (A) Representative DIC and GFP confocal images and digital overlays show adipocytes with cytosolic GFP fluorescence adjacent to non-fluorescent fat cells. (B) Fluorescence spectrum of a BMP-derived adipocyte [shown in (C)] was acquired at 6 nm resolution from 490–683 nm. Graph shows comparison of BMP-derived adipocyte fluorescence spectrum to the spectrum of native GFP protein. (C) Image of BMP-derived adipocyte after unmixing of the GFP signal shows GFP fluorescence in the cytosol surrounding the lipid droplet.
![Figure 4. Confocal microscopy and spectral detection of GFP-positive BMP-derived adipocytes. Wild type female mice were transplanted with BM from UbqC-GFP donors. Eight weeks post-transplant, gonadal fat was recovered from the recipients, digested with collagenase and adipocytes isolated by flotation/centrifugation. Free-floating adipocytes were examined by differential interference contrast and confocal microscopy. (A) Representative DIC and GFP confocal images and digital overlays show adipocytes with cytosolic GFP fluorescence adjacent to non-fluorescent fat cells. (B) Fluorescence spectrum of a BMP-derived adipocyte [shown in (C)] was acquired at 6 nm resolution from 490–683 nm. Graph shows comparison of BMP-derived adipocyte fluorescence spectrum to the spectrum of native GFP protein. (C) Image of BMP-derived adipocyte after unmixing of the GFP signal shows GFP fluorescence in the cytosol surrounding the lipid droplet.](/cms/asset/cb062312-82e6-43aa-993b-07adb1deebab/kadi_a_10921496_f0004.gif)
Imaging flow cytometry distinguishes adipocytes based on fluorescence intensity and morphology
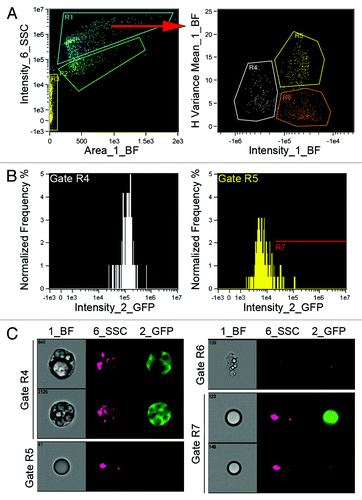
Our previous studies relied heavily on conventional flow cytometry to analyze and sort free-floating adipocytes based on GFP expression. However, cytometry of adipocytes has generally been considered difficult if not impossible due to their large size and fragility. To validate our previous results we performed imaging flow cytometry in collaboration with Amnis Corporation. This technique provided quantitative multichannel fluorescence analysis of the entire cell population similar to conventional flow cytometry, as well as brightfield images of each cell in the flow steam as they transited the detector array.
Gonadal adipocytes from untransplanted and GFP marrow transplanted mice were shipped to Amnis Corporation for cytometry. Following data acquisition, gating parameters were selected post-hoc with IDEAS software. Among the events of best focus, initial gating separated cell populations (gate R1) from non-fluorescent debris (gate R2) (). Further gating of the R1 population identified three subsets (R4–R6). Gate R4 contained intact multilocular adipocytes with variable green fluorescence (). The R5 population consisted of intact unilocular adipocytes, most with no discernible green fluorescence. Gate R6 contained cell debris with variable but dim green fluorescence. A subset of the R5 population exhibited dim green fluorescence overlapping the GFP signal in gate R4. This population, designated R7 () consisted of unilocular adipocytes with dim and variable green fluorescence. Of the subsets containing intact adipocytes (R4, R5 and R7) approximately 25% of the events exhibited GFP fluorescence.
Figure 5. Imaging flow cytometry of BMP-derived adipocytes. Gonadal adipose tissue was harvested from mice transplanted with BM from UbqC-GFP mice 8 weeks post-transplant. Adipocytes were isolated from collagenase-digested tissue and fixed for 20 min. in PBS containing 4% paraformaldehyde. Cells were then transferred to PBS and shipped overnight to Amnis Corp. for imaging cytometry. Adipocytes from untransplanted mice were included as negative controls and for gating. Data was acquired on an ImageStream X cytometer for brightfield (BF), side scatter (SSC) and GFP fluorescence. (A) Gating parameters were determined post-hoc by IDEAS software with preliminary gating separating intact cells (R1) from cell debris (R2) and synchronization beads (R3). Further gating of R1 revealed 3 populations; green fluorescent multilocular cells (R4), non-fluorescent unilocular cells (R5) and debris with variable fluorescence (R6). (B) The fluorescence intensity distribution of the populations in R4 and R5 are shown in the histograms. Events in R5 with fluorescence levels overlapping events in R4 were designated gate R7, which contained unilocular adipocytes with generally dim GFP expression. (C) Representative BF, SSC and GFP images for events in gates R4-R7.
A PCR-based strategy for quantitation of BMP-derived adipocyte production
The low expression of GFP in BMP-derived adipocytes and the absence of detectable tdTomato expression in a substantial proportion of donor fat cells highlighted the need for supplemental methods to detect marker genes when corresponding protein expression is minimal or absent. Other laboratories have used PCR-based strategies to detect the trafficking and/or engraftment of genetically labeled circulating cells into target tissues when cell numbers or marker gene expression was low.Citation22-Citation27 The key to using this technique to detect genetically labeled adipocytes was the removal of stromal contaminants, which may also harbor the marker gene, by flow sorting prior to PCR. Our strategy began with staining free-floating adipocytes with a cocktail of phycoerythrin (PE)-conjugated antibodies to stromal lineage markers including monocyte/myeloid cells (CD11b, CD14, Gr-1 and F4/80), T and B lymphocytes (Thy1 and B220, respectively), red blood cells (Ter119), endothelial cells (Flk-1), smooth muscle cells (integrin α7) and neurons (NCAM). During sorting, adipocytes larger (forward scatter) and with greater internal complexity (side scatter) than stromal cells were gated for collection (). From this population, singlet discrimination was used to exclude cell clusters that might contain stromal cells adhering to adipocytes. Finally, any remaining lineage positive stromal cells were excluded based upon PE fluorescence. Collection mode was set to “Purify 1” to further exclude contaminants based on their position in the droplet queue.
Figure 6. PCR-based strategy to detect BMP-derived adipocytes among adipocytes purified by flow sorting. Gonadal adipose tissue was harvested from aP2cremT/mG mice prior to, immediately after and 2 mo after tamoxifen exposure. The fat was digested with collagenase and separated into adipocyte and stromal fractions. Adipocytes were stained with a cocktail of PE-conjugated antibodies to stromal lineage markers and flow sorted to remove stromal contaminants. (A) Gating strategy to remove stromal cells from adipocytes. Left panel shows adipocyte FSC vs SSC distribution overlayed on stromal distribution. Adipocytes with FSC/SSC greater than stromal cells were subjected to singlet discrimination (middle panel) to exclude cell clusters. Lineage positive events were excluded from lineage negative adipocytes as shown in the histogram (right panel). (B) The sorting strategy was validated by PCR analysis of DsRed and GAPDH genes in the adipocyte and stromal fractions. Tam, tamoxifen. No DsRed was detected in flow sorted adipocytes immediately following tamoxifen treatment indicating no significant stromal contamination. (C) The PCR strategy was used to assess BMP-derived adipocyte production in gonadal and subcutaneous (SubQ) fat from male and female LysMcreROSAflox/STOP mice at 3 and 11 mo. Primers sets were created to distinguish the spliced LacZ gene in BMP-derived adipocytes vs. the intact PGKneo gene in conventional adipocytes. Analysis indicates higher numbers of BMP-derived adipocytes in gonadal vs. subcutaneous adipose tissue and in female vs. male subjects. Comparison of the 3 and 11 mo male samples demonstrates increasing BMP-derived adipocytes in gonadal fat over time.
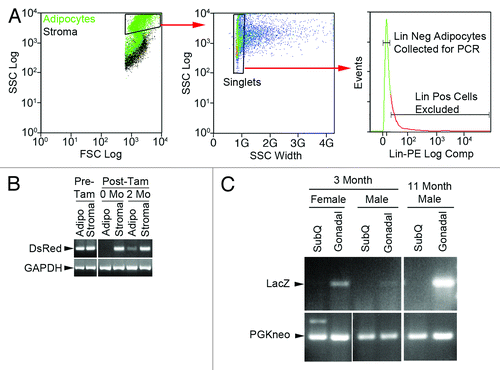
To validate this procedure we collected putative contaminant-free adipocytes and stromal cells from dual transgenic mice in which the adipocyte-specific aP2 gene promoter controlled expression of a tamoxifen-inducible cre recombinase, and which also carry a floxed DsRed marker gene. Cells were collected before and after tamoxifen treatment to induce excision and loss of the DsRed in extant adipocytes. Prior to tamoxifen treatment, PCR analysis detected the DsRed gene in both adipocyte and stromal fractions (). Immediately after tamoxifen treatment, DsRed was only detected in stroma. However, 2 mo post-tamoxifen, a weak DsRed signal was observed in the adipocyte fraction, presumably due to the production of new adipocytes from DsRed-competent progenitor cells. The complete absence of a DsRed signal in adipocytes immediately following tamoxifen exposure demonstrates that flow purified adipocytes are essentially free of stromal contaminants.
Next, we used PCR to monitor BMP-derived adipocyte production among fat cells isolated from LysMcre-ROSAflox/STOP mice by flow cytometry to exclude stromal contaminants. PCR primers were designed to detect the intact floxed PGKneo gene present in conventional adipocytes or the spliced LacZ gene present after excision of the PGKneo gene present in BMP-derived adipocytes. We found that BMP-derived adipocyte production was greater in gonadal fat than subcutaneous adipose tissue and higher in female than male fat (). Marrow-derived adipocyte numbers increased over time (compare 3 vs 11 mo male gonadal signals). These data matched our previous flow cytometric analysis showing that BMP-derived adipocyte production is depot- and gender-specificCitation13 and highlight the utility of this technique in assessing adipocyte production.
In vivo imaging demonstrates time-dependent generation of BMP-derived adipocytes
Friedman and colleaguesCitation28 used in vivo imaging to follow the production of adipocytes from putative progenitors implanted into high fat fed mice. Taking a cue from these studies, we tested whether this technique would detect production of adipocytes from transplanted marrow in live mice over time. The Friedman group used preadipocytes from mice in which luciferase expression was controlled by the leptin gene promoter. Since leptin expression is not restricted to adipocytes, but also occurs in placenta,Citation29 stomach,Citation30 skeletal muscle,Citation31 heart,Citation32 liverCitation33 and tendon,Citation34 and leptin RNA is present in many cells and tissues,Citation35 we elected to obtain BM from donors in which firefly luciferase expression was targeted to adipocytes (and macrophages) by the aP2/FABP4 gene promoter. BM from these mice was transplanted into irradiated wild type recipients and light emission was followed at 1–2 week intervals as an index of adipocyte production. shows no light emission in transplant-naïve mice, but intense light production in the donor mice with highest levels localized adjacent to visceral fat depots. We also observed increasing light emission in the recipients indicative of adipogenesis from the transplanted marrow cells. Adipocyte production from marrow progenitors was initially observed adjacent to the gonadal and axillary fat depots (week 4) and thereafter became broadly distributed. By 12–16 weeks, the highest levels were detected in the lower abdomen adjacent to the gonadal depots ( and ). Maximal luciferase expression was measured at each time and compared with maximal emission in donor mice, and reached 15% of donor levels 16 weeks post-transplant (). Immunohistochemistry revealed clusters of luciferase+ adipocytes in sections of adipose tissue from transplant recipients ().
Figure 7. In vivo imaging detects BMP-derived adipocyte production in live mice over time. Eight week female wild type mice were transplanted with BM from mice in which luciferase expression was targeted to adipocytes (aP2creR26LSLLuciferase). At two week intervals post-transplant luciferase activity (light emission) was measured in the recipients in an IVIS Imaging System 50 and data was acquired and analyzed with Living Image 3.0 software. (A) Representative luminescence images of untransplanted control, luciferase BM donor and BMT recipients at 4, 8, 12 and 16 weeks post-transplant. All images are at the same scale. (B) Luminescence measured in a BMT recipient mouse 16 weeks post-transplant. Scale is expanded to emphasize distribution and localization of the luminescence signal. (C) Average (n = 4) maximal luminescence vs. time measured in the region above the gonadal fat pads as a percentage of the maximal signal measured in BM donors. (D) Gonadal fat from a mouse transplanted with BM from an aP2creLSL-Luciferase donor was harvested 16 weeks post-transplant. Tissue was fixed, embedded, sectioned and immunohistochemistry was performed with anti-luciferase antibodies. Representative phase contrast and fluorescence overlay (red, luciferase; blue, DAPI) images are shown. (E) Gonadal adipose tissue was harvested from BM donors and transplant recipients and digested with collagenase. Adipocytes and stromal cells were separated by flotation/centrifugation and stroma was further separated into CD11b positive and negative fractions with antibody-conjugated magnetic beads. Cells were lysed and luciferase activity measured in a Turner Biosystems 20/20 luminometer. Luciferase activity in each fraction is shown as a percentage of total activity in each depot (n = 6). (F) Untransplanted and BM transplanted animals were injected with luciferin and gonadal and dorsal fat pads were harvested. Luminescence of the fat pads was measured in the IVIS 50 imager and is shown on the same scale.
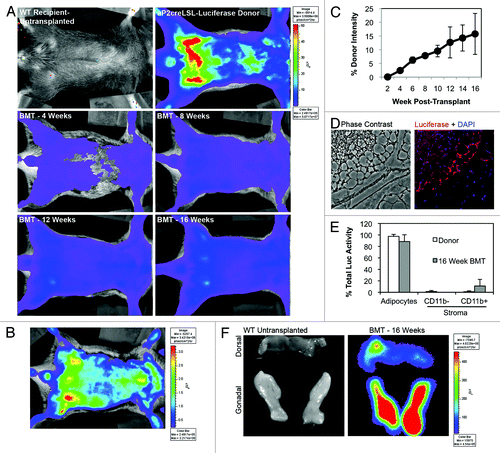
Expression of the aP2 gene in some macrophages could be a confounding factor in these studies. To address this issue we excised gonadal and dorsal fat from transplant recipients at the end of the study. The fat was digested and separated into adipocyte and stromal fractions, and the stromal fraction was further separated into myeloid (CD11b+) and non-myeloid (CD11b−) subfractions. Luciferase activity was greatest in the adipocyte fraction, comprising over 90% of the total depot luciferase activity in donor and recipient mice at all times (). Since adipocyte fractions contain less than 0.02% stromal contaminants the light emission in the recipient mice is primarily due to BMP-derived adipocyte and not stromal myeloid cells. Finally, luciferase levels were measured in adipocytes from excised gonadal and dorsal fat pads. Imaging of excised fat pads immediately after whole body imaging confirmed greater enzyme activity in gonadal fat compared with dorsal adipose tissue ().
Discussion
Detection of BMP-derived adipocytes may be impeded by variable marker gene expression
We previously reported the specification of adult adipocyte lineages from progenitor cells of BM origin.Citation12 Competitive adoptive transfer experiments and fate mapping revealed that the progenitors for these adipocytes were cells of the hematopoietic/myeloid lineage.Citation13 However, technical challenges have impeded the replication of these results by other laboratories, limiting our understanding of this novel and unique cell population.
Since many marker genes display variegated expression even within cells of the same type, we suspected that low or variegated marker expression in BMP-derived adipocytes might account for the disparate results. Indeed, our current results show that GFP and tdTomato fluorescence is highly variable in adipocytes. The absence or variable levels of fluorescent proteins is not the result of cell death and/or lysis. We previously demonstrated that adipocytes remain intact following collagenase digestion of adipose tissue and centrifugation/flotation to separate the buoyant fat cells from stromal cells and debris by staining free-floating adipocytes with the cell-permeable nuclear stain, Hoechst 33342 (see Supplemental Figure S2F in ref. Citation13). This allowed us to discriminate between intact cells containing a nucleus, and cell debris and free lipid droplets lacking nuclei. Flow cytometry showed that over 99% of the “events” exhibited Hoechst fluorescence, indicating that the adipocytes were intact. This was further confirmed here by staining of adipocytes with DHE, which showed that the vast majority of the cells were not only intact but also metabolically active (). also shows that lipid droplets (LipidTOX staining) in our fractions are associated with single nuclei (DAPI staining) regardless of Tomato fluorescence, showing that the absence or variable levels of Tomato are not the result of cell lysis.
It is also worth noting that GFP+ adipocytes are not the result of fusion between GFP+ stromal cells and GFP− adipocytes. This was previously demonstrated by XY chromosome analysis of flow isolated GFP+ adipocytes from GFP− female mice transplanted with GFP+ BM from male donors. All nuclei were male rather than a mixture of male and female that would have resulted from the fusion of GFP+ male BM cells and GFP− female adipocytes (see Fig. 1D in ref. Citation13).
Evidence for variable GFP expression in adipocytes can also be seen in data reported by the GraffCitation36 and HotamisligilCitation14 laboratories. For example, the Graff group expressed GFP in adipocytes under the control of the PPARγ gene promoter, which is presumably expressed in all mature adipocytes. However, GFP fluorescence in their adipocytes spanned five decades of fluorescence intensity during flow cytometry, with a substantial number of cells exhibiting little or no GFP fluorescence (see Fig. 1A in ref. Citation36). Likewise, the Hotamisligil group performed BM transplant studies using UbqC-GFP mice as donors. A substantial number of adipocytes in their donor mice were also negative for GFP fluorescence (see Fig. 2D in ref. Citation14). In our hands, GFP fluorescence in marrow-derived adipocytes was generally lower than the bulk adipocyte population in donor mice and much lower than GFP+ stromal cells. Efficient detection of tdTomato was also obviated by the complete absence of detectable protein in a significant portion of adipocytes carrying the gene. Here we assessed several sensitive techniques and marker models for the improved detection of BMP-derived adipocytes.
New models and detection techniques confirm production of BMP-derived adipocytes
First, confocal microscopy with simultaneous spectrum acquisition was used to detect adipocytes produced from GFP+ marrow cells and distinguish them from autofluorescent cells. The inherent sensitivity of confocal microscopy facilitates detection and identification of GFPDIM BMP-derived adipocytes. Spectra acquired from putative GFP-labeled cells showed a single sharp peak that coincided with the emission maximum of GFP, while little to no fluorescence detected at wavelengths spanning the broad region of emission due to reduced pyridine nucleotides and oxidized flavins. Thus, confocal microscopy combined with spectral detection and analysis provides a sensitive method for detecting BMP-derived adipocytes and confirming expression of fluorescent markers.
Second, we examined the suitability of imaging flow cytometry for studying BMP-derived adipocytes. This technique combines the sensitive fluorescence and direct imaging capabilities of confocal microscopy with the ability to quickly measure multiple parameters across a large population of cells. Our results show intact unilocular and multilocular GFP+ adipocytes in the flow stream that are easily distinguished from cell debris. The debris was likely the result of cell lysis during shipping from Denver, CO to Seattle, WA rather than lysis during imaging flow cytometry as the flow cell in the ImageStreamX system is 250 μm × 750 μm and has a nominal pressure of 1 psi in contrast to high pressure conventional flow cytometers with smaller diameter flow cells. Importantly, these results demonstrate for the first time that flow cytometry of adipocytes is possible in spite of their large size and fragility.
Third, we developed a PCR-based method to detect marker genes in flow-sorted adipocytes. This technique was developed in response to the observation that a substantial number of adipocytes in donor tdTomato mice (in which all cells carry the gene) had no detectable Tomato fluorescence. Similar techniques have been used commonly to follow trafficking and engraftment of circulating populations to various healthy and damaged tissues.Citation22-Citation27 The key to its successful application to the measurement of BMP-derived adipocyte production is the ability to exclude lineage+ stromal cells from lineage− adipocytes by flow sorting. Appropriate gating during sorting also excludes stromal cells based on their small size (forward scatter) as well as events containing adherent cell clusters (singlet discrimination). With this method we could demonstrate complete loss of floxed DsRed in adipocytes containing a tamoxifen-inducible cre recombinase. The data also validate our previous results by showing time-dependent increase in marker levels, with higher levels in gonadal rather than subcutaneous fat and higher levels in female rather than male fat. The technique is applicable to any marker, even non-fluorescent or non-enzymatic markers, and should provide a widely accessible means of studying BMP-derived adipocytes.
Finally, in vivo imaging was tested as a means of measuring BMP-derived adipocyte production in live animals over time. Non-invasive imaging of marrow recipients showed time dependent increases in luciferase levels indicative of new adipocyte production from BM progenitors. Direct measurement of luciferase activity in fractionated adipose tissue showed that the bulk of the enzyme was indeed restricted to the adipocyte fraction rather than stromal or circulating populations. These four techniques/models add to the arsenal of methods available for the detection and study of BMP-derived adipocytes ().
Table 1. Methods and models for detection of BMP-derived adipocytes
BMP-derived adipocytes are produced in numbers sufficient to regulate adipose tissue function
In previous experiments we typically found that 5–10% of the total gonadal adipocyte population was of marrow origin by 8 weeks post-transplantation in otherwise untreated mice. Levels over 20% were observed in ROSI-treated mice. Our current studies indicate that BMP-derived adipocyte numbers continue to increase over time, reaching 15–25% of total gonadal adipocyte numbers by 16 weeks post-transplant or after birth regardless of model or detection method. The presence of substantial numbers of BMP-derived adipocytes in visceral fat is likely to have an increasingly significant impact on the physiology of this depot.
However, even modest production of adipocytes from marrow progenitors may affect adipose tissue function in depots where their numbers are lower. Low level engraftment (typically less than 1%) of exogenous progenitors and stem cells has been shown to contribute to regeneration of ischemic cardiac muscle and vascular endothelium,Citation37 repair hepatic sinusoidal endothelial cells after liver injury,Citation38 prevent bone loss in ovariectomized mice,Citation39 elicit repair and reduce inflammation in the kidneyCitation40-Citation44 and contribute to muscle regeneration following chemical damage.Citation45-Citation47 Likewise, modest progenitor engraftment in the lung has been shown to repair smoke-induced emphysema in rats,Citation48 prevent hyperoxia-induced alveolar growth arrest in rats,Citation49 promote alveolar-capillary membrane repair and reduce edema, inflammation and hemorrhage in endotoxin-induced acute lung injuryCitation42-Citation44 and contribute to repopulation of damaged airway epithelium in mice and humans.Citation50,Citation51 Thus, in spite of meager engraftment, exogenous progenitors are capable of producing profound changes in target tissues, presumably via paracrine regulation of tissue inflammation and the growth and differentiation of endogenous cells.Citation39,Citation52,Citation53 We speculate that even low level engraftment of BMP-derived adipocytes may have significant paracrine effects on adipose tissue, especially through the production of inflammatory factors.Citation13
The significant impact of progenitor cells on target tissues even with low engraftment highlights the importance of elucidating their origin, trafficking and recruitment and differentiation pathways. Low progenitor cell numbers combined with variegated marker gene expression undoubtedly complicate tracking and identifying these cells. The techniques presented here should be useful alone or in combination for studying non-tissue resident adipocyte progenitors.
Challenges in the detection of BMP-derived adipocytes
The controversy over detection of BMP-derived adipocytes by various groups mirrors in many ways the controversy regarding transdifferentiation vs. cell fusion in the engraftment of marrow progenitors into pulmonary epithelium. A number of laboratories reported production of either type I or II pneumocytes in the lungs of mice transplanted with labeled BM.Citation50,Citation51,Citation54-Citation56 Concurrently, other laboratories either failed to detect engraftment of BM cells into lung epithelium or showed that engrafting cells lacked an epithelial phenotype.Citation57,Citation58 In reviewing the literature, KrauseCitation59,Citation60 noted that successful detection of epithelial cells arising from marrow progenitors may hinge on several technical considerations including (1) variegated expression of marker genes, (2) selection of appropriate promoters to drive marker gene expression in progenitor or terminal cell populations, (3) selection of appropriate progenitor cells, (4) availability of reagents and techniques for sensitive detection of genetic markers and (5) tissue preparation and cell isolation. To this list, we would add adipose-specific considerations including (1) mouse strain differences in adiposity and adipocyte production, (2) differences in the adipogenic environment between regional fat depots and (3) the impact of diet composition and feeding regimens on adipocyte production. Clearly, there are a number of potential hurdles that may preclude production of BMP-derived adipocytes in certain models or their easy detection.
Another consideration is that engraftment of hematopoietic/myeloid cells is a highly regulated process. This is exemplified by engraftment of BM cells into skeletal muscle via fusion,Citation61 lung endotheliumCitation62 and epithelium,Citation51,Citation56,Citation63 liverCitation64 and cardiac muscleCitation37 only following substantial tissue injury or genetic disease. Likewise, engraftment of marrow cells into skeletal muscle can be increased almost 8-fold by targeted delivery of insulin-like growth factor-1.Citation65 Thus, a permissive niche is required for the recruitment and terminal differentiation of marrow progenitors in many tissues. This concept applies to BMP-derived adipocytes, which are produced in greater numbers in female than male mice, and in gonadal rather than subcutaneous fat. Their preferential production indicates specificity in their recruitment and/or engraftment, most likely due to regional differences in the adipose microenvironment. This suggests that the generation of BMP-derived adipocytes may be inhibited or blocked in certain models further adding to the controversy over their production.
In conclusion, production of adipocytes from BM progenitors has been demonstrated using several models and techniques.Citation12,Citation13 While these results were of great interest, they were also a source of controversy. Here we have addressed some technical pitfalls underlying the confounding results and provided an assessment of several models and techniques for the reliable detection of BMP-derived adipocytes. Ongoing studies with these techniques are focused on understanding how production of these fat cells is regulated in a sex- and depot-specific manner. Clues from these studies may pave the way to strategies to increase or decrease BMP-derived adipocyte production and facilitate their detection and define their impact on adipose biology.
Materials and Methods
Animal models
Wild type C57Bl/6; C57Bl/6-Tg(UBC-GFP)30Scha/J (UbqC-GFP); B6.Cg-Tg(Fabp4-cre)1Rev/J (aP2cre); Gt(ROSA)26Sortm4(ACTB-tdTomato,-EGF P)Luo/J (mT/mG); B6.129P2-Lyz2tm1(cre)Ifo/J (LysMcre); B6.C3-Tg(CAG-DsRed,-EGFP)5Gae/J (IRG); B6.129S4-Gt(ROSA)26Sortm1Sor/J (ROSAflox/STOP); and B6.129X1-Gt(ROSA)26Sortm1(EYFP)Cos/J (R26-stop-EYFP) mice were purchased from The Jackson Laboratory. B6.129-Gt(ROSA)26Sortm2(ACTB-Luc)Tyj (LSL-Luciferase) mice were obtained from the NCI Mouse Repository and aP2creERT2 mice were provided by Pierre Chambon (University of Strasbourg). Mice with myeloid-targeted LacZ or EYFP were generated by mating LysMcre mice to ROSAflox/STOP or R26-stop-EYFP mice, respectively. Mice with adipocyte targeted luciferase expression were generated by mating aP2cre mice to LSL-Luciferase mice. Mice in which tamoxifen-induction results in loss of DsRed in adipocytes were generated by mating aP2creERT2 mice with IRG mice. Offspring hemizygotic at both alleles were used in these studies. All animal studies and procedures were performed under a protocol approved by the Institutional Animal Care and Use Committee of the University of Colorado Anschutz Medical Campus.
General methods
BM transplant procedures, conventional flow cytometry and flow sorting, adipose tissue fractionation and fluorescence microscopy were described in references Citation12 and Citation13.
Staining of adipocytes with DAPI, LipidTOX Green or dihydroethidium (DHE)
Adipose tissue was digested with collagenase and adipocytes were separated from stromal cells by flotation and centrifugation. Buoyant adipocytes were transferred to a clean tube and fixed with 4% paraformaldehyde in phosphate-buffered saline (PBS) for 20 min at room temperature. The fat cells were then transferred to another clean tube and fresh PBS was added with gentle mixing. After the adipocytes accumulated at the top of the liquid, they were transferred to another fresh tube and washed with PBS as just described two more times.
The cells were then incubated in a 1:200 dilution of HCS LipidTox Green (Life Technologies) for 20 min at room temperature. DAPI was added to a final concentration of 3.75 ng/ml and incubation continued for another 10 min. The cells were then washed as described above and then examined by fluorescence microscopy.
DHE was purchased from Life Technologies and dissolved in DMSO at 5 mM. This stock solution was added directly to non-fixed adipocyte fractions to a final concentration of 10 μM for 30 min at room temperature with occasional gentle mixing. The cells were then washed as described above and then examined by flow cytometrys.
Tamoxifen treatment of mice
Tamoxifen (T5648, Sigma) was dissolved in 100% ethanol to a concentration of 100 mg/ml by heating at 65°C for 5–10 min. This stock solution was diluted 10-fold in sesame oil for mouse injections. Each mouse received 2 mg/day (IP) on three consecutive days.
Polymerase chain reaction
DNA was extracted from flow-sorted adipocytes using DNeasy Blood and Tissue Kit reagents and columns (Qiagen). A common forward primer of sequence 5′-CAGTAGTCCAGGGTTTCCTTGATG-3′ was used for PCR of LacZ and PGKneo genes. The reverse primer 5′- ACTGTTGGGAAGGGCGATCGG-3′ was used PCR of LacZ and the reverse primer 5′-GCGCATGCTCCAGACTGCCTTG-3′ was used for amplification of PGKneo. Genomic DNA was amplified with RED Extract n AMP reagent (R4775, Sigma) in reactions containing 500 nM of each of the appropriate forward and reverse primers. A touch-down protocol was used in which the annealing temperature was lowered from 70°C to 60°C in 0.5°C increments per cycle. Annealing was performed for 45 sec and the other parameters included denaturation at 94°C for 1 min and elongation at 72°C for 2 min. Following the series of touchdown cycles, an additional 32 cycles were performed with the 60°C annealing conditions. The forward primer 5′-GTAATGCAGAAGAAGACTATGGGCTGGGAG-3′ and the reverse primer 5′- ATGTCCAGCTTGGAGTCCACGTAGTAGTAG-3′ were used for PCR of DsRed. The forward primer 5′-TACTCCGCGGCTTTACGGGTG-3′ and the reverse primer 5′-TGGAACAGGGAGGAGCAGAGAGCAC-3′ were used to amplify GAPDH. PCR was performed with denaturation at 94°C for 1 min, annealing at 63°C for 45 sec and elongation at 72°C for 2 min for 31 cycles.
Depletion of lineage positive stromal cells from adipocytes
Adipose tissue was digested with collagenase and adipocytes were separated from stromal cells by flotation and centrifugation. Buoyant adipocytes were transferred to a clean tube and PE-conjugated antibodies to lineage-specific cell surface markers were added to a final concentration of 0.25 μg/107 cells. Antibodies were targeted to myeloid cells (CD11b, BD PharMingen, 557397), T lymphocytes (CD3, BioLegend, 100205), B lymphocytes (B220, BioLegend, 103207), granulocytes (Gr-1, BioLegend, 108407), red blood cells (Ter119, BioLegend, 116207), endothelial cells (Flk-1, BioLegend, 136403), smooth muscle cells (Integrin a7, MBL International, K0046-5) and the pan-leukocyte marker, CD45 (BD PharMingen, 553081). Adipocytes were incubated with all antibodies simultaneously for 20 min at room temperature with gentle mixing every 5 min.
Adipocytes were sorted using a Moflo XDP cell sorter with Summit 4.3 software (Beckman Coulter). A 100 micron nozzle tip was used with a sheath pressure of 30 psi and a drop drive frequency of 46,700 Hz and amplitude of 15 V. The sheath fluid consisted of Isoflow (Beckman Coulter). The sample and collection tubes were maintained at 5°C using an attached Haake recirculating water bath. To keep cells in suspension the Moflo was equipped with a SmartSampler sample station with the sample agitation set to maintain an agitation cycle of 4 sec on and 5 sec off. The sample flow rate was set to a pressure differential of less than 0.4 psi. GFP+ cells were collected using a 530/40 bandpass filter and PE was detected at 570/40. Sort mode was set to Purify 1. Forward angle light scatter and side light scatter were collected using log scales. Appropriate signal compensation was set using single color control samples.
Adipocytes were initially distinguished from smaller stromal cells based on their distinct forward scatter and side scatter characteristics. Singlet discrimination was used to isolate individual cells from cell cluster and aggregates. Finally, adipocytes devoid of lineage markers were collected for further analysis.
Confocal microscopy and spectral analysis
Gonadal adipocytes from female mice transplanted with BM from male UbqC-GFP donors were placed on coverslips and covered to prevent evaporation of buffer. Initial DIC and confocal imaging was performed on a Zeiss Axiovert 200M microscope equipped with an LSM 510 META confocal system. A 30 mW argon laser set at 488 nm was used for fluorescence excitation. Zen software was used for image processing and analysis.
Subsequent imaging and spectral analysis was conducted on a Nikon A1R-si spectral imaging system mounted on an Eclipse Ti microscope. Samples were excited with a laser set at 488 nm and 32 channel spectra were acquired with 6 nm resolution from 490–683 nm. Spectral analysis and unmixing were performed with NIS Elements software.
Imaging cytometry
Gonadal adipocytes from female mice transplanted with BM from male UbqC-GFP donors were fixed for 20 min in phosphate buffered saline (PBS) containing 4% paraformaldehyde at room temperature with occasional mixing. The cells were then transferred to PBS and placed in an insulated container with refrigerator cool packs for overnight shipment to Amnis Corporation.
At Amnis, “Speed Beads” were added to each sample for synchronization of the detectors and flow parameters. Data was acquired on an ImageStream X cytometer for brightfield (BF) in channel 1, side scatter (SSC) in channel 6 and GFP fluorescence in channel 2 using LED trans-illumination, 2 mW 785 nm and 100 mW 488 nm lasers, respectively. Gating parameters were determined post-hoc by IDEAS software with preliminary gating to separate intact cells (R1) from cell debris (R2) and synchronization beads (R3). Images of cells with best focal quality were gated using a metric for image clarity (Gradient RMS of the BF image). Single color controls were used to create a compensation matrix that was applied to all sample files. Following data acquisition, three event types (unilocular cells, multilocular cells and cell debris) were observed in the brightfield imagery. Approximately 25 events of each type were used to create “true” populations and IDEAS software was used to compare the mean value for 25 gating features between the “true” populations. The Rd values for each feature were ranked from highest to lowest, and the features with highest Rd were selected for further gating to distinguish the true populations.
In vivo imaging and luciferase assays
Luciferase activity was measured in wild type mice, aP2creLSLLuciferase marrow donor mice and recipient mice transplanted with luciferase-expressing BM in an IVIS Imaging System 50 (Caliper Life Sciences). Animals were lightly anesthetized with pentobarbital (65 mg/kg, I.P.) and injected with D-luciferin (120 mg/kg, 100 μl retroorbital). Measurements were initiated 3 min after luciferin injection and luminescence was integrated over 1 min. At the end of the study, mice were euthanized immediately after whole body imaging. Gonadal and dorsal fat pads were quickly harvested and returned to the imager for analysis of isolated fat pad luminescence. Data were processed with Living Image 3.0 software.
Adipose tissue was digested with collagenase and separated into adipocytes and stromal fractions by flotation/centrifugation. Adipocytes were transferred to a clean tube and stored at −80°C. Stromal cells were resuspended in Hank’s buffered salts solution and incubated with magnetic beads linked to anti-CD11b antibodies, washed and separated into CD11b positive and negative subfractions as directed by the manufacturer of the bead/magnet system (Miltenyi Biotec, Inc.) and stored at −80°C until use.
Luciferase activity in the tissue fractions was assayed with the Luciferase Assay System with Cell Culture Lysis Reagent (Promega Corp.). Thawed adipocytes were mixed a volume of lysis reagent equal to the adipocyte suspension and incubated on ice for 10 min. The mixture was then centrifuged at 16,000 × g for 10 min and the subnatant transferred to a clean tube. Thawed stromal cells were mixed with 50 μl of lysis reagent and lysates prepared as for adipocytes. Luciferase activity in 20 μl of lysate was measured on a Turner Biosystems 20/20 luminometer.
Luciferase immunohistochemistry
Five micrometer sections of paraformaldehyde-fixed, paraffin-embedded adipose tissue were deparaffinized with CitriSolv (Fisher Scientific) and rehydrated in a graded ethanol/water series. Sections were subjected to antigen retrieval in citrate buffer in a microwaveable pressure cooker for 15 min. Sections were blocked with PBS containing 5% horse serum (HS) for 30 min at room temperature. The sections were incubated overnight in PBS/5% HS at 4°C with the primary antibodies to firefly luciferase (ab81823, 1:1,500, Abcam). The sections were then washed and incubated with the Alexa Fluor 555-conjugated secondary antibodies for 1 h at room temperature.
Acknowledgments
This research was funded by and NIH RO1 grant DK078966 to D.J.K. We are grateful to Dr Yaakov Barak (University of Pittsburgh) for reading this manuscript and providing useful comments. We also thank Ben Alderete and Tad George of Amnis Corporation for arranging for imaging flow cytometry of our samples at the Seattle facility.
Disclosure of Potential Conflicts of Interest
S.M.M., H.L.M., T.S., P.F.K., M.W.-E., R.N., R.M., P.C. and D.J.K. are not affiliated with or compensated by any of the commercial institutions mentioned in this paper and therefore report no conflict of interest. R.K. is an employee of Amnis Corporation, an EMD-Millipore Company, and S.A.M. and J.A.D. are employees of Nikon Instruments, Inc. and received no compensation from the Klemm Laboratory for their participation in this study.
References
- Bahceci M, Gokalp D, Bahceci S, Tuzcu A, Atmaca S, Arikan S. The correlation between adiposity and adiponectin, tumor necrosis factor alpha, interleukin-6 and high sensitivity C-reactive protein levels. Is adipocyte size associated with inflammation in adults?. J Endocrinol Invest 2007; 30:210 - 4; PMID: 17505154
- Engfeldt P, Arner P. Lipolysis in human adipocytes, effects of cell size, age and of regional differences. Horm Metab Res Suppl 1988; 19:26 - 9; PMID: 3069692
- Bays HE, González-Campoy JM, Bray GA, Kitabchi AE, Bergman DA, Schorr AB, et al. Pathogenic potential of adipose tissue and metabolic consequences of adipocyte hypertrophy and increased visceral adiposity. Expert Rev Cardiovasc Ther 2008; 6:343 - 68; http://dx.doi.org/10.1586/14779072.6.3.343; PMID: 18327995
- Després JP. Is visceral obesity the cause of the metabolic syndrome?. Ann Med 2006; 38:52 - 63; http://dx.doi.org/10.1080/07853890500383895; PMID: 16448989
- Wajchenberg BL, Giannella-Neto D, da Silva MER, Santos RF. Depot-specific hormonal characteristics of subcutaneous and visceral adipose tissue and their relation to the metabolic syndrome. Horm Metab Res 2002; 34:616 - 21; http://dx.doi.org/10.1055/s-2002-38256; PMID: 12660870
- Tchkonia T, Giorgadze N, Pirtskhalava T, Tchoukalova Y, Karagiannides I, Forse RA, et al. Fat depot origin affects adipogenesis in primary cultured and cloned human preadipocytes. Am J Physiol Regul Integr Comp Physiol 2002; 282:R1286 - 96; PMID: 11959668
- Tchkonia T, Giorgadze N, Pirtskhalava T, Thomou T, DePonte M, Koo A, et al. Fat depot-specific characteristics are retained in strains derived from single human preadipocytes. Diabetes 2006; 55:2571 - 8; http://dx.doi.org/10.2337/db06-0540; PMID: 16936206
- Franck N, Stenkula KG, Ost A, Lindström T, Strålfors P, Nystrom FH. Insulin-induced GLUT4 translocation to the plasma membrane is blunted in large compared with small primary fat cells isolated from the same individual. Diabetologia 2007; 50:1716 - 22; http://dx.doi.org/10.1007/s00125-007-0713-1; PMID: 17572871
- Skurk T, Alberti-Huber C, Herder C, Hauner H. Relationship between adipocyte size and adipokine expression and secretion. J Clin Endocrinol Metab 2007; 92:1023 - 33; http://dx.doi.org/10.1210/jc.2006-1055; PMID: 17164304
- Billon N, Iannarelli P, Monteiro MC, Glavieux-Pardanaud C, Richardson WD, Kessaris N, et al. The generation of adipocytes by the neural crest. Development 2007; 134:2283 - 92; http://dx.doi.org/10.1242/dev.002642; PMID: 17507398
- Seale P, Bjork B, Yang W, Kajimura S, Chin S, Kuang S, et al. PRDM16 controls a brown fat/skeletal muscle switch. Nature 2008; 454:961 - 7; http://dx.doi.org/10.1038/nature07182; PMID: 18719582
- Crossno JT Jr., Majka SM, Grazia T, Gill RG, Klemm DJ. Rosiglitazone Promotes Differentiation of Bone Marrow-Derived Circulating Progenitor Cells to Multilocular Adipocytes in Adipose Tissue. J Clin Invest 2006; 116:3220 - 8; http://dx.doi.org/10.1172/JCI28510; PMID: 17143331
- Majka SM, Fox KE, Psilas JC, Helm KM, Childs CR, Acosta AS, et al. De novo generation of white adipocytes from the myeloid lineage via mesenchymal intermediates is age, adipose depot, and gender specific. Proc Natl Acad Sci U S A 2010; 107:14781 - 6; http://dx.doi.org/10.1073/pnas.1003512107; PMID: 20679227
- Furuhashi M, Fucho R, Görgün CZ, Tuncman G, Cao H, Hotamisligil GS. Adipocyte/macrophage fatty acid-binding proteins contribute to metabolic deterioration through actions in both macrophages and adipocytes in mice. J Clin Invest 2008; 118:2640 - 50; PMID: 18551191
- Koh YJ, Kang S, Lee HJ, Choi T-S, Lee HS, Cho C-H, et al. Bone marrow-derived circulating progenitor cells fail to transdifferentiate into adipocytes in adult adipose tissues in mice. J Clin Invest 2007; 117:3684 - 95; http://dx.doi.org/10.1172/JCI32504; PMID: 18060029
- Tomiyama K, Murase N, Stolz DB, Toyokawa H, O’Donnell DR, Smith DM, et al. Characterization of transplanted green fluorescent protein+ bone marrow cells into adipose tissue. Stem Cells 2008; 26:330 - 8; http://dx.doi.org/10.1634/stemcells.2007-0567; PMID: 17975222
- Bao-Cutrona M, Moral P. Unexpected expression pattern of tetracycline-regulated transgenes in mice. Genetics 2009; 181:1687 - 91; http://dx.doi.org/10.1534/genetics.108.097600; PMID: 19204377
- Martin DI, Whitelaw E. The vagaries of variegating transgenes. Bioessays 1996; 18:919 - 23; http://dx.doi.org/10.1002/bies.950181111; PMID: 8939070
- Ramunas J, Montgomery HJ, Kelly L, Sukonnik T, Ellis J, Jervis EJ. Real-time fluorescence tracking of dynamic transgene variegation in stem cells. Mol Ther 2007; 15:810 - 7; PMID: 17285140
- Swenson ES, Price JG, Brazelton T, Krause DS. Limitations of green fluorescent protein as a cell lineage marker. Stem Cells 2007; 25:2593 - 600; http://dx.doi.org/10.1634/stemcells.2007-0241; PMID: 17615263
- Billinton N, Knight AW. Seeing the wood through the trees: a review of techniques for distinguishing green fluorescent protein from endogenous autofluorescence. Anal Biochem 2001; 291:175 - 97; http://dx.doi.org/10.1006/abio.2000.5006; PMID: 11401292
- Economou JS, Belldegrun AS, Glaspy J, Toloza EM, Figlin R, Hobbs J, et al. In vivo trafficking of adoptively transferred interleukin-2 expanded tumor-infiltrating lymphocytes and peripheral blood lymphocytes. Results of a double gene marking trial. J Clin Invest 1996; 97:515 - 21; http://dx.doi.org/10.1172/JCI118443; PMID: 8567975
- Kim CJ, Khoo JC, Gillotte-Taylor K, Li A, Palinski W, Glass CK, et al. Polymerase chain reaction-based method for quantifying recruitment of monocytes to mouse atherosclerotic lesions in vivo: enhancement by tumor necrosis factor-alpha and interleukin-1 beta. Arterioscler Thromb Vasc Biol 2000; 20:1976 - 82; http://dx.doi.org/10.1161/01.ATV.20.8.1976; PMID: 10938020
- Lee RH, Hsu SC, Munoz J, Jung JS, Lee NR, Pochampally R, et al. A subset of human rapidly self-renewing marrow stromal cells preferentially engraft in mice. Blood 2006; 107:2153 - 61; http://dx.doi.org/10.1182/blood-2005-07-2701; PMID: 16278305
- Moeller F, Nielsen FC, Nielsen LB. New tools for quantifying and visualizing adoptively transferred cells in recipient mice. J Immunol Methods 2003; 282:73 - 82; http://dx.doi.org/10.1016/j.jim.2003.07.007; PMID: 14604542
- Phadke PA, Mercer RR, Harms JF, Jia Y, Frost AR, Jewell JL, et al. Kinetics of metastatic breast cancer cell trafficking in bone. Clin Cancer Res 2006; 12:1431 - 40; http://dx.doi.org/10.1158/1078-0432.CCR-05-1806; PMID: 16533765
- Steinberg D, Khoo JC, Glass CK, Palinski W, Almazan F. A new approach to determining the rates of recruitment of circulating leukocytes into tissues: application to the measurement of leukocyte recruitment into atherosclerotic lesions. Proc Natl Acad Sci U S A 1997; 94:4040 - 4; http://dx.doi.org/10.1073/pnas.94.8.4040; PMID: 9108101
- Rodeheffer MS, Birsoy K, Friedman JM. Identification of white adipocyte progenitor cells in vivo. Cell 2008; 135:240 - 9; http://dx.doi.org/10.1016/j.cell.2008.09.036; PMID: 18835024
- Masuzaki H, Ogawa Y, Sagawa N, Hosoda K, Matsumoto T, Mise H, et al. Nonadipose tissue production of leptin: leptin as a novel placenta-derived hormone in humans. Nat Med 1997; 3:1029 - 33; http://dx.doi.org/10.1038/nm0997-1029; PMID: 9288733
- Bado A, Levasseur S, Attoub S, Kermorgant S, Laigneau JP, Bortoluzzi MN, et al. The stomach is a source of leptin. Nature 1998; 394:790 - 3; http://dx.doi.org/10.1038/29547; PMID: 9723619
- Wang J, Liu R, Hawkins M, Barzilai N, Rossetti L. A nutrient-sensing pathway regulates leptin gene expression in muscle and fat. Nature 1998; 393:684 - 8; http://dx.doi.org/10.1038/31474; PMID: 9641678
- Purdham DM, Zou MX, Rajapurohitam V, Karmazyn M. Rat heart is a site of leptin production and action. Am J Physiol Heart Circ Physiol 2004; 287:H2877 - 84; http://dx.doi.org/10.1152/ajpheart.00499.2004; PMID: 15284063
- Ikejima K, Lang T, Zhang YJ, Yamashina S, Honda H, Yoshikawa M, et al. Expression of leptin receptors in hepatic sinusoidal cells. Comp Hepatol 2004; 3:Suppl 1 S12; http://dx.doi.org/10.1186/1476-5926-2-S1-S12; PMID: 14960164
- Xu JC, Wu T, Wu GH, Zhong ZM, Tang YZ, Chen JT. Leptin expression by heterotopic ossification-isolated tissue in rats with Achilles’ tenotomy. Saudi Med J 2009; 30:605 - 10; PMID: 19417956
- Su AI, Wiltshire T, Batalov S, Lapp H, Ching KA, Block D, et al. A gene atlas of the mouse and human protein-encoding transcriptomes. Proc Natl Acad Sci U S A 2004; 101:6062 - 7; http://dx.doi.org/10.1073/pnas.0400782101; PMID: 15075390
- Tang W, Zeve D, Seo J, Jo A-Y, Graff JM. Thiazolidinediones regulate adipose lineage dynamics. Cell Metab 2011; 14:116 - 22; http://dx.doi.org/10.1016/j.cmet.2011.05.012; PMID: 21723509
- Jackson KA, Majka SM, Wang H, Pocius J, Hartley CJ, Majesky MW, et al. Regeneration of ischemic cardiac muscle and vascular endothelium by adult stem cells. J Clin Invest 2001; 107:1395 - 402; http://dx.doi.org/10.1172/JCI12150; PMID: 11390421
- Harb R, Xie G, Lutzko C, Guo Y, Wang X, Hill CK, et al. Bone marrow progenitor cells repair rat hepatic sinusoidal endothelial cells after liver injury. Gastroenterology 2009; 137:704 - 12; http://dx.doi.org/10.1053/j.gastro.2009.05.009; PMID: 19447108
- Cho SW, Sun HJ, Yang JY, Jung JY, An JH, Cho HY, et al. Transplantation of mesenchymal stem cells overexpressing RANK-Fc or CXCR4 prevents bone loss in ovariectomized mice. Mol Ther 2009; 17:1979 - 87; http://dx.doi.org/10.1038/mt.2009.153; PMID: 19603006
- Wise AF, Ricardo SD. Mesenchymal stem cells in kidney inflammation and repair. Nephrology (Carlton) 2012; 17:1 - 10; http://dx.doi.org/10.1111/j.1440-1797.2011.01501.x; PMID: 21777348
- Yeagy BA, Cherqui S. Kidney repair and stem cells: a complex and controversial process. Pediatr Nephrol 2011; 26:1427 - 34; http://dx.doi.org/10.1007/s00467-011-1789-x; PMID: 21336814
- Araújo IM, Abreu SC, Maron-Gutierrez T, Cruz F, Fujisaki L, Carreira H Jr., et al. Bone marrow-derived mononuclear cell therapy in experimental pulmonary and extrapulmonary acute lung injury. Crit Care Med 2010; 38:1733 - 41; http://dx.doi.org/10.1097/CCM.0b013e3181e796d2; PMID: 20562701
- Mao M, Wang SN, Lv XJ, Wang Y, Xu JC. Intravenous delivery of bone marrow-derived endothelial progenitor cells improves survival and attenuates lipopolysaccharide-induced lung injury in rats. Shock 2010; 34:196 - 204; http://dx.doi.org/10.1097/SHK.0b013e3181d49457; PMID: 20090567
- Prota LF, Lassance RM, Maron-Gutierrez T, Castiglione RC, Garcia CS, Santana MC, et al. Bone marrow mononuclear cell therapy led to alveolar-capillary membrane repair, improving lung mechanics in endotoxin-induced acute lung injury. Cell Transplant 2010; 19:965 - 71; http://dx.doi.org/10.3727/096368910X506845; PMID: 20447341
- Dezawa M, Ishikawa H, Itokazu Y, Yoshihara T, Hoshino M, Takeda S, et al. Bone marrow stromal cells generate muscle cells and repair muscle degeneration. Science 2005; q 309:314 - 7; http://dx.doi.org/10.1126/science.1110364; PMID: 16002622
- Ferrari G, Cusella-De Angelis G, Coletta M, Paolucci E, Stornaiuolo A, Cossu G, et al. Muscle regeneration by bone marrow-derived myogenic progenitors. Science 1998; 279:1528 - 30; http://dx.doi.org/10.1126/science.279.5356.1528; PMID: 9488650
- Sherwood RI, Christensen JL, Weissman IL, Wagers AJ. Determinants of skeletal muscle contributions from circulating cells, bone marrow cells, and hematopoietic stem cells. Stem Cells 2004; 22:1292 - 304; http://dx.doi.org/10.1634/stemcells.2004-0090; PMID: 15579647
- Huh JW, Kim SY, Lee JH, Lee JS, Van Ta Q, Kim M, et al. Bone marrow cells repair cigarette smoke-induced emphysema in rats. Am J Physiol Lung Cell Mol Physiol 2011; 301:L255 - 66; http://dx.doi.org/10.1152/ajplung.00253.2010; PMID: 21622846
- van Haaften T, Byrne R, Bonnet S, Rochefort GY, Akabutu J, Bouchentouf M, et al. Airway delivery of mesenchymal stem cells prevents arrested alveolar growth in neonatal lung injury in rats. Am J Respir Crit Care Med 2009; 180:1131 - 42; http://dx.doi.org/10.1164/rccm.200902-0179OC; PMID: 19713449
- Albera C, Polak JM, Janes S, Griffiths MJ, Alison MR, Wright NA, et al. Repopulation of human pulmonary epithelium by bone marrow cells: a potential means to promote repair. Tissue Eng 2005; 11:1115 - 21; http://dx.doi.org/10.1089/ten.2005.11.1115; PMID: 16144447
- Serikov VB, Popov B, Mikhailov VM, Gupta N, Matthay MA. Evidence of temporary airway epithelial repopulation and rare clonal formation by BM-derived cells following naphthalene injury in mice. Anat Rec (Hoboken) 2007; 290:1033 - 45; http://dx.doi.org/10.1002/ar.20574; PMID: 17661377
- Burdon TJ, Paul A, Noiseux N, Prakash S, Shum-Tim D. Bone marrow stem cell derived paracrine factors for regenerative medicine: current perspectives and therapeutic potential. Bone Marrow Res 2011; 2011:207326; http://dx.doi.org/10.1155/2011/207326; PMID: 22046556
- Lau DC, Shillabeer G, Wong KL, Tough SC, Russell JC. Influence of paracrine factors on preadipocyte replication and differentiation. Int J Obes 1990; 14:Suppl 3 193 - 201; PMID: 2086514
- Kotton DN, Ma BY, Cardoso WV, Sanderson EA, Summer RS, Williams MC, et al. Bone marrow-derived cells as progenitors of lung alveolar epithelium. Development 2001; 128:5181 - 8; PMID: 11748153
- Suratt BT, Cool CD, Serls AE, Chen L, Varella-Garcia M, Shpall EJ, et al. Human pulmonary chimerism after hematopoietic stem cell transplantation. Am J Respir Crit Care Med 2003; 168:318 - 22; http://dx.doi.org/10.1164/rccm.200301-145OC; PMID: 12724127
- Wong AP, Keating A, Lu WY, Duchesneau P, Wang X, Sacher A, et al. Identification of a bone marrow-derived epithelial-like population capable of repopulating injured mouse airway epithelium. J Clin Invest 2009; 119:336 - 48; PMID: 19164856
- Chang JC, Summer R, Sun X, Fitzsimmons K, Fine A. Evidence that bone marrow cells do not contribute to the alveolar epithelium. Am J Respir Cell Mol Biol 2005; 33:335 - 42; http://dx.doi.org/10.1165/rcmb.2005-0129OC; PMID: 15961725
- Kotton DN, Fabian AJ, Mulligan RC. Failure of bone marrow to reconstitute lung epithelium. Am J Respir Cell Mol Biol 2005; 33:328 - 34; http://dx.doi.org/10.1165/rcmb.2005-0175RC; PMID: 15961722
- Kassmer SH, Krause DS. Detection of bone marrow-derived lung epithelial cells. Exp Hematol 2010; 38:564 - 73; http://dx.doi.org/10.1016/j.exphem.2010.04.011; PMID: 20447442
- Krause DS. Bone marrow-derived lung epithelial cells. Proc Am Thorac Soc 2008; 5:699 - 702; http://dx.doi.org/10.1513/pats.200803-031AW; PMID: 18684720
- Camargo FD, Green R, Capetanaki Y, Jackson KA, Goodell MA. Single hematopoietic stem cells generate skeletal muscle through myeloid intermediates. Nat Med 2003; 9:1520 - 7; http://dx.doi.org/10.1038/nm963; PMID: 14625546
- Bailey AS, Willenbring H, Jiang S, Anderson DA, Schroeder DA, Wong MH, et al. Myeloid lineage progenitors give rise to vascular endothelium. Proc Natl Acad Sci U S A 2006; 103:13156 - 61; http://dx.doi.org/10.1073/pnas.0604203103; PMID: 16920790
- Herzog EL, Van Arnam J, Hu B, Krause DS. Threshold of lung injury required for the appearance of marrow-derived lung epithelia. Stem Cells 2006; 24:1986 - 92; http://dx.doi.org/10.1634/stemcells.2005-0579; PMID: 16868209
- Willenbring H, Bailey AS, Foster M, Akkari Y, Dorrell C, Olson S, et al. Myelomonocytic cells are sufficient for therapeutic cell fusion in liver. Nat Med 2004; 10:744 - 8; http://dx.doi.org/10.1038/nm1062; PMID: 15195088
- Sacco A, Doyonnas R, LaBarge MA, Hammer MM, Kraft P, Blau HM. IGF-I increases bone marrow contribution to adult skeletal muscle and enhances the fusion of myelomonocytic precursors. J Cell Biol 2005; 171:483 - 92; http://dx.doi.org/10.1083/jcb.200506123; PMID: 16275752