Abstract
We analyzed the activity of the histone deacetylase inhibitor (HDACi) suberoyl-anilide hydroxamic acid (SAHA) on Kasumi-1 acute myeloid leukemia (AML) cells expressing AML1/ETO. We also compared the effects of SAHA to those of valproic acid (VPA), a short-chain fatty acid HDACi. SAHA and VPA induced histone H3 and H4 acetylation, myeloid differentiation and massive early apoptosis. The latter effects were not determined by either drug in AML cell lines, such as NB4 or THP-1, not expressing AML1/ETO. SAHA was more rapid and effective than VPA in increasing H3 and H4 acetylation in total Kasumi-1 cell lysates and more effective than VPA in inducing acetylation of H4K8, H4K12, H4K16 residues. At the promoter of IL3, a transcriptionally-silenced target of AML1/ETO, SAHA was also more rapid than VPA in inducing total H4, H4K5, H4K8 and H3K27 acetylation, while VPA was more effective than SAHA at later times in inducing acetylation of total H4, H4K12, H4K16, as well as total H3. Consistent with these differences, SAHA induced the expression of IL3 mRNA more rapidly than VPA, while the effect of VPA was delayed. These differences might be exploited to design clinical trials specifically directed to AML subtypes characterized by constitutive HDAC activation. Our results led to include SAHA, an FDA-approved drug, among the HDACi active in the AML1/ETO-expressing AML cells.
Introduction
Histone acetylation is a reversible mechanism involved in transcriptional regulation. Histone acetyl transferases (HAT) and histone deacetylases (HDAC) are competitive protein modifiers that affect the dynamics of chromatin remodeling by changing histone acetylation status. HAT add, while HDAC remove, acetyl groups to/from lysine residue of histones.Citation1 Activation of transcription is determined by a fine-tuning of acetylation of different lysine residues, which parallels modifications of histone methylation.Citation2-Citation4 DNA methylation is also a pivotal regulator of gene expression.Citation5,Citation6
Histone acetylation is deregulated in many neoplasms, human leukemias in particular, where its alteration may represent a common leukemogenic pathway.Citation7 Core-binding factor (CBF) acute myeloid leukemias (AML) exhibit rearrangements of genes encoding for CBF subunits, such as AML1 (CBF〈2) or CBF〈. In particular, the translocation t(8;21)(q22;q22), which leads to gene repression via the formation of the AML1/ETO chimeric gene, represents a paradigm for the mechanism of leukemogenesis.Citation8 In contrast to AML1, which recruits the transcriptional co-activators p300/CBP endowed with intrinsic HAT activity, AML1/ETO recruits, via NCoR/Sin3A, HDAC1 and the DNA methyltransferase-1 (DNMT1), resulting in the stable silencing of AML1-controlled genes, like those driving granulocytic maturation.Citation9-Citation15
The use of HDAC inhibitors (HDACi) to restore deregulated histone acetylation emerged as a possible novel approach to AML therapy. The HDACi tested in clinical settings belong to different chemical classes and include valproic acid (VPA),Citation16 suberoyl-anilide hydroxamic acid (SAHA), depsipeptide, SNX275 (entinostat),Citation17 romidepsin and MGCD0103.Citation18,Citation19 Recently, SAHA (vorinostat) obtained FDA approval for the treatment of cutaneous T cell lymphomas.Citation20,Citation21 However, few data have been collected for the treatment of de novo AML using HDACi as single drugs.Citation22
We previously showed that HDACi, as single drugs, are very potent anti-leukemic agents, particularly in AML1/ETO-positive AML cells.Citation23,Citation24 In the study reported here, we compared the activity of SAHA, an HDACi of the hydroxamic acid class, to that of VPA, a short-chain fatty acid, on Kasumi-1 cells.
Results
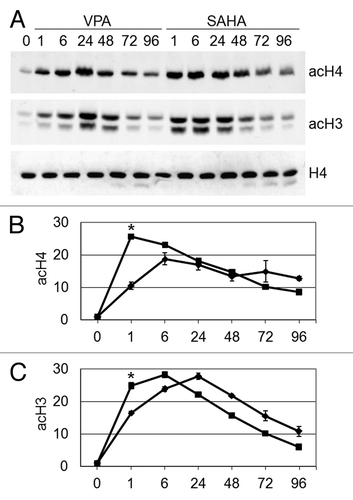
The effects of HDACi on the timing of H4 and H3 acetylation in total cell lysates of Kasumi-1 cells are shown in . Cells were treated with 2 mM VPA or 1 μM SAHA and lysed at different incubation times. Untreated Kasumi-1 cells showed weak H4 and H3 acetylation, in keeping with our previous observations.Citation23,Citation24 HDACi treatment markedly induced H4 and H3 acetylation, the effect of SAHA being more rapid.
Figure 1. Effects of VPA or SAHA on total H4 or H3 acetylation. Kasumi-1 cells were incubated or not (time 0) in the presence of 2 mM VPA or 1 μM SAHA for the indicated times (hours). (A) Western Blotting was performed with the indicated antibodies. (B and C) Graphs represent (mean ± SEM of data from three independent experiments) total acetylation of H4 (B) or H3 (C) following treatment with VPA (diamond) or SAHA (square), as determined by densitometry of bands. Values were intra-experimentally normalized for H4 (B) or H3 (C) content and expressed as fold-increase with respect to the time 0 value. The statistical significance of differences within the same time point was determined by the Student’s t-test for paired samples (*p < 0.05).
The effects of VPA or SAHA were then evaluated on the acetylation of single lysine residues of H4 in total cell lysates (). Acetylation of K5, K8, K12 and K16 was increased following treatment with either VPA or SAHA. SAHA induced a more marked acetylation of K8, K12 and K16 with respect to VPA. Interestingly, K16 acetylation increased very slowly, to peak after 72–96 h of treatment with either SAHA or VPA (). It is to note, however, that beyond 72–96 h of treatment the bulk of population died (see below ). These results indicate that early H4 acetylation () was sustained by acetylation of K5, K8 and, especially for SAHA, K12, while acetylation of K16 accounted for the delayed total H4 acetylation.
Figure 2. Effects of VPA or SAHA on H4 acetylation at specific lysine residues. Kasumi-1 cells were incubated or not (time 0) in the presence of 2 mM VPA or 1 μM SAHA for the indicated times (hours). (A) Western Blotting was then performed with the indicated antibodies. (B–E) Graphs represent (mean ± SEM of data from three independent experiments) H4 acetylation following treatment with VPA (diamond) or SAHA (square) at K5 (B), K8 (C), K12 (D) or K16 (E), as determined by densitometry of bands. Values were intra-experimentally normalized for H4 content and expressed as fold-increase with respect to the time 0 value. The statistical significance of differences within the same time point was determined by the Student’s t-test for paired samples (*p < 0.05; **p < 0.01).
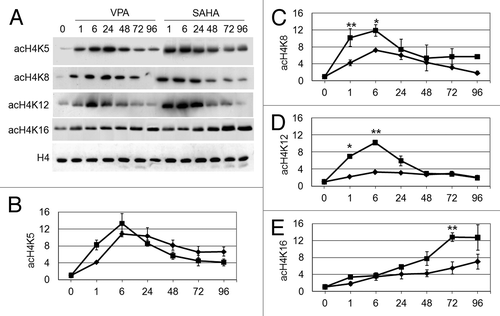
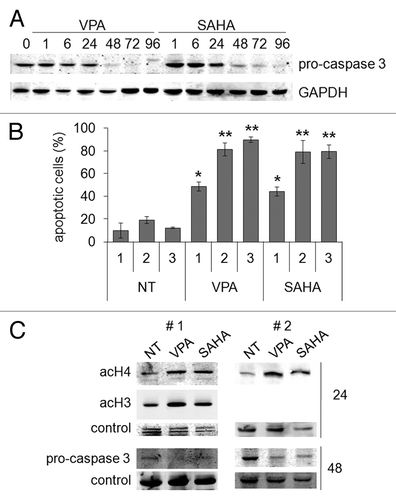
Figure 6. Pro-apoptotic effects of VPA or SAHA on Kasumi-1 cells. (A) Kasumi-1 cells were incubated or not (time 0) in the presence of 2 mM VPA or 1 μM SAHA for the indicated times (hours). Cells were then lysed and western blotting performed with the indicated antibodies. Results are from one typical experiment out of three. (B) Cells were incubated without (NT) or with 2 mM VPA or 1 μM SAHA for the indicated times (days) and apoptosis was measured by the Annexin V test and flow cytometry. Values are means ± SEM of the percentages of apoptotic cells obtained from three independent experiments. The statistical significance of differences was determined by the Student’s t-test for paired samples (*p < 0.05; **p < 0.01). (C) Blasts from two t(8;21) AML patients (#1 and #2) were incubated or not (NT) in the presence of 2 mM VPA or 1 μM SAHA for the indicated times (hours). Cells were then lysed and western blotting performed with the indicated antibodies.
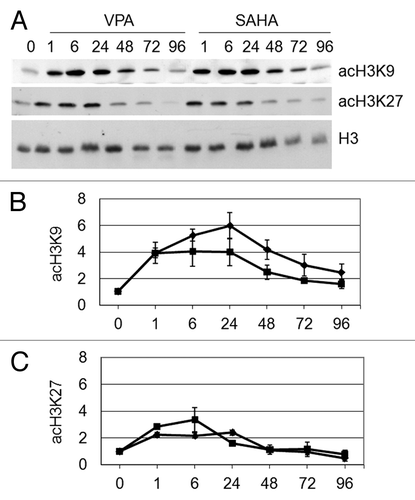
The effects of VPA or SAHA were then evaluated on acetylation of K9 and K27 residues of H3 in total cell lysates (). The acetylation of K9 and K27 peaked within 6–24 h of treatment, SAHA and VPA exhibiting similar timing and effectiveness, in keeping with data obtained for total H3 acetylation ().
Figure 3. Effects of VPA or SAHA on H3 acetylation at specific lysine residues. Kasumi-1 cells were incubated or not (time 0) in the presence of 2 mM VPA or 1 μM SAHA for the indicated times (hours). (A) Western Blotting was then performed with the indicated antibodies. (B and C) Graphs represent (mean ± SEM of data from three independent experiments) H3 acetylation following VPA (diamond) or SAHA (square) at K9 (B) or K27 (C), as determined by densitometry of bands. Values were intra-experimentally normalized for H3 content and expressed as fold-increase with respect to the time 0 value. Differences within the same time point were not statistically significant, as determined by the Student’s t-test for paired samples.
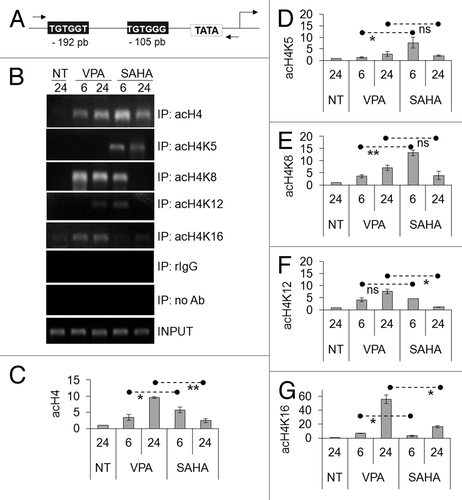
We previously showed that the treatment of Kasumi-1 cells with ITF2357, a hydroxamate-derived HDACi, induces H4 acetylation at the promoter of IL3, a transcriptionally silenced AML1/ETO target gene.Citation24 Therefore, we analyzed here by ChIP the pattern of histone acetylation occurring at IL3 promoter after treatment with VPA or SAHA, to check whether differences exist between the effects of the two drugs at this specific site (). The region of IL3 promoter, including the two AML1/ETO binding sites and the TATA box, object of the ChIP experiments, is reported in . We performed ChIP assays after 6 and 24 h of exposure to HDACi, when H3 and H4 acetylation in total cell lysates reached peak values. As revealed by RT-PCR () and quantified by Q-PCR (), total H4 acetylation at IL3 promoter was higher with SAHA than with VPA after 6 h of treatment, while the opposite occurred after 24 h. When ChIP was performed for single lysine residues of H4, we found that SAHA induced acetylation of K5 and K8 more rapidly than VPA ( and E). However, VPA was more effective than SAHA on K16 acetylation at either time and K12 acetylation after 24 h ( and G). It is to note that the increase of K16 acetylation was delayed for both drugs, mirroring what observed by western blotting of total cell lysates ().
Figure 4. Effects of VPA or SAHA on H4 epigenetic modifications at IL3 promoter. (A) Schematic representation of the IL3 promoter region analyzed. Grey boxes: AML1/ETO binding sites. (B-G) Kasumi-1 cells were incubated in the absence (NT) or the presence of 2 mM VPA or 1 μM SAHA for the indicated times (hours). ChIP was performed (IP: immunoprecipitates) using the indicated antibodies (rIgG: control rabbit IgG; no Ab: negative control). The IL3 promoter region was then amplified by RT-PCR (B) or Q-PCR (C–G). Histograms represent the relative quantification of DNA recovered from IP with antibodies against acH4 (C) or individual acK residues of H4, as indicated (D–G). Values were intra-experimentally normalized for input DNA and control IgG and data expressed as fold-increase with respect to the respective value obtained for untreated cells at 24 h of incubation (NT). Histograms are means ± SEM of data from three independent experiments. The statistical significance of differences was determined by the Student’s t-test for paired samples (*p < 0.05; **p < 0.01; ns: not significant).
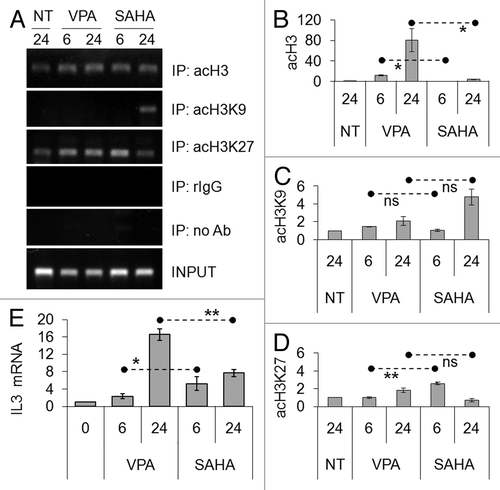
Referring to acetylated H3 at IL3 promoter (), as determined by RT-PCR () and quantified by Q-PCR (), ChIP assays showed that VPA induced marked delayed total H3 acetylation with respect to SAHA. ChIP assays for K9 and K27 of H3 ( and D) showed modest increases of acetylation of both residues, pointing to the involvement of other residues in H3 acetylation at IL3 promoter. These results indicated that VPA or SAHA induced H3 and H4 acetylation at IL3 promoter, the effect of VPA being delayed. VPA administration is known to increase the expression of IL3 mRNA in Kasumi-1 cells.Citation15 We therefore analyzed the timing of IL3 mRNA expression after exposure to VPA or SAHA (). Induction of IL3 expression by SAHA was more rapid, while that by VPA was delayed and stronger. These effects are consistent with the time frame of acetylation of H4 and H3 induced by the two drugs at IL3 promoter. However, either drug was proved capable to rescue the expression of a gene repressed by AML1/ETO.
Figure 5. Effects of VPA or SAHA on H3 epigenetic modifications at IL3 promoter and on IL3 mRNA expression. (A–D) Kasumi-1 cells were incubated in the absence (NT) or the presence of 2 mM VPA or 1 μM SAHA for the indicated times (hours). ChIP was performed (IP: immunoprecipitates) using the indicated antibodies (rIgG: control rabbit IgG; no Ab: negative control). The IL3 promoter region was then amplified by RT-PCR (A) or Q-PCR (B–D). Histograms represent the relative quantification of DNA recovered from IP with antibodies against acH3 (B) or individual acK residues of H3, as indicated (C–D). Values were intra-experimentally normalized for input DNA and control IgG and data expressed as fold-increase with respect to the respective value obtained for untreated cells at 24 h of incubation (NT). (E) Cells were incubated in the absence (0) or the presence of 2 mM VPA or 1 μM SAHA for the indicated times (hours) and then lysed and total RNA was extracted. The relative expression of IL3 was calculated by Q-PCR using rRNA18S for normalization and the untreated sample as calibrator. (B–E) Values are means ± SEM of data from three independent experiments. The statistical significance of differences was determined by the Student’s t-test for paired samples (*p < 0.05; **p < 0.01; ns: not significant).
HDACi are well known inducers of apoptosis.Citation25 shows that either VPA or SAHA rapidly induced apoptosis in Kasumi-1 cells. Caspase 3 activation (indicated by the decrease of procaspase 3, ) occurred after 48 h of treatment with VPA or SAHA. Either drug determined significant apoptosis at day 1 and massive apoptosis at days 2 and 3 as determined by the annexin V test (). It is to note that at day 1 early apoptosis only occurred (Fig. S1), in keeping with the fact that caspase 3 activation, a late event in the apoptosis process, started after 48 h (). Thus, about 50% of cells were viable when the ChIP experiments ( and ) were performed (at 6 and 24 h), and 20% even after 2 d of treatment. The occurrence of apoptosis in t(8;21) AML primary blasts () was also demonstrated by the activation of caspase 3 following treatment with VPA or SAHA for 48 h. These effects were confirmed by the annexin V test (not shown). Moreover, in these cells VPA or SAHA were able to induce H4 (#1 and 2) and H3 (#1) acetylation after 24 h.
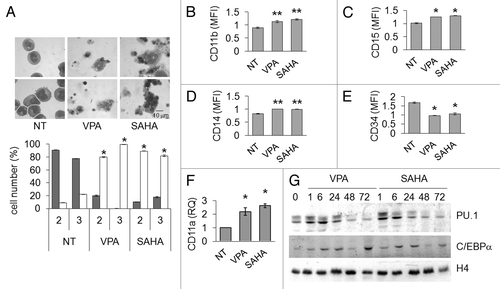
We previously demonstrated that HDACi as single drug can rescue myeloid maturation in AML cells.Citation23 The effects of VPA or SAHA with respect to the induction of myeloid maturation were therefore determined in Kasumi-1 cells (). Morphology revealed the induction of maturation in treated cultures, as indicated by the increase of differentiated cells at the expenses of blast cells (). Immuno-phenotypical () and Q-PCR () analyses showed that following treatment with either VPA or SAHA, the expression of CD34 decreased, while that of typical markers of granulocytic or monocytic maturation, such as CD11a, CD11b, CD14 and CD15, increased. The removal of the block of differentiation was also witnessed by the increase in the expression of C/EBPα and PU.1 (two myeloid differentiation-promoting genes, that are downregulated by AML1/ETOCitation23,Citation26,Citation27) after treatment with either SAHA or VPA. Taken together, the data reported in and indicate that VPA or SAHA induced apoptosis in the majority of cells, but also myeloid maturation in cells that remained viable.
Figure 7. Effects of VPA or SAHA on maturation of Kasumi-1 cells. (A) Cells were incubated in the presence or the absence (NT) of 2 mM VPA or 1 μM SAHA for 2 (upper pictures) or 3 (lower pictures) days. Cytospin preparations were stained with May–Grünwald/Giemsa and examined using a 100x immersion lens. Histograms represent the percentages of blasts (gray) or differentiated (white) cells at the indicated times (days), determined as described in Materials and Methods. (B–F) Cells were treated as in A for 2 d. (B-E) Cell surface expression of markers was evaluated by flow cytometry using FITC- (CD11b and CD15) or PE- (CD14 and CD34) conjugated monoclonal antibodies. MFI was calculated with respect to that of cells treated with FITC- or PE-conjugated IgG. (F) The relative expression of CD11a was calculated by Q-PCR using rRNA18S for normalization and untreated sample as calibrator. (A–F) Values are means ± SEM of data from three independent experiments. The statistical significance of differences was determined by the Student’s t-test for paired samples (*p < 0.05; **p < 0.01). (G) Cells were incubated or not (time 0) in the presence of 2 mM VPA or 1 μM SAHA for the indicated times (hours). Cells were then lysed and western blotting performed with the indicated antibodies. Results are from one typical experiment out of three.
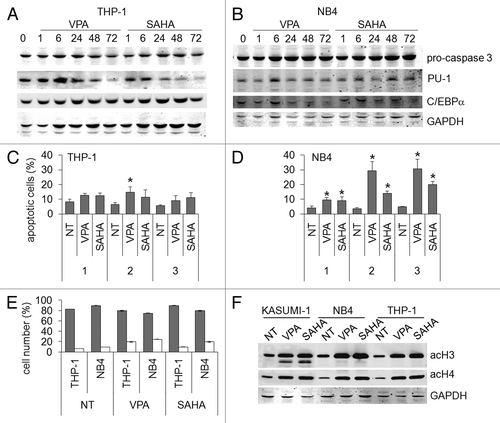
We previously showed that CBF-AML cells are particularly sensitive to HDACi.Citation23,Citation24,Citation28 We therefore investigated on whether the proapoptotic effects of the drugs tested were specific for this subset of leukemias (). To this end, we chose NB4 cells, because they represent another example of HDAC-involving leukemogenesis, and THP-1 cells as a more general model of AML with no specific genetic aberration. Treatment of THP-1 cells with either 2 mM VPA or 1 μM SAHA induced negligible apoptosis, as determined by either caspase 3 activation or Annexin V test ( and C). In NB4 cells, apoptosis induced by either drug was very modest at day 1 and more pronounced at days 2 and 3, as determined by Annexin V test (). The modest proapoptotic effect of either drug was supported by the undetectable caspase 3 activation (). However, maximal apoptosis of NB4 cells was 30% on the average, a value well below that observed for Kasumi-1 cells (), indicating a peculiar sensitivity of these cells to the proapoptotic effects of VPA and SAHA. We also tested the possibility of differentiating effects of VPA or SAHA in THP-1 and NB4 cells. The expression of myeloid differentiation genes,Citation29 such as PU.1 or C/EBPα ( and B), as well as the percentages of differentiated cells () were not significantly increased following treatment with either drugs. However, the acetylation of H4 or H3 induced by either VPA or SAHA in NB4 or THP-1 cells was similar to that induced in Kasumi-1 cells ().
Figure 8. Effects of VPA or SAHA on apoptosis in AML cells not expressing AML1/ETO. THP-1 (A) or NB4 (B) cells were incubated or not (time 0) in the presence of 2 mM VPA or 1 μM SAHA for the indicated times (hours). Cells were then lysed and Western Blotting performed with the indicated antibodies. Results are from one typical experiment out of two. THP-1 (C) or NB4 (D) cells were incubated in the presence or the absence (NT) of 2 mM VPA or 1 μM SAHA for the indicated times (days). Apoptosis was then measured by the Annexin V test and flow cytometry. Values are means ± SEM of the percentages of apoptotic cells obtained from three independent experiments. The statistical significance of differences was determined by the Student’s t-test for paired samples (*p < 0.05). (E) Cells were incubated in the presence or the absence (NT) of 2 mM VPA or 1 μM SAHA for 3 d. Cytospin preparations were stained with May–Grünwald/Giemsa and the percentages of blasts (gray) or differentiated (white) cells determined as described in Materials and Methods. Differences, as determined by the Student’s t-test for paired samples, were not significant. (F) Cells were incubated or not (NT) in the presence of 2 mM VPA or 1 μM SAHA for 24 h and lysed. Western Blotting was then performed with the indicated antibodies. Results are from one typical experiment out of two.
Discussion
HDACi have been tested in clinical trials for the therapy of several solid and hematologic malignanciesCitation19 and SAHA has been approved by FDA for the treatment of T cell lymphomas. On the other hand, the effects of VPA have been better characterized in vitro. However, few data have been collected in AML clinical trials using HDACi as single drugs.Citation16,Citation22,Citation30,Citation31 On the whole, the mechanism of action of several HDACi, including SAHA, is still largely unexplained.Citation32
In this study, we compared SAHA and VPA, HDACi belonging to the hydroxamic and the short-chain fatty acid classes of HDACi, respectively, as for their ability to induce histone acetylation and biological effects in AML1/ETO-positive AML cells, which emerged to be particularly sensitive to HDACi.Citation23,Citation24 We found that: (1) SAHA was, on the whole, more rapid than VPA in inducing maximal H3 and H4 acetylation in total cell lysates; (2) SAHA was not only more rapid, but also more effective than VPA in inducing H4 acetylation in individual lysine residues (K8, K12 and K16) in total cell lysates; (3) with respect to the induction of acetylation at the IL3 promoter as well as to the increase of IL3 mRNA, SAHA was also in general more rapid, while the effects of VPA were delayed, yet more pronounced; (4) both SAHA and VPA induced massive and early apoptosis and measurable myeloid maturation.
The different effects of SAHA and VPA on H3 and H4 acetylation in cell lysates probably reside in specific properties of the different classes of HDACi they belong to. Indeed, short-chain fatty acids, such as VPA, inhibit only HDAC of classes I and IIa and are characterized by a rather inefficient binding to the catalytic pocket of HDAC.Citation33 The latter feature may result in the delayed effects of VPA we observed and is in keeping with the previous finding of ours that butyrates (other short-chain fatty acids) induce peak H4 acetylation within 24–48 h.Citation23 By contrast, hydroxamate-derived HDACi, such as SAHA, are active on all HDAC classes except sirtuinsCitation34 and include some of the most potent drugs (and are used, indeed, at micromolar concentrations).
As far as individual residues are concerned, early H4 acetylation in total cell lysates was most likely due to the rapid acetylation of K5, K8 and, especially referring to SAHA, K12, while K16 sustained delayed H4 acetylation. The latter is a relevant effect, because the loss of K16 acetylation has been reported for several types of cancer and shown to influence tumor progression and sensitivity to chemotherapy.Citation35,Citation36 As for H3, both drugs, without relevant differences between each other, determined an appreciable acetylation of K9 and a slight increase of that of K27. The possibility of the involvement of other residues, such as K18 and K26, remained open.Citation37,Citation38 The fact that histone lysine acetylation patterns vary with respect to the HDACi family used for the treatment emerged also from the finding that depsipeptide, a member of the cyclic peptide family of HDACi, determines in Kasumi-1 cells an early acetylation of H4 in K16, followed by that of K12 and later by that of K8 and/or K5.Citation39
To deepen, at the level of a specific gene promoter, what happens to the pattern of histone acetylation following treatment with different HDACi, we chose the promoter of IL3, a gene targeted by AML1/ETO.Citation40 At this site, SAHA was more rapid than VPA to induce H4 acetylation, apparently as a consequence of K5 and K8 acetylation. However, VPA was more effective at the later time, determining a robust increase of K16 acetylation in particular. These results are well in keeping with previous reports showing that the acetylation of many lysine residues of H4 correlates with IL3 transcription, and that mutations of K5, K8 or K12 have lesser effects on transcription than that of K16.Citation41-Citation44 VPA was also more effective than SAHA with respect to the induction of H3 acetylation at IL3 promoter. This effect of VPA seems to be the consequence of the acetylation of residues other than K9 and K27. It is to note that also at the level of whole cell lysates these residues did not appear responsible for the different timing of total H3 acetylation elicited by the two drugs. Hypermethylated and silenced genes in cancer cells are known to exhibit key histone modifications in their promoter, in particular H3 deacetylation on K9 and methylation on K27.Citation45,Citation46 Our results, therefore, seem to downsize the role of K9 acetylation in the epigenetic control of gene expression, because IL3 re-expression occurred apparently in the absence of marked K9 acetylation. On the whole, acetylation of total H4 as well as H4K5 and H4K8 seems to be functionally related to the effect of SAHA as for early IL3 mRNA expression. On the other hand, acetylation of total H3 and H4 as well as H4K12 and H4K16 seems to be related to the delayed effect of VPA. In any case, both SAHA and VPACitation15 were able to restore IL3 expression as single agents.
VPA and SAHA induced marked apoptosis in Kasumi-1 cells and in primary cells from two t(8;21) AML patients, in keeping with the well-known growth-inhibitory and pro-apoptotic effects of HDACi in vitro and in vivo on a wide range of transformed cells.Citation6,Citation47,Citation48 Moreover, we confirmed that AML1/ETO-expressing cells are particularly sensitive to the proapoptotic effects of HDACi. Indeed, treatment of THP-1 or NB4 cells with either VPA or SAHA determined negligible or modest apoptosis or differentiation, albeit increasing total H3 and H4 acetylation at levels similar to those induced in Kasumi-1 cells. What is remarkable here is that either VPA or SAHA induced detectable granulocytic and monocytic maturation of Kasumi-1 cells surviving treatment, as witnessed by the increase of markers such as CD11a, CD11b, CD14, CD15, C/EBPα and PU.1, as well as the decrease of CD34. VPA was previously shown to have a partial differentiating effect,Citation15,Citation49 while, to our knowledge, the induction by SAHA of maturation of AML1/ETO-positive cells had not been reported before. Rather, a previous reportCitation50 excluded a differentiating effect of SAHA on Kasumi-1 cells on the basis of the unchanged expression of CD11b after 48 h of treatment with 0.5 μ⊂ SAHA. In our experiments, SAHA was used at 1 μM. This different dosage possibly explains the maturation effects we observed, which are, however, demonstrated by changes relative to many differentiating markers. Our results seem to indicate that the induction of maturation in vitro is a common property of different families of HDACi.
On the whole, we found that VPA and SAHA determined different rapidity and robustness of acetylation of H3 and H4 (either total or on single residues) although eliciting similar biological effects, at least for what concerns apoptosis and myeloid maturation. However, it cannot be excluded that other biological features may be differently affected. That the pattern of bulk histone acetylation is not tightly linked to apoptosis and maturation is also witnessed by the fact that HDACi induced similar levels of acetylation in NB4 and THP-1 cells, which neither underwent marked apoptosis nor differentiated appreciably. Therefore, differences in the biological effects of HDACi may be explained by a fine-tuning of histone acetylation that needs to be deepened. Moreover, data reported here showed that both VPA and SAHA are able to loosen the block of maturation caused by the AML1/ETO repressor complex. The induction of massive apoptosis and detectable maturation confirmed the potent anti-leukemic activity of the HDACi tested on AML1/ETO-expressing cells. On the basis of our results (refs. Citation23, Citation24 and this paper) and those recently published by others,Citation51 we propose HDACi to be tested as single agents in clinical trials dedicated to sensitive AML subtypes such as that expressing AML1/ETO.
Materials and Methods
Cells and culture conditions
Kasumi-1,Citation52 NB4Citation53 and THP-1Citation54 cells were seeded at 3x10⁵ cells per ml in RPMI 1640 supplemented with 10% fetal bovine serum (FBS), 4 mM glutamine, 50 U/ml penicillin and 50 mg/ml streptomycin, incubated at 37°C in a water-saturated atmosphere containing 5% CO2, and treated or not with VPA 2 mM (Sigma)Citation15 or SAHA 1 μM (Sigma).Citation55 Kasumi-1 cells, a human AML1/ETO-positive cell line,Citation52 and the human promyelocytic leukemia NB4 have been a kind gift of Dr C. Chomienne (Université Denis Diderot, Institut Universitaire d'Hématologie, Paris, France) in 1998. Kasumi-1 cells have been routinely (every two to three months) checked by Q-PCR and western blotting for the expression of AML1/ETO. The human myeloid monocytic THP-1 cells have been a kind gift of Dr S. Ferrari (Department of Biomedical Sciences, University of Modena and Reggio Emilia, Modena, Italy) in 2004. Primary AML blasts were obtained from two French–American–British type M2 patients with t(8;21) following informed consent, by depletion of adherent cells in serum-free medium; after this procedure, the blast content was 98–100%, as revealed by morphological examination.
Cell lysis and western blotting
Cells were washed twice with ice-cold phosphate-buffered saline (PBS) containing 100 μM orthovanadate and lysed by incubation in Laemmli buffer (Tris/HCl 62.5 mM, pH 6.8, 10% glycerol, 0.005% blue bromophenol, 2% SDS) at 95°C for 10 min in the presence of 100 mM 2-mercaptoethanol. Lysates were then clarified by centrifugation (20,000 g, 10 min, RT). Protein concentration was determined by the BCA method and 15 g protein/sample were separated by SDS-PAGE in 15% polyacrylamide gel and then transferred onto PVDF membranes (Millipore; Billerica, MA, USA) by electroblotting. Membranes were incubated (1 h, RT) in Odyssey Blocking Buffer diluted 1:1 with PBS, and then in PBS containing 0.1% Tween-20 and the primary antibody (16–18 h, 4°C). After extensive washing with 0.1% Tween-20 in PBS, membranes were incubated in Odyssey Blocking Buffer diluted 1:1 with PBS containing IRDye®800CW- or IRDye®680-conjugated secondary antibody (1 h, 4°C). Bands were visualized by infrared imaging (Li-Cor, Odissey; Lincoln, NE, USA), images recorded as TIFF files and band intensity measured with the Adobe Photoshop software.
Chromatin immunoprecipitation (ChIP) assay
An amount of 106 Kasumi-1 cells (seeded initially at 3x10⁵ cells per ml) were treated with 1% formaldehyde for 10 min at 37°C. Cross-linking was stopped by adding glycine (final concentration: 125 mM). Cells were centrifuged at 1300 rpm for 5 min at 4°C and washed twice, using ice-cold PBS containing protease inhibitors: 1 mM phenyl-methyl-sulphonyl-fluoride (PMSF), 1 μg/ml aprotinin and 1 μg/ml pepstatin-A. Cell pellet was lysed in 200 μl of lysis buffer (50 mM Tris–HCl pH 8.1, 10 mM EDTA, 1% SDS, 1 mM PMSF, 1 μg/ml aprotinin and 1 μg/ml pepstatin-A) for 10 min on ice and then sonicated (two pulses of 15 sec each, at power setting 5 in a Microson Misonix apparatus) to generate DNA fragments of 100–500 bp. After centrifugation (20,000 g, 10 min, 4°C), the supernatant was 10-fold diluted with ChIP dilution buffer (16.7 mM Tris–HCl pH 8.1, 167 mM NaCl, 1.2 mM EDTA, 0.01% SDS, 1.1% Triton X-100), 4% of this sample was harvested and used as an indicator of chromatin content in each sample (input). The samples were pre-cleared by incubating with 50 μl of sonicated salmon sperm DNA/protein G agarose (Millipore) for 1 h at 4°C under constant agitation. Following centrifugation (1,000 rpm, 1 min, 4°C), sample supernatants were added with 2 μg of antibody (directed to the target of interest or an isotype control IgG) per sample and incubated overnight at 4°C under constant agitation. In parallel, each sample was subjected to the same procedure without antibody (negative control). Antibody-protein–DNA complexes were collected by a further incubation with 50 μl salmon sperm DNA/protein G agarose and centrifugation. After extensive washing, complexes were eluted with 500 μl elution buffer (0.1 M NaHCO3, 1% SDS). Following addition of 0.2 M NaCl, all samples, including input, were incubated at 65°C for 4 h to revert cross-linking. After treatment with 10 mM RNase and digestion with 40 mM proteinase-K, DNA was extracted with a DNA purification system based on silica-membrane spin columns, according to the manufacturer’s recommendations (Promega) and DNA eluted in 50 μl of water.
Quantitative real-time PCR (Q-PCR)
After total RNA extraction by TRIzol, as recommended by the manufacturer (Invitrogen), 1 μg/sample of total RNA was subjected to reverse transcription with SuperScriptVILO-Reverse Transcriptase (Invitrogen) for 10 min at 25°C, 1 h at 42°C and 5 min at 85°C, utilizing 50 pmol hexameric random primers. The primers used were as follows: IL3 mRNA: FW, 5′-CCAAACCTGGAGGCATTCA-3′; RV, 5′-TCAATTGCTGATGCGTTCTGTA-3′; rRNA 18S mRNA: FW, 5′-CGGCTACCACATCCAAGGAA-3′, RV, 5′-GCTGGAATTACCGCGGCT-3′; IL3 promoter: FW, 5′-ACTGATCTTGAGTACTAGAAAGTCATGGA-3′; RV, 5′-GGAAGGATCTTTATCTGACATGGAA-3′; CD11a mRNA: FW, 5′-CCAAAGACATCATCCGCTACATC-3′; RV, 5′-CTTCCTGACTCTCCTTGGTCTGAA-3′.
RQ-PCR (2 min 50°C, 5 min 95°C, 40 cycles at 95°C for 15 sec and at 60°C for 1 min) was performed with the ABI Prism 7500 Sequence Detection System (Applied Biosystems) using Power SYBR® Green PCR master mix (Applied Biosystems). A melting curve analysis was performed to discriminate between specific and non-specific PCR products. The housekeeper rRNA 18S gene was used as standard for IL3 mRNA expression. The relative expression of IL3 mRNA with respect to that of untreated cells, used as calibrator, was calculated by using a comparative threshold cycle method and the Equation 2(-⊗⊗Ct)56. Immunoprecipitated IL3 promoter DNA was normalized by input DNA and data were expressed with respect to those of untreated cells.
Polymerase chain reaction (PCR)
The immunoprecipitated chromatin was also analyzed by PCR in a Master Cycler (Eppendorf) using GoTaq DNA Polymerase (Promega), using the following primers for the IL3 promoter: FW, 5′-AGTCATGGATGAATAATTACG-3′; RV, 5′-TCCCGCCTTATATGTGC- 3′. PCR parameters were: 2 min at 94°C, 45 cycles at 94°C for 40 sec, 57°C for 40 sec and 72°C for 40 sec; final extension at 72°C for 5 min. PCR products were visualized by a run in a 3% agarose gel and image acquisition (Kodak EDAS 299 camera).
Antibodies
The following ChIP-grade rabbit polyclonal antibodies (Millipore) were used: anti-pan-acetylated-H4 (# 06–598); anti-pan-acetylated-H3 (# 06–599); anti-H4 (# 07–108); anti-acK5-H4 (# 07–327); anti-acK8-H4 (# 07–328); anti-acK12-H4 (# 06–761); anti-acK16-H4 (# 07–329); anti-acK9-H3 (# 07–352) and anti-acK27-H3 (# 07–360). The anti-caspase 3 (# sc-7272) and anti-GAPDH (# sc-20357) antibodies was from Santa Cruz Biotechnology.
Cell apoptosis and maturation
To quantify apoptosis, cells were centrifuged, resuspended in 100 μl of 1x binding buffer (HEPES-buffered saline solution with 2.5 mM CaCl2) and incubated with FITC-labeled Annexin-V (Roche Diagnostics) and propidium iodide (PI) for 15 min in the dark at room temperature (RT). After the addition of 400 μl of 1x binding buffer and agitation, flow cytometry was performed using a FACSCanto (Beckton and Dickinson). Annexin-V+/PI- cells were defined “early apoptotic” and annexin-V+/PI+ cells “late apoptotic.” Total apoptosis was calculated by the sum of all annexin-V+ cells.
Cell differentiation was evaluated by morphological or immunological criteria or Q-PCR (see above). Cytospin preparations of AML cells were stained with May–Grünwald/Giemsa and examined using a 100x immersion lens with a Leica DMR microscope. At least 200 cells/slide were counted in duplicate to determine the percentages of blasts, promyelocytes, myelocytes, metamyelocytes, band forms, granulocytes, monoblasts, monocytes and macrophages. Morphological signs of maturation were considered the presence of cytoplasmic granules, the lack of cytoplasmic basophilia, chromatin condensation and nuclear segmentation. The expression of CD34, CD15, CD11b, and CD14 on the cell surface was determined by flow cytometry. Cells were washed with PBS and incubated with PE-labeled anti-CD34, PE-labeled anti-CD14, FITC-labeled anti-CD11b or FITC-labeled anti-CD15 antibodies (Becton Dickinson) for 30 min in the dark at RT. After centrifugation in PBS for 5 min, cells were resuspended in 500 μl of PBS and flow cytometry performed in a FACSCanto. Results were expressed as mean fluorescence intensity (MFI), which is the mean fluorescence ratio of the specific antibody to the isotype antibody channel.
Additional material
Download Zip (1.1 MB)Author Contributions
E.R. and V.B. conceived, designed and performed the experiments, analyzed the data and wrote the manuscript. PDS contributed to the interpretation of data and wrote the manuscript. G.C. and I.M. performed the experiments. E.F. provided reagents. A.G. performed experiments, contributed to the interpretation of data and revised the manuscript critically. V.S. contributed to the interpretation of data and revised the manuscript critically. All authors read and approved the final version of the manuscript.
Disclosure of Potential Conflicts of Interest
No potential conflicts of interest were disclosed.
References
- Davie JR. Nuclear matrix, dynamic histone acetylation and transcriptionally active chromatin. Mol Biol Rep 1997; 24:197 - 207; http://dx.doi.org/10.1023/A:1006811817247; PMID: 9291093
- Grunstein M. Histone acetylation in chromatin structure and transcription. Nature 1997; 389:349 - 52; http://dx.doi.org/10.1038/38664; PMID: 9311776
- Jenuwein T, Allis CD. Translating the histone code. Science 2001; 293:1074 - 80; http://dx.doi.org/10.1126/science.1063127; PMID: 11498575
- Verdone L, Caserta M, Di Mauro E. Role of histone acetylation in the control of gene expression. Biochem Cell Biol 2005; 83:344 - 53; http://dx.doi.org/10.1139/o05-041; PMID: 15959560
- Marks PA, Richon VM, Miller T, Kelly WK. Histone deacetylase inhibitors. Adv Cancer Res 2004; 91:137 - 68; http://dx.doi.org/10.1016/S0065-230X(04)91004-4; PMID: 15327890
- Buchwald M, Krämer OH, Heinzel T. HDACi--targets beyond chromatin. Cancer Lett 2009; 280:160 - 7; http://dx.doi.org/10.1016/j.canlet.2009.02.028; PMID: 19342155
- Look AT. Oncogenic transcription factors in the human acute leukemias. Science 1997; 278:1059 - 64; http://dx.doi.org/10.1126/science.278.5340.1059; PMID: 9353180
- Downing JR. The AML1-ETO chimaeric transcription factor in acute myeloid leukaemia: biology and clinical significance. Br J Haematol 1999; 106:296 - 308; http://dx.doi.org/10.1046/j.1365-2141.1999.01377.x; PMID: 10460585
- Ogryzko VV, Schiltz RL, Russanova V, Howard BH, Nakatani Y. The transcriptional coactivators p300 and CBP are histone acetyltransferases. Cell 1996; 87:953 - 9; http://dx.doi.org/10.1016/S0092-8674(00)82001-2; PMID: 8945521
- Kitabayashi I, Yokoyama A, Shimizu K, Ohki M. Interaction and functional cooperation of the leukemia-associated factors AML1 and p300 in myeloid cell differentiation. EMBO J 1998; 17:2994 - 3004; http://dx.doi.org/10.1093/emboj/17.11.2994; PMID: 9606182
- Gelmetti V, Zhang J, Fanelli M, Minucci S, Pelicci PG, Lazar MA. Aberrant recruitment of the nuclear receptor corepressor-histone deacetylase complex by the acute myeloid leukemia fusion partner ETO. Mol Cell Biol 1998; 18:7185 - 91; PMID: 9819405
- Wang J, Hoshino T, Redner RL, Kajigaya S, Liu JM. ETO, fusion partner in t(8;21) acute myeloid leukemia, represses transcription by interaction with the human N-CoR/mSin3/HDAC1 complex. Proc Natl Acad Sci U S A 1998; 95:10860 - 5; http://dx.doi.org/10.1073/pnas.95.18.10860; PMID: 9724795
- Klisovic MI, Maghraby EA, Parthun MR, Guimond M, Sklenar AR, Whitman SP, et al. Depsipeptide (FR 901228) promotes histone acetylation, gene transcription, apoptosis and its activity is enhanced by DNA methyltransferase inhibitors in AML1/ETO-positive leukemic cells. Leukemia 2003; 17:350 - 8; http://dx.doi.org/10.1038/sj.leu.2402776; PMID: 12592335
- Liu S, Shen T, Huynh L, Klisovic MI, Rush LJ, Ford JL, et al. Interplay of RUNX1/MTG8 and DNA methyltransferase 1 in acute myeloid leukemia. Cancer Res 2005; 65:1277 - 84; http://dx.doi.org/10.1158/0008-5472.CAN-04-4532; PMID: 15735013
- Liu S, Klisovic RB, Vukosavljevic T, Yu J, Paschka P, Huynh L, et al. Targeting AML1/ETO-histone deacetylase repressor complex: a novel mechanism for valproic acid-mediated gene expression and cellular differentiation in AML1/ETO-positive acute myeloid leukemia cells. J Pharmacol Exp Ther 2007; 321:953 - 60; http://dx.doi.org/10.1124/jpet.106.118406; PMID: 17389244
- Kuendgen A, Schmid M, Schlenk R, Knipp S, Hildebrandt B, Steidl C, et al. The histone deacetylase (HDAC) inhibitor valproic acid as monotherapy or in combination with all-trans retinoic acid in patients with acute myeloid leukemia. Cancer 2006; 106:112 - 9; http://dx.doi.org/10.1002/cncr.21552; PMID: 16323176
- Fandy TE, Herman JG, Kerns P, Jiemjit A, Sugar EA, Choi SH, et al. Early epigenetic changes and DNA damage do not predict clinical response in an overlapping schedule of 5-azacytidine and entinostat in patients with myeloid malignancies. Blood 2009; 114:2764 - 73; http://dx.doi.org/10.1182/blood-2009-02-203547; PMID: 19546476
- Lane AA, Chabner BA. Histone deacetylase inhibitors in cancer therapy. J Clin Oncol 2009; 27:5459 - 68; http://dx.doi.org/10.1200/JCO.2009.22.1291; PMID: 19826124
- Stimson L, Wood V, Khan O, Fotheringham S, La Thangue NB. HDAC inhibitor-based therapies and haematological malignancy. Ann Oncol 2009; 20:1293 - 302; http://dx.doi.org/10.1093/annonc/mdn792; PMID: 19515748
- Duvic M, Vu J. Vorinostat: a new oral histone deacetylase inhibitor approved for cutaneous T-cell lymphoma. Expert Opin Investig Drugs 2007; 16:1111 - 20; http://dx.doi.org/10.1517/13543784.16.7.1111; PMID: 17594194
- Marks PA, Breslow R. Dimethyl sulfoxide to vorinostat: development of this histone deacetylase inhibitor as an anticancer drug. Nat Biotechnol 2007; 25:84 - 90; http://dx.doi.org/10.1038/nbt1272; PMID: 17211407
- Quintás-Cardama A, Santos FP, Garcia-Manero G. Histone deacetylase inhibitors for the treatment of myelodysplastic syndrome and acute myeloid leukemia. Leukemia 2011; 25:226 - 35; http://dx.doi.org/10.1038/leu.2010.276; PMID: 21116282
- Gozzini A, Rovida E, Dello Sbarba P, Galimberti S, Santini V. Butyrates, as a single drug, induce histone acetylation and granulocytic maturation: possible selectivity on core binding factor-acute myeloid leukemia blasts. Cancer Res 2003; 63:8955 - 61; PMID: 14695213
- Barbetti V, Gozzini A, Rovida E, Morandi A, Spinelli E, Fossati G, et al. Selective anti-leukaemic activity of low-dose histone deacetylase inhibitor ITF2357 on AML1/ETO-positive cells. Oncogene 2008; 27:1767 - 78; http://dx.doi.org/10.1038/sj.onc.1210820; PMID: 17891169
- Santini V, Gozzini A, Ferrari G. Histone deacetylase inhibitors: molecular and biological activity as a premise to clinical application. Curr Drug Metab 2007; 8:383 - 93; http://dx.doi.org/10.2174/138920007780655397; PMID: 17504226
- Vangala RK, Heiss-Neumann MS, Rangatia JS, Singh SM, Schoch C, Tenen DG, et al. The myeloid master regulator transcription factor PU.1 is inactivated by AML1-ETO in t(8;21) myeloid leukemia. Blood 2003; 101:270 - 7; http://dx.doi.org/10.1182/blood-2002-04-1288; PMID: 12393465
- Pabst T, Mueller BU, Harakawa N, Schoch C, Haferlach T, Behre G, et al. AML1-ETO downregulates the granulocytic differentiation factor C/EBPalpha in t(8;21) myeloid leukemia. Nat Med 2001; 7:444 - 51; http://dx.doi.org/10.1038/86515; PMID: 11283671
- Rovida E, Gozzini A, Barbetti V, Giuntoli S, Santini V, Dello Sbarba P. The c-Jun-N-terminal-Kinase inhibitor SP600125 enhances the butyrate derivative D1-induced apoptosis via caspase 8 activation in Kasumi 1 t(8;21) acute myeloid leukaemia cells. Br J Haematol 2006; 135:653 - 9; http://dx.doi.org/10.1111/j.1365-2141.2006.06365.x; PMID: 17054427
- Tenen DG. Disruption of differentiation in human cancer: AML shows the way. [Review] Nat Rev Cancer 2003; 3:89 - 101; http://dx.doi.org/10.1038/nrc989; PMID: 12563308
- Bug G, Ritter M, Wassmann B, Schoch C, Heinzel T, Schwarz K, et al. Clinical trial of valproic acid and all-trans retinoic acid in patients with poor-risk acute myeloid leukemia. Cancer 2005; 104:2717 - 25; http://dx.doi.org/10.1002/cncr.21589; PMID: 16294345
- Cimino G, Lo-Coco F, Fenu S, Travaglini L, Finolezzi E, Mancini M, et al. Sequential valproic acid/all-trans retinoic acid treatment reprograms differentiation in refractory and high-risk acute myeloid leukemia. Cancer Res 2006; 66:8903 - 11; http://dx.doi.org/10.1158/0008-5472.CAN-05-2726; PMID: 16951208
- Xu WS, Parmigiani RB, Marks PA. Histone deacetylase inhibitors: molecular mechanisms of action. Oncogene 2007; 26:5541 - 52; http://dx.doi.org/10.1038/sj.onc.1210620; PMID: 17694093
- Gurvich N, Tsygankova OM, Meinkoth JL, Klein PS. Histone deacetylase is a target of valproic acid-mediated cellular differentiation. Cancer Res 2004; 64:1079 - 86; http://dx.doi.org/10.1158/0008-5472.CAN-03-0799; PMID: 14871841
- Lane AA, Chabner BA. Histone deacetylase inhibitors in cancer therapy. J Clin Oncol 2009; 27:5459 - 68; http://dx.doi.org/10.1200/JCO.2009.22.1291; PMID: 19826124
- Fraga MF, Ballestar E, Villar-Garea A, Boix-Chornet M, Espada J, Schotta G, et al. Loss of acetylation at Lys16 and trimethylation at Lys20 of histone H4 is a common hallmark of human cancer. Nat Genet 2005; 37:391 - 400; http://dx.doi.org/10.1038/ng1531; PMID: 15765097
- Hajji N, Wallenborg K, Vlachos P, Füllgrabe J, Hermanson O, Joseph B. Opposing effects of hMOF and SIRT1 on H4K16 acetylation and the sensitivity to the topoisomerase II inhibitor etoposide. Oncogene 2010; 29:2192 - 204; http://dx.doi.org/10.1038/onc.2009.505; PMID: 20118981
- Shahbazian MD, Grunstein M. Functions of site-specific histone acetylation and deacetylation. Annu Rev Biochem 2007; 76:75 - 100; http://dx.doi.org/10.1146/annurev.biochem.76.052705.162114; PMID: 17362198
- Xie W, Song C, Young NL, Sperling AS, Xu F, Sridharan R, et al. Histone h3 lysine 56 acetylation is linked to the core transcriptional network in human embryonic stem cells. Mol Cell 2009; 33:417 - 27; http://dx.doi.org/10.1016/j.molcel.2009.02.004; PMID: 19250903
- Zhang L, Su X, Liu S, Knapp AR, Parthun MR, Marcucci G, et al. Histone H4 N-terminal acetylation in Kasumi-1 cells treated with depsipeptide determined by acetic acid-urea polyacrylamide gel electrophoresis, amino acid coded mass tagging, and mass spectrometry. J Proteome Res 2007; 6:81 - 8; http://dx.doi.org/10.1021/pr060139u; PMID: 17203951
- Licht JD. AML1 and the AML1-ETO fusion protein in the pathogenesis of t(8;21) AML. Oncogene 2001; 20:5660 - 79; http://dx.doi.org/10.1038/sj.onc.1204593; PMID: 11607817
- Dion MF, Altschuler SJ, Wu LF, Rando OJ. Genomic characterization reveals a simple histone H4 acetylation code. Proc Natl Acad Sci U S A 2005; 102:5501 - 6; http://dx.doi.org/10.1073/pnas.0500136102; PMID: 15795371
- Shogren-Knaak M, Ishii H, Sun JM, Pazin MJ, Davie JR, Peterson CL. Histone H4-K16 acetylation controls chromatin structure and protein interactions. Science 2006; 311:844 - 7; http://dx.doi.org/10.1126/science.1124000; PMID: 16469925
- Berger SL. The complex language of chromatin regulation during transcription. Nature 2007; 447:407 - 12; http://dx.doi.org/10.1038/nature05915; PMID: 17522673
- Robinson PJ, An W, Routh A, Martino F, Chapman L, Roeder RG, et al. 30 nm chromatin fibre decompaction requires both H4-K16 acetylation and linker histone eviction. J Mol Biol 2008; 381:816 - 25; http://dx.doi.org/10.1016/j.jmb.2008.04.050; PMID: 18653199
- Esteller M. Cancer epigenomics: DNA methylomes and histone-modification maps. Nat Rev Genet 2007; 8:286 - 98; http://dx.doi.org/10.1038/nrg2005; PMID: 17339880
- Brookes E, Pombo A. Modifications of RNA polymerase II are pivotal in regulating gene expression states. EMBO Rep 2009; 10:1213 - 9; http://dx.doi.org/10.1038/embor.2009.221; PMID: 19834511
- Mercurio C, Minucci S, Pelicci PG. Histone deacetylases and epigenetic therapies of hematological malignancies. Pharmacol Res 2010; 62:18 - 34; http://dx.doi.org/10.1016/j.phrs.2010.02.010; PMID: 20219679
- Nebbioso A, Clarke N, Voltz E, Germain E, Ambrosino C, Bontempo P, et al. Tumor-selective action of HDAC inhibitors involves TRAIL induction in acute myeloid leukemia cells. Nat Med 2005; 11:77 - 84; http://dx.doi.org/10.1038/nm1161; PMID: 15619633
- Göttlicher M, Minucci S, Zhu P, Krämer OH, Schimpf A, Giavara S, et al. Valproic acid defines a novel class of HDAC inhibitors inducing differentiation of transformed cells. EMBO J 2001; 20:6969 - 78; http://dx.doi.org/10.1093/emboj/20.24.6969; PMID: 11742974
- Tabe Y, Konopleva M, Kondo Y, Contractor R, Jin L, Ruvolo V, et al. PML-RARalpha and AML1-ETO translocations are rarely associated with methylation of the RARbeta2 promoter. Ann Hematol 2006; 85:689 - 704; http://dx.doi.org/10.1007/s00277-006-0148-7; PMID: 16832676
- Zapotocky M, Mejstrikova E, Smetana K, Stary J, Trka J, Starkova J. Valproic acid triggers differentiation and apoptosis in AML1/ETO-positive leukemic cells specifically. Cancer Lett 2012; 319:144 - 53; http://dx.doi.org/10.1016/j.canlet.2011.12.041; PMID: 22261333
- Asou H, Tashiro S, Hamamoto K, Otsuji A, Kita K, Kamada N. Establishment of a human acute myeloid leukemia cell line (Kasumi-1) with 8;21 chromosome translocation. Blood 1991; 77:2031 - 6; PMID: 2018839
- Lanotte M, Martin-Thouvenin V, Najman S, Balerini P, Valensi F, Berger R. NB4, a maturation inducible cell line with t(15;17) marker isolated from a human acute promyelocytic leukemia (M3). Blood 1991; 77:1080 - 6; PMID: 1995093
- Tsuchiya S, Yamabe M, Yamaguchi Y, Kobayashi Y, Konno T, Tada K. Establishment and characterization of a human acute monocytic leukemia cell line (THP-1). Int J Cancer 1980; 26:171 - 6; http://dx.doi.org/10.1002/ijc.2910260208; PMID: 6970727
- Kim HJ, Bae SC. Histone deacetylase inhibitors: molecular mechanisms of action and clinical trials as anti-cancer drugs. Am J Transl Res 2011; 3:166 - 79; PMID: 21416059
- Livak KJ, Schmittgen TD. Analysis of relative gene expression data using real-time quantitative PCR and the 2(-Delta Delta C(T)) Method. Methods 2001; 25:402 - 8; http://dx.doi.org/10.1006/meth.2001.1262; PMID: 11846609
