Abstract
Metabolic syndrome (MS) can be defined as a group of signs that increases the risk of developing type 2 diabetes mellitus (DM2). These signs include obesity, hyperinsulinemia and insulin resistance. We are interested in the mechanisms that trigger hyperinsulinemia as a step to understand how β cells fail in DM2. Pancreatic β cells secrete insulin in response to glucose variations in the extracellular medium. When they are chronically over-stimulated, hyperinsulinemia is observed; but then, with time, they become incapable of maintaining normal glucose levels, giving rise to DM2. A chronic high sucrose diet for two months induces MS in adult male Wistar rats. In the present article, we analyzed the effect of the internal environment of rats with MS, on the activity of ATP-sensitive potassium channels (KATP) and calcium currents of pancreatic β cells. After 24 weeks of treatment with 20% sucrose in their drinking water, rats showed central obesity, hyperinsulinemia and insulin resistance, and their systolic blood pressure and triglycerides plasma levels increased. These signs indicate the onset of MS. KATP channels in isolated patches of β cells from MS rats, had an increased sensitivity to ATP with respect to controls. Moreover, the macroscopic calcium currents, show increased variability compared with cells from control individuals. These results demonstrate that regardless of genetic background, a high sucrose diet leads to the development of MS. The observed changes in ionic channels can partially explain the increase in insulin secretion in MS rats. However, some β cells showed smaller calcium currents. These cells may represent a β cell subpopulation as it becomes exhausted by the long-term high sucrose diet.
Introduction
The risk of developing type-2 diabetes mellitus (DM2) increases in individuals with metabolic syndrome (MS).Citation1 The development of MS is facilitated by genetic susceptibility but depends crucially on environmental factors, which include a nutrient rich diet and low physical activity.
The main signs of MS in humans are central obesity, insulin resistance, hyperinsulinemia, reduction of high-density lipoproteins cholesterol, high plasma levels of triglycerides and high arterial blood pressure (for a review, see ref. Citation2). Hyperinsulinemia and insulin resistance are key issues to understanding MS.Citation3 We recently described that exposing Wistar young adult male rats to high sucrose in drinking water for two months induces MS.Citation4
Glucose-induced insulin secretion is a complex process of signal transduction in β cells, comprised by proximal events, which include glucose internalization through GLUT2 transporters and glucose metabolism that increase the ATP/ADP relationship, and by distal events, which include the activation of different ionic channels. Distal events start with the closure of ATP-sensitive potassium channels (KATP). These channels are heteroctamers formed by an inward rectifier potassium channel (Kir 6.2) that forms the pore of the channel and the regulatory sulfonylurea receptor 1 (SUR1) subunit, with a 4:4 stoichiometry.Citation5,Citation6 The SUR1 receptor regulates the activity of KATP channels. These subunits modulate the opening probability, binding nucleotides like ATP, MgADPCitation7,Citation8 and drugs like sulfonylureas used for type 2 diabetes treatment.Citation9 This channel is important because it translates a metabolic change into an electrical signal; ATP increases induce the closure of KATP channels. This triggers a membrane depolarization, leading to voltage sensitive Na+ and type T Ca2+ channels opening, and finally to the activation of L type Ca2+ channels, which have the largest conductance.Citation10 The resulting increase in intracellular Ca2+ triggers insulin exocytosis (for a review, see ref. Citation11).
It has been well established that MS produces hyperinsulinemia, however channel activity in β cells exposed to adiposity and MS has not been further explored. In the present study we examine the effect of MS induced by a long-term high sucrose diet, on KATP channels activity and calcium current density.
Results
MS rats gain weight and fat
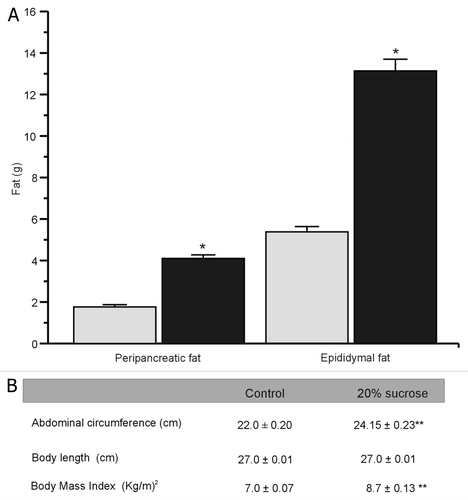
We started with two groups of adult Wistar rats with similar weights. After 24 weeks, body weight in control rats was 525 ± 7 g. In contrast body weight of the treated group was 652 ± 10 g (), without changes in mean length. The difference in weight was mainly due to the abdominal circumference in MS rats, which showed a significant increase compared with controls (). Peripancreatic fat for the control and the treated groups was 1.8 ± 0.1 and 4.1 ± 0.2 g, respectively, while epididymal fat was 5.4 ± 0.3 and 13.1 ± 0.6 g (), respectively. This was correlated with the body mass index (BMI) that increased significantly in the treated group ().
Figure 1. After 24 weeks of treatment with 20% sucrose in drinking water the MS rats gain weight. Bars represent mean ± SE (n = 91), initial and final weight of control (white bars) and MS group (black bars) *p < 0.01, with respect to final control weight.
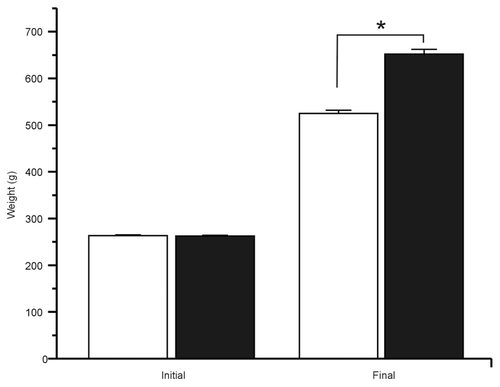
Figure 2. MS rats accumulate peripancreatic and epididymal fat. (A) Bars represent mean ± SE (n = 91) of control (gray bars) and MS rats (black bars), *p < 0.01 with respect to control group. (B) Abdominal circumference, body length and body mass index (BMI). Data are expressed as mean ± SE, (n = 91 rats). **p < 0.01, with respect to control group.
Intraperitoneal glucose tolerance test and insulin tolerance test
Insulin action on target tissues was explored by an intraperitoneal glucose tolerance test (IPGTT) and an insulin tolerance test (ITT). As shown in , after 15 min of glucose instillation in GTT, both groups showed a glycemic peak followed by a gradual decrease in plasma glucose levels. The control group reached the basal glucose level in 2 h while MS rats showed a slower glucose clearance and, after 2 h, did not reach the basal glucose level.
Figure 3. (A) Control and MS rats, were intraperitoneal (i.p.) injected with glucose (2 g/kg body weight), control in white and MS rats in black symbols. Blood glucose was measured at time shown. Data expressed as mean ± SE **p < 0.05; *p < 0.01 compared with control (n = 27). (B) Insulin (0.2 U/kg body weight) was administered i.p. via to both groups, blood glucose was measured at time shown. Data expressed as mean ± SE, #p < 0.05; compared with control (n = 6).
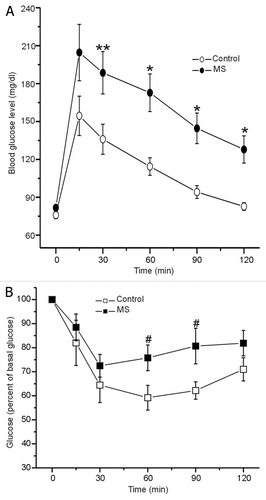
On the other hand, after 30 min of insulin administration (ITT, 0.2 U/kg, i.p.), blood glucose levels decreased by 30%, compared with basal levels (). However, despite of being hyperinsulinemic, MS rats increased their glucose levels at 60 and 90 min, while the control group showed a 40% reduction in glucose levels at these time points. Both experiments indicate that peripheral insulin sensitivity on MS rat is decreased.
Metabolic changes
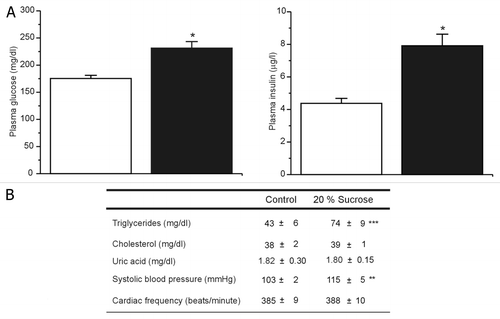
After 24 weeks of treatment, MS rats showed hyperinsulinemia, hyperglycemia and increased levels of triglycerides in plasma compared with controls (), while no differences were observed in cholesterol and uric acid plasma levels (). The high sucrose diet also increased, mildly but significantly, the systolic blood pressure (SBP) without changes in cardiac frequency ().
Figure 4. Metabolic status after 24 weeks of treatment. (A) Plasma glucose and insulin levels, the bars represent the mean ± SE (n = 61) of control (white bars) and MS rats (black bars) *p < 0.01 with respect to control group. (B) Plasma triglycerides and cholesterol levels (n = 32), systolic blood pressure and cardiac frequency (n = 21). Data are expressed as mean ± SE, **p < 0.01, ***p < 0.05 with respect to control group.
Changes in ATP-sensitive potassium channels and calcium currents of β cells in metabolic syndrome
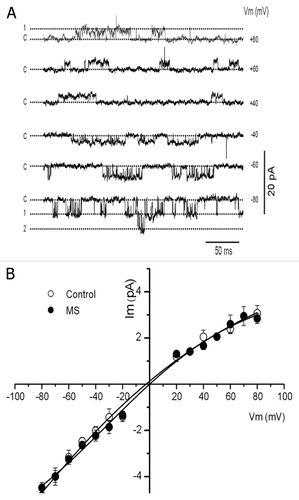
The activity of KATP channels was recorded in membrane patches with inside-out configuration and symmetrical potassium concentration (high K+ solution). In , unitary currents were plotted as a function of membrane potential and fitted to a linear equation; the conductance was 53 ± 5 (n = 9) and 50 ± 2 pS (n = 13) for control and MS patches, respectively.
Figure 5. ATP-sensitive potassium channels in the inside-out patches. (A) KATP channels activity for control patch at different membrane potentials. C, 1 and 2 corresponds to different current levels. (B) Current to voltage relationship for single channels, recorded in inside-out configuration and symmetrical potassium concentration (high potassium solution). The conductance was 53 ± 5 and 50 ± 2 pS for control (n = 9) and MS (n = 13) patches respectively. Data are expressed as mean ± SE.
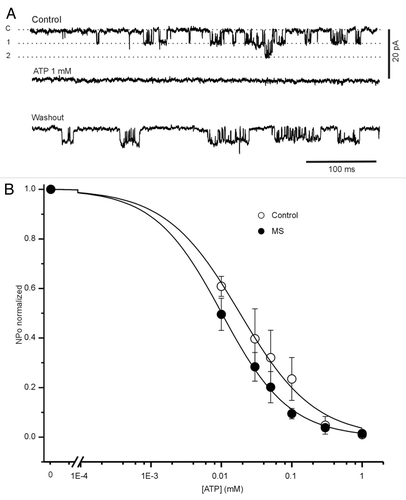
In both conditions, the activity of KATP channels was completely blocked with ATP (1 mmol/L), which is shown in for control condition. To study the sensitivity of KATP channels to ATP in control and in MS cells, we examined their activity at different ATP concentrations, as shown in . The mean Kd for ATP was 18.3 ± 0.01 μM (n = 6 patches) and 10.1 ± 0.9 μM (n = 13 patches) for control and MS cells, respectively (p < 0.05 with respect to control), without significant changes in h coefficient (see Methods). This Kd change indicates that the channel closes at lower ATP concentrations in the MS β cells, due to an increased sensitivity to this metabolic signal.
Figure 6. Pancreatic β cells from MS rats are more sensitivity to ATP. (A) Effect of ATP over the activity of single potassium channel recorded from control patch (at -50 mV) under control condition, in the presence of ATP (1 mM) and after washout. C, 1 and 2 corresponds to different current levels. (B) Open probability as a function of ATP concentration plot. The data were fitted to Hill equation, Kd and h were: 18.3 ± 0.01 μM and 1 ± 0.01 for control (open circle; n = 6) and 10.1 ± 0.9 μM (p < 0.05 with respect to control), and 0.9 ± 0.01 for MS cell respectively (black circle; n = 13). Data are expressed as mean ± SE.
shows examples of families of macroscopic calcium currents, using barium as the current carrier (IBa2+, see Methods), recorded in both control and MS β cells, cultured for 24 h. Barium current density recorded from MS cells was so variable that a single data average would be meaningless. We distinguished three behavior modes; half of the cells had low current density, we named them MS1; 35% of the cells showed large currents and were named MS2 and 15% of the cells showed no IBa2+ at all.
Figure 7. Two subpopulations of pancreatic β cells in metabolic syndrome rats according to barium current density. (A) Barium currents families recorded in cells cultured for 24 h, in control (open circle) and two types (MS1 and MS2) pancreatic β cells from MS rats. (B) Current density-voltage relationships of control (open circles, n = 19), MS1 (black circle, n = 13) and MS2 (black square, n = 9). Data are expressed as average ± SE (C) Voltage activation curve for each cell type in (B). The V1/2 and k values are: -0.6 ± 2 mV and 8.4 ± 0.8 for control, and -10 ± 3 mV and 10.3 ± 0.6 for MS1; -5 ± 2 mV and 8.4 ± 0.8 for MS2. Data are expressed as mean ± SE.
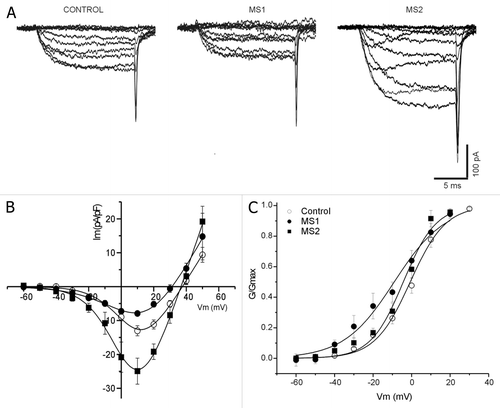
shows the relationship of IBa2+ density (pA/pF) to voltage for both control and MS cells (MS1 and MS2). All of them showed peak maximums of IBa2+ current density at nearly +10 mV. At this potential the MS1 cells IBa2+ decreased by 40%, while in MS2 cells increased by 92%, compared with control. The L-type channel blocker nifedipine (5 μM) reduced the maximum IBa2+ peak by nearly 50% in both groups (data not shown).
Voltage activation curves were analyzed with Boltzmann’s equation (see Methods). No statistically significant differences were found in half-maximal activation (V1/2) between control and MS cells; values were -0.6 ± 2 mV, -10 ± 3 mV and -5 ± 2 mV for control, MS1 and MS2, respectively. The steepness factor (k) was the same for control and MS2, 8.3 ± 0.4 and 8.4 ± 0.8, respectively. However a statistically significant difference for MS1 subpopulation 10.3 ± 0.6 was found compared with the others ().
Discussion
Pancreatic β cells secrete insulin in response to the increase of plasmatic glucose; insulin increases glucose entry to cells and nutrient storage, resulting in a decrease in plasmatic glucose. When β cells are chronically over-stimulated, they secrete more insulin for some time. Then, there comes a point when insulin secretion drops and is not enough to maintain normal plasmatic glucose levels, and hyperglycemia develops. This process is known as β cell exhaustion and leads to type 2 diabetes mellitus. In the present study we analyzed the development of metabolic syndrome and the impact of adiposity on KATP, calcium currents and insulin secretion of pancreatic β cells in young adult male Wistar rats.
The long-term changes in response to a diet with 20% sucrose in drinking water include a net gain in body weight due to an increase in abdominal fat (peripancreatic and epididymal) which results in an increased abdominal circumference. Treated rats also developed hyperinsulinemia, hyperglycemia and hypertriglyceridemia, and they experienced a mild increase in systolic blood pressure, compared with the control group. No differences in cholesterol and uric acid plasma levels were observed. According to the definition of metabolic syndrome, all these changes indicate that the high-carbohydrates intake is sufficient to develop metabolic syndrome, as previously observed with a two months long treatment.Citation4
Since Reaven’s metabolic syndrome description,Citation12 insulin resistance has been proposed as the key issue to understand its etiology. At present, it is well accepted that abdominal fat is frequently linked to insulin resistance and therefore obesity has been considered a risk factor for developing MS (for a review, see refs. Citation13 and Citation14). Waist circumference and body mass index have been included as MS signs by the World Health OrganizationCitation15 and by the National Cholesterol Education Program-Adult Treatment Panel III (NCEP-ATP III). In the present MS model, these parameters are significantly increased compared with controls. Furthermore the IPGTT shows a diminished capability of glucose clearance in MS rats, which indicates the presence of insulin resistance. In the present study, we found that the MS rats are obese, hyperinsulinemic and hyperglycemic. These results are consistent with insulin resistance observed in the IPGTT curve of MS rats, which never reached the basal glucose level, and with the ITT curve of MS rats, which showed impaired glucose internalization into insulin-sensitive tissues in spite of them being hyperinsulinemic.
At present, there are several metabolic syndrome animal models, some of them with genetic predisposition to obesity like db/db mice, ob/ob mice and Zucker diabetic fatty rats, and others using different diets to mimic metabolic syndrome (for a review, see ref. Citation16). Some variability has been observed in the results, mainly related to obesity; however this variability may be due, at least in part, to the age at which the sucrose rich diet is started. Most models use 30% sucrose in drinking waterCitation17,Citation18 starting at weaning age in male rats.Citation19-Citation22 We used young adult rats to start the treatment, because previous studies in our laboratory show that β ells undergo structural and functional modifications during the first month of life, which may determine their physiology as adults.Citation23
According to our results, the ATP sensitivity of KATP channels increases in MS membrane patches compared with control, which means that more channels would be closed at lower ATP concentrations. As mentioned above KATP channels closure triggers depolarization and activation of different voltage-gated ion channels that culminates with an increase in intracellular calcium and insulin exocytosis. Thus this increase in sensitivity is associated with hyperinsulinemia in treated rats.
The regulation of KATP channels activity is complex. ATP inhibits the channels activity while Mg-ADP,Citation7,Citation8,Citation24 PIP2Citation25 or a long chain-acyl coenzyme A esterCitation26 increases it.
Recently, it has been proposed that adenylate kinase (AK)Citation27 may control the intracellular ATP/ADP relation.Citation28,Citation29 In addition, Epac (cAMP-regulated guanine nucleotide Exchange factor) has been suggested as a β cell cAMP-sensor that facilitates the inhibitory ATP effect on KATP channels.Citation30 Furthermore, our experiments were done in membrane patches and could not rule out a possible physiologic role of these factors on KATP channel sensitivity. Further experiments are needed to clarify this issue.
Calcium channels play an important role on insulin secretion, mainly L-type which shows the highest calcium conductance. Opening of L-type calcium channels leads to a higher intracellular calcium concentration, which triggers insulin exocytosis.Citation10 We observed that after the treatment the variability in current density was very high and made difficult to get adequate means. We also observed that it was not possible to record any current in 15% of the cells. Taking this in account, we divided them in two populations of pancreatic β cells that differ in the density of their barium current, which were named MS1 and MS2. The first type had a lower and the second, a higher barium current density, compared with the control. We propose that after a 24 weeks treatment, MS1 cells begin to get exhausted, by showing less current and insulin secretion, although they show a faster activation kinetic than MS2 and control cells, indicating that they could still be secreting insulin. MS2 cells show a 92% increase of the maximum peak in barium current density that could be due to more functional channels on the membrane.
Interestingly, our model showed an insulin hyper-secreting MS2 β-cell subpopulation in which KATP channels showed ATP hypersensitivity. This would lead cells to depolarize at lower extracellular glucose concentration. In the MS1 exhausted β cell subpopulation, this fact could partially compensate the lower calcium raise. Other unidentified factors may also be involved in this process.
Changes observed in both VDCC and KATP channels explain, at least in part, the insulin hypersecretion in MS rats and suggest how cells get exhausted. Thus, opening a new window for preventing the consumption of β cells.
Materials and Methods
Reagents were obtained from the following sources: Hank’s balanced salt solution, RPMI-1640 salts, fetal bovine serum (FBS) and penicillin-streptomycin-amphotericin B solution from Life Technologies (Grand Island, NY); bovine serum albumin (BSA), 4-(2-hydroxyethyl)-1-piperazineethanesulfonic acid (HEPES), poly-l-lysine, adenosine 5′-triphosphate (ATP) potassium salt, ethylene glycol-bis [β-aminoethylether] N,N,N',N'-tetraacetic acid] (EGTA) from Sigma-Aldrich (St. Louis, MO) and collagenase type IV from Roche (Mannheim, Germany).
Animal model
Young adult Wistar rat males (250–280 g; approximately two months age) were obtained from the local animal facility for start the treatment. They were kept in a 12 h light/dark cycle, fed with standard rat chow composed by Laboratory rodent diet 5001, with 28.5% protein, 13.5% fat, and 58% carbohydrates. Ad libitum tap water was provided to control group or 20% (w/v) of sucrose solution to treated group, for 24 weeks.
All the measurements and experiments were performed on rats fasted for a 12 h period, where sucrose solution was also replaced with plain water. After the treatment, animals were anesthetized with an intraperitoneal sodium pentobarbital (40 mg/kg) injection. We obtained blood, pancreatic tissue, peripancreatic and epididymal fat samples. After sample obtaining, animals were euthanized by cervical dislocation. All methods used in this study were previously approved by the Internal Council and the Animal Care Committee of the Instituto de Fisiología Celular, Universidad Nacional Autónoma de México. Animal care was performed according to the “International Guiding Principles for Biomedical Research Involving Animals,” Council for International Organizations of Medical Sciences, 2010.
We quantified the consumption of chow and water by rats. The high-sucrose diet group (MS rats) chow consumption was 6.4 ± 0.2 g, while it was 11.2 ± 0.3 g for the control group. However, caloric intake increased by 48% in experimental animals due to the average consumption (27 ± 1 ml control group; 39 ± 1.4 ml MS group). shows the daily caloric intake per animal (12 rats) and the respective percentage according to the nutrient group.
Table 1. Nutrimental distribution and daily caloric intake
Pancreatic β cell culture
Pancreatic β cells were obtained by collagenase digestion, pancreatic islets were isolated and separated from the acinar tissue, and islets were handpicked (as described previouslyCitation31). Briefly, dissociation of the cells was achieved by incubating them in a shaker bath for 10 min at 37°C in calcium free Spinner solution, with 10 mmol/L glucose, 0.5% bovine serum albumin, 3 mmol/L EGTA (ethylene glycol-bis (β-aminoethylether) N, N, N’, N’ – tetraacetic acid) followed by mechanical disruption. Single cells were cultivated in RPMI-1640 (11.6 mmol/l glucose) supplemented with 10% fetal calf serum, 200 units/ml penicillin G, 200 μg/ml streptomycin, and 0.5 μg/ml amphotericin B.
Somatometric parameters
After treatment we took the following measures: body weight (g), abdominal circumference (AC) and body length (BL). AC was obtained by measuring the diameter of the abdominal region just above the iliac crest, whereas BL was obtained by measuring the animal length from the tip of the nose to the anus.
Intraperitoneal glucose tolerance test (IPGTT) and Insulin tolerance test (ITT)
We performed the IPGTT or ITT, two days before sacrificing the animals, which were previously fasted for a 12 h period. An intraperitoneal (i.p.) glucose (2 g glucose/kg body weight) or insulin (0.2 UI/kg body weight) injection was administered to each rat. In order to minimize stress the animals were handled by the same person. Peripheral blood samples were collected from the tail immediately before glucose administration (time 0) and 15, 30, 60, 90 and 120 min after. Glucose values were determined with a glucose reagent strip and a glucometer (Medisense, Optium Xceed, Abbott Labs. Massachusetts USA).
Blood pressure
The tail-cuff procedure was used to obtain systolic blood pressure (SBP) (With a Tail-cuff equipment, Landing). Animals were trained in several sessions before to the SBP measurement, which was done in preheated and awake rats. We performed an average of five readings to obtain individual SBP values. Normal SBP was considered between 110–135 mmHg, while hypertension was considered when values were above 140 mmHg.
Metabolic parameters
Blood samples were collected from the inferior cava vein in heparinized tubes to obtain plasma that was stored at -20°C for posterior use. Plasma insulin level was determined with a Mercodia Ultrasensitive rat insulin ELISA system (catalog no. 10–1137–10; ALPCO) and plasma glucose was measured with a glucose analysis Kit (Quantichrom, BioAssay Systems). Cholesterol and triglycerides were determined by a photometric method (assays kits manufactured by Beckman Coulter, Inc.). The plasma uric acid level was determined by a colorimetric method (Uric acid-lq, Spinreact, Spain).
Electrophysiological recordings
All electrophysiological recordings were done at temperatures between 20–22°C. The KATP single-channel current records were obtained with the inside-out patch-clamp technique.Citation32 Pipettes resistance was typically 6–10 MΩ, when filled with high-potassium solution (see bellow composition). For the unitary currents records we used an Axopatch 200B amplifier. The signals were filtered at 2 kHz amplified and sampled at 10 kHz using a Digidata 1322A A/D converter (Axon Instruments Inc.) and stored for subsequent analysis.
Twenty-four hours after seeding, cells were placed into the record chamber with the following standard solution (mmol/l): 135 NaCl, 5 KCl, 1 CaCl2, 1 MgCl2, 10 HEPES and 10 glucose (pH 7.4 with NaOH). After gigaseal the patch was excised and the internal and external faces of the membrane were bathed with the following high-potassium solution (mmol/l): 140 KCl, 1 EGTA, 1 MgCl2, 10 HEPES (pH 7.3 with KOH). The ATP was added to the high-potassium solution at the indicated concentrations.
Patch-clamp unitary currents were analyzed with pClamp9 software (Axon Instruments Inc., Foster City, CA, USA). We used current records of 30 sec durations.
The concentration-inhibition relationships were obtained calculating the open probability normalized (Po/Pomax), at different ATP concentrations, and fitting the experimental values to the Hill equation:
Where Po is the open probability of the channel, x is the concentration of the studied drug, Kd is the half-blocking concentration, and h is the Hill coefficient or slope factor that defines the steepness of the curve. All concentration-inhibition relationships were done at membrane potential of – 50 mV.
Whole cell configuration of the patch clamp technique was used to record macroscopic currents through voltage depend calcium channels (VDCC), using Ba2+ as the charge carrier and will be referred as Ca2+ currents or IBa2+.
An Axopatch 200A amplifier (Axon Instruments) was used as described previously.Citation31 Electrodes were pulled and fire polished from capillary tubes KIMAX-51 (Kimble Glass) and coated with Sylgard (Dow Corning); tip resistance was 2–4 MΩ.
External solution contained (mmol/l): 125 NaCl, 5 KCl, 2 MgCl2, 10 BaCl2, 10 HEPES, and 10 glucose. Internal solution, (mmol/l): 120 CsAsp, 10 CsCl, 5 CsF, 2.5 Cs-BAPTA, 10 HEPES, and 10 tetramethylammonium-Cl and 2.5 ATP. Na+ current was blocked with TTX (100 nmol/l). Holding potential was -80 mV; capacity transients of the pipette were canceled and total cell capacitance was determined by digital integration of capacitive transients with +10 mV pulses; series resistances were compensated by using the internal voltage clamp circuitry. And this parameter was used for identified β cells (Capacitance was 7.2 ± 0.6, 6.5 ± 0.7 and 7.3 ± 1.0 for control, MS1 and MS2 cells respectively). Remaining linear capacity transients and leakage currents were subtracted by a P/2 online procedure. Pulse protocols consisted of depolarizing test pulses of 15 ms duration, in 10 mV increments from -60 to 60 mV, and using holding potential of -80 mV. IBa2+ current activation curves were obtained by converting the peak current values into conductance: GBa2+ = IBa2+ / (Vm – ErBa2+) where IBa2+ is the peak current value, Vm is the command pulse potential, and ErBa2+ is the apparent reversal potential, obtained by extrapolation of the I-V relationships.
Conductance values were normalized and fitted to the Boltzmann equation: G/Gmax = (1 + exp -(V – V1/2)/k)−1 where G is the IBa2+ peak conductance, Gmax is the maximal IBa2+ conductance, V1/2 is the midpoint of the activation curve, and k is the activation steepness factor.
Statistical analysis
All data are reported as the mean ± SE; n denotes the number of animals analyzed. The statistical significance for P value < 0.05 was obtained with the one-way analysis of variance (ANOVA) (Stat view 4.57; Abacus Concepts).
Acknowledgments
We are grateful to Alvaro Caso for reading and discussing the manuscript, to Felix Sierra for assistance in animal care and experiments, and to Ana Ma. Escalante and Francisco Pérez Eugenio from the Computer Unit, IFC, UNAM.
Disclosure of Potential Conflicts of Interest
No potential conflicts of interest were disclosed.
Grants
This work was supported by DGAPA-PAPIIT IN215611, Gobierno del Distrito Federal PICDS08–72 and CONACYT CB2009/131647.
Author’s Contributions
VM, CL, performed experiments, participated in design of the experiments, final version of the manuscript. AVR performed uric acid quantification, GRG participated in cholesterol and triglycerides quantification, MH conceived the study, designed experiments, coordination of participants, writing the manuscript. All authors read and approved the final manuscript.
References
- Balkau B, Valensi P, Eschwège E, Slama G. A review of the metabolic syndrome. Diabetes Metab 2007; 33:405 - 13; http://dx.doi.org/10.1016/j.diabet.2007.08.001; PMID: 17981485
- Chew GT, Gan SK, Watts GF. Revisiting the metabolic syndrome. Med J Aust 2006; 185:445 - 9; PMID: 17137436
- Carey DG, Jenkins AB, Campbell LV, Freund J, Chisholm DJ. Abdominal fat and insulin resistance in normal and overweight women: Direct measurements reveal a strong relationship in subjects at both low and high risk of NIDDM. Diabetes 1996; 45:633 - 8; http://dx.doi.org/10.2337/diabetes.45.5.633; PMID: 8621015
- Larqué C, Velasco M, Navarro-Tableros V, Duhne M, Aguirre J, Gutiérrez-Reyes G, et al. Early endocrine and molecular changes in metabolic syndrome models. IUBMB Life 2011; 63:831 - 9; http://dx.doi.org/10.1002/iub.544; PMID: 21905198
- Clement JP 4th, Kunjilwar K, Gonzalez G, Schwanstecher M, Panten U, Aguilar-Bryan L, et al. Association and stoichiometry of K(ATP) channel subunits. Neuron 1997; 18:827 - 38; http://dx.doi.org/10.1016/S0896-6273(00)80321-9; PMID: 9182806
- Mikhailov MV, Campbell JD, de Wet H, Shimomura K, Zadek B, Collins RF, et al. 3-D structural and functional characterization of the purified KATP channel complex Kir6.2-SUR1. EMBO J 2005; 24:4166 - 75; http://dx.doi.org/10.1038/sj.emboj.7600877; PMID: 16308567
- Babenko AP, Gonzalez G, Bryan J. Two regions of sulfonylurea receptor specify the spontaneous bursting and ATP inhibition of KATP channel isoforms. J Biol Chem 1999; 274:11587 - 92; http://dx.doi.org/10.1074/jbc.274.17.11587; PMID: 10206966
- Sharma N, Crane A, Clement JP 4th, Gonzalez G, Babenko AP, Bryan J, et al. The C terminus of SUR1 is required for trafficking of KATP channels. J Biol Chem 1999; 274:20628 - 32; http://dx.doi.org/10.1074/jbc.274.29.20628; PMID: 10400694
- Tucker SJ, Gribble FM, Zhao C, Trapp S, Ashcroft FM. Truncation of Kir6.2 produces ATP-sensitive K+ channels in the absence of the sulphonylurea receptor. Nature 1997; 387:179 - 83; http://dx.doi.org/10.1038/387179a0; PMID: 9144288
- Yang SN, Berggren PO. CaV2.3 channel and PKClambda: new players in insulin secretion. J Clin Invest 2005; 115:16 - 20; PMID: 15630435
- Hiriart M, Aguilar-Bryan L. Channel regulation of glucose sensing in the pancreatic beta-cell. Am J Physiol Endocrinol Metab 2008; 295:E1298 - 306; http://dx.doi.org/10.1152/ajpendo.90493.2008; PMID: 18940941
- Reaven GM. Banting lecture 1988. Role of insulin resistance in human disease. Diabetes 1988; 37:1595 - 607; http://dx.doi.org/10.2337/diabetes.37.12.1595; PMID: 3056758
- Després JP. Is visceral obesity the cause of the metabolic syndrome?. Ann Med 2006; 38:52 - 63; http://dx.doi.org/10.1080/07853890500383895; PMID: 16448989
- Després JP, Lemieux I. Abdominal obesity and metabolic syndrome. Nature 2006; 444:881 - 7; http://dx.doi.org/10.1038/nature05488; PMID: 17167477
- Alberti KG, Zimmet PZ. Definition, diagnosis and classification of diabetes mellitus and its complications. Part 1: diagnosis and classification of diabetes mellitus provisional report of a WHO consultation. Diabet Med 1998; 15:539 - 53; http://dx.doi.org/10.1002/(SICI)1096-9136(199807)15:7<539::AID-DIA668>3.0.CO;2-S; PMID: 9686693
- Panchal SK, Brown L. Rodent models for metabolic syndrome research. J Biomed Biotechnol 2011; http://dx.doi.org/10.1155/2011/351982; PMID: 21253582
- Kazumi T, Yoshino G, Kasama T, Iwatani I, Iwai M, Baba S. Effects of dietary sucrose on age-related changes in VLDL-triglyceride kinetics in the rat. Diabetes Res Clin Pract 1989; 6:185 - 90; http://dx.doi.org/10.1016/0168-8227(89)90028-4; PMID: 2656168
- Toida S, Takahashi M, Shimizu H, Sato N, Shimomura Y, Kobayashi I. Effect of high sucrose feeding on fat accumulation in the male Wistar rat. Obes Res 1996; 4:561 - 8; PMID: 8946441
- Aguilera AA, Díaz GH, Barcelata ML, Guerrero OA, Ros RM. Effects of fish oil on hypertension, plasma lipids, and tumor necrosis factor-alpha in rats with sucrose-induced metabolic syndrome. J Nutr Biochem 2004; 15:350 - 7; http://dx.doi.org/10.1016/j.jnutbio.2003.12.008; PMID: 15157941
- El Hafidi M, Cuéllar A, Ramírez J, Baños G. Effect of sucrose addition to drinking water, that induces hypertension in the rats, on liver microsomal Delta9 and Delta5-desaturase activities. J Nutr Biochem 2001; 12:396 - 403; http://dx.doi.org/10.1016/S0955-2863(01)00154-1; PMID: 11448615
- Kawasaki T, Kashiwabara A, Sakai T, Igarashi K, Ogata N, Watanabe H, et al. Long-term sucrose-drinking causes increased body weight and glucose intolerance in normal male rats. Br J Nutr 2005; 93:613 - 8; http://dx.doi.org/10.1079/BJN20051407; PMID: 15975159
- McGarry JD. Banting lecture 2001: dysregulation of fatty acid metabolism in the etiology of type 2 diabetes. Diabetes 2002; 51:7 - 18; http://dx.doi.org/10.2337/diabetes.51.1.7; PMID: 11756317
- Aguayo-Mazzucato C, Sanchez-Soto C, Godinez-Puig V, Gutiérrez-Ospina G, Hiriart M. Restructuring of pancreatic islets and insulin secretion in a postnatal critical window. PLoS One 2006; 1:e35; http://dx.doi.org/10.1371/journal.pone.0000035; PMID: 17183663
- Aguilar-Bryan L, Bryan J. Molecular biology of adenosine triphosphate-sensitive potassium channels. Endocr Rev 1999; 20:101 - 35; http://dx.doi.org/10.1210/er.20.2.101; PMID: 10204114
- Shyng SL, Nichols CG. Membrane phospholipid control of nucleotide sensitivity of KATP channels. Science 1998; 282:1138 - 41; http://dx.doi.org/10.1126/science.282.5391.1138; PMID: 9804554
- Webster NJ, Searle GJ, Lam PP, Huang YC, Riedel MJ, Harb G, et al. Elevation in intracellular long-chain acyl-coenzyme A esters lead to reduced beta-cell excitability via activation of adenosine 5′-triphosphate-sensitive potassium channels. Endocrinology 2008; 149:3679 - 87; http://dx.doi.org/10.1210/en.2007-1138; PMID: 18372336
- Schulze DU, Düfer M, Wieringa B, Krippeit-Drews P, Drews G. An adenylate kinase is involved in KATP channel regulation of mouse pancreatic beta cells. Diabetologia 2007; 50:2126 - 34; http://dx.doi.org/10.1007/s00125-007-0742-9; PMID: 17704905
- Olson LK, Schroeder W, Robertson RP, Goldberg ND, Walseth TF. Suppression of adenylate kinase catalyzed phosphotransfer precedes and is associated with glucose-induced insulin secretion in intact HIT-T15 cells. J Biol Chem 1996; 271:16544 - 52; http://dx.doi.org/10.1074/jbc.271.28.16544; PMID: 8663240
- Stanojevic V, Habener JF, Holz GG, Leech CA. Cytosolic adenylate kinases regulate K-ATP channel activity in human beta-cells. Biochem Biophys Res Commun 2008; 368:614 - 9; http://dx.doi.org/10.1016/j.bbrc.2008.01.109; PMID: 18243136
- Kang G, Leech CA, Chepurny OG, Coetzee WA, Holz GG. Role of the cAMP sensor Epac as a determinant of KATP channel ATP sensitivity in human pancreatic beta-cells and rat INS-1 cells. J Physiol 2008; 586:1307 - 19; http://dx.doi.org/10.1113/jphysiol.2007.143818; PMID: 18202100
- Navarro-Tableros V, Fiordelisio T, Hernández-Cruz A, Hiriart M. Physiological development of insulin secretion, calcium channels, and GLUT2 expression of pancreatic rat beta-cells. Am J Physiol Endocrinol Metab 2007; 292:E1018 - 29; http://dx.doi.org/10.1152/ajpendo.00457.2006; PMID: 17148757
- Hamill OP, Marty A, Neher E, Sakmann B, Sigworth FJ. Improved patch-clamp techniques for high-resolution current recording from cells and cell-free membrane patches. Pflugers Arch 1981; 391:85 - 100; http://dx.doi.org/10.1007/BF00656997; PMID: 6270629
