
Abstract
Objective: To examine the relationship between maternal glucose challenge test (GCT) levels and fetal nutritional status index (FNSI: a ratio of child’s birth weight (kg) over squared maternal height (m2).
Methods: A total of 2193 women from the Beichen district, Tianjin, China, who had 50 g GCT at gestational age 24–28 weeks, gave a full-term singleton birth between June 2011 and October 2012, and with both maternal height and birth weight measures are included in this report.
Results: Approximately 28.0% of women had a GCT ≥ 7.8 mmol/L. The newborns of mothers with a GCT ≥ 7.8 mmol/L had significantly higher level of FNSI ([kg/m2], boys: 1.336 versus 1.296, p < 0.001; girls: 1.312 versus 1.268, p < 0.0001). Logistic regression results, after adjustment for maternal age, residence, education, nationality, history of disease and reproduction, insurance and gestational age, indicated that every unit increase in FNSI was associated with approximately threefold higher odds (OR [95% CI]: 3.6 [1.5, 8.9]) of being in GCT ≥ 7.8 mmol/L for women giving birth as boys and fivefold higher odds (5.9 [2.5, 14.1]) for giving birth as girls.
Conclusions: Women with a GCT ≥ 7.8 mmol/L have babies with a higher FNSI, suggesting that these infants may be overnourished before birth and may increase cardiovascular risk in their future.
Introduction
Increasing evidence has indicated that environmental factors both before birth and during infancy may have a profound influence on the risk for cardiovascular disease (CVD) in later life [Citation1]. A number of studies have observed the link between birth weight and CVD mortality and risk factors for CVD [Citation2–5]. These epidemiological observations along with evidence from experimental studies have led to a “fetal origins” hypothesis where the risk of developing some chronic diseases in adulthood is influenced not only by genetic and adult lifestyle factors but also by environmental factors present in early life [Citation6,Citation7]. Birth weight is the most common proxy indicator of fetal nutritional status used in the “fetal origins” related research, with most focused on the impact of low birth weight on the risk of CVD. This is understandable because the “fetal origins” hypothesis is derived from the observations from historical cohorts in which the subjects were born in the early twentieth century, by dramatically higher perinatal and infant mortality rates. The environmental circumstances surrounding pregnancy and childbirth have changed dramatically since that period and overnutrition is now of increasing concern. More recently, studies have consistently reported a positive association between birth weight and attained body mass index (BMI), a proxy measurement of body fat distribution and persons who are overweight or obese, measured by BMI, with an increased risk for CVD and type 2 diabetes (T2D) [Citation3,Citation8–10].
To understand the inter-relationships between fetal and mother’s nutritional status with disease markers/risks, Liu and Sempos proposed the fetal nutritional status index (FNSI) [Citation11]. The FNSI is calculated as the birth weight (kg) of child divided by squared mother’s height (m2). The rationale for the index is that the nutrition available to the fetus represents a balance between the interests of the mother and those of the fetus; fetal nutritional status is determined by both pregnancy demands (fetal growth and maternal metabolism) and nutritional supply. When food or nutritional supply is not a major concern as in developed countries, birth weight can usually be simplified as a result of a balance between fetal growth and maternal maintenance metabolism during pregnancy. Hence, it would be expected that taller mothers are more likely to have relatively larger babies; it may suggest that tall mothers and their babies are at a relatively higher risk of undernutrition due to their need for more nutrients for both fetal growth and the maintenance of normal maternal metabolism. In contrast, shorter mothers typically have relatively smaller babies. This suggests that shorter mothers and their babies are at relatively higher risk of overnutrition as relatively less energy is needed to meet both baby’s and mother’ needs. Compared to birth weight, FNSI is more sensitive to either undernutrition or overnutrition during growth in utero. It has been demonstrated that children who are subjected to either a nutritionally insufficient or an overly nutritious environment in the fetal stage have higher cardiovascular risk factors levels [Citation11].
A high maternal level of blood glucose is unfavorable for embryonic and fetoplacental development. Even with treatment, pregnant women with pre-gestational diabetes are at increased risk for congenital malformations, maternal–fetal complications, placental abnormalities and intrauterine malprogramming. Complications during pregnancy have implications for both the mother and the fetus. For such reasons, women are recommended to have a glucose challenge test (GCT) between 24 and 28 weeks of gestational age [Citation12]. High level of GCT glucose has been observed as a risk for diabetes postpartum [Citation13], and its impacts on CVD risk factors, such as obesity and metabolic syndrome, have also been reported [Citation14,Citation15]. In this context, we examined whether the FNSI is associated with the GCT levels and hypothesized that women with a high level of GCT level are more likely to have high level FNSI babies.
Subjects and methods
The sample used in this study is from a pilot project that examines the association between gestational diabetes and congenital heart defects conducted in the Beichen District of China in the city of Tianjin, which is China’s fourth largest city and is directly under the administration of the central government. Beichen District has a population of approximately 600 000 people with about 2000 births annually. The Women’s and Child’s Health Center (WCHC) in Beichen District is the caregiver for all women who are pregnant and residents in this district. All pregnant women are registered and cared for at their primary hospital. After registration, each receives a unique ID card, which links them to a computerized database, located in the city of Tianjin, which electronically records all information during each visit. All pregnant women undergo a gestational diabetes mellitus (GDM) screening test between gestational ages 24–28 weeks with a 50-g oral glucose challenge and 1 h blood glucose level measurement. All pregnant women will be usually referred to a secondary hospital (also linked to the WCHC database) in the 32nd gestational week for continuous prenatal care until delivery, unless they have a high-risk pregnancy. If the glucose challenge test (GCT) level is ≥7.8 mmol/L, the woman is referred to a secondary hospital for a 75-g oral glucose tolerance test for a further diagnosis of GMD. The study was received ethic approval from the Tianjin Women’s and Children’s Health Center and informed consent was obtained from each participant.
Between June 2011 and October 2012, a total of 2364 women gave births who were residents of Beichen District. After excluding those with multiple births (n = 49), having no valid GCT measures (n = 41), gestational age <37 weeks (n = 60) and having missing values of maternal height (n = 3), a total of 2193 women with a singleton birth remained for analysis in this report. A questionnaire was completed by each pregnant woman to provide their basic information when they came to register for prenatal care and their first obstetrical examination. It included her address, birth date, nationality, education, occupation, reproductive history, disease history and whether she had a reproductive health insurance (pregnant women are recommended to have insurance to cover the time period between conception and delivery, but it is their decision whether to have it). When women return for GCT at gestational ages 24–28 weeks, their weight (kg), height (cm) and blood pressure were also measured as part of their regular obstetrical examination.
GCT level ≥7.8 mmol/L was defined as the high-risk marker for GDM and a dichotomous variable was created to reflect this situation – yes versus no. The fetal nutritional status index (FNSI) was calculated as the child’s birth weight (kg) divided by squared mother’s height (m2). Gender-specific quartiles of FNSI were then created. The covariates in the analysis included maternal age (years), residence status (urban versus rural area), education (<9 yrs versus ≥9 yrs), nationality (Han nationality versus other minorities), disease history (positive versus negative), reproductive history (positive versus negative), reproductive health insurance (with versus without) and gestational age (weeks).
All analyses were conducted by gender using SAS 9.3 with two-tail tests and with an alpha equal or less than 0.05 set for the statistical significance. Because GCT levels were skewed positively, Spearman correlations between GCT levels and FNSI were calculated. Chi-square tests were used for categorical variables; t-test and one-way ANOVA for continuous variables in the univariate analyses. Logistic regression models were used to examine the association between high risk for GDM (≥7.8 mmol/L) and FNSI; high risk for GDM was the dependent variable in the models. The measurement FNSI was first introduced into the models as continuous variable and then as categorical variable (quartiles with the second quartile (Q2) as the referent group) with adjusting for covariates.
Results
Overall, approximately 28% (n = 614) of pregnant women in this sample were with a GCT level equal or higher than 7.8 mmol/L (). Compared to those GCT level less than 7.8 mmol/L, they were older (28.0 yrs versus 26.6 yrs, p < 0.001), shorter (161.9 cm versus 162.7 cm, p < 0.001) and with slightly smaller gestational age (39.1 week versus 39.2 weeks, p = 0.05). They were more likely to a have positive reproductive history (19.2% versus 15.2%, p = 0.03), disease history (9.9% versus 3.3%, p < 0.001) and live in urban area (75.9% versus 71.5%, p = 0.04). Their mean levels of blood pressure were higher (SBP: 109.5 mmHg versus 108.1 mmHg, p < 0.01; DBP: 71.0 mmHg versus 69.5 mmHg, p < 0.001) and also had significantly larger babies (3467.5 g versus 3389.8 g, p < 0.001).
Table 1. Basic characteristics of participants.
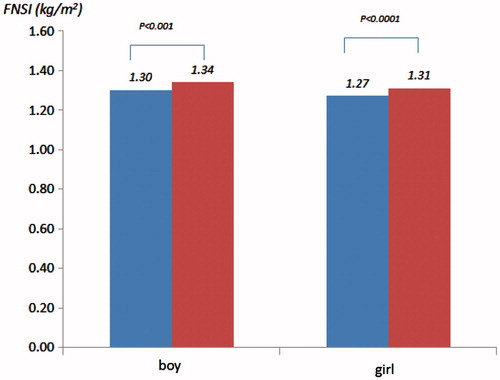
GCT level was weakly correlated to the measurement of FNSI (the Spearman coefficients were 0.12 for gender combined, 0.11 for boys, 0.12 for girls, p values are all <0.01). The mean levels of FNSI were higher in those whose mothers with a GCT level ≥7.8 mmol/L compared to those with GCT level <7.8 mmol/L in both genders ([kg/m2], boys: 1.336 versus 1.296, p < 0.001; girls: 1.312 versus 1.268, p < 0.0001) (). These differences existed following adjustment for all covariates listed above.
Figure 1. Mean levels of fetal nutritional status index by gender and glucose challenge levels (blue: GCT < 7.8 mmol/L versus red: GCT ≥ 7.8 mmol/L).
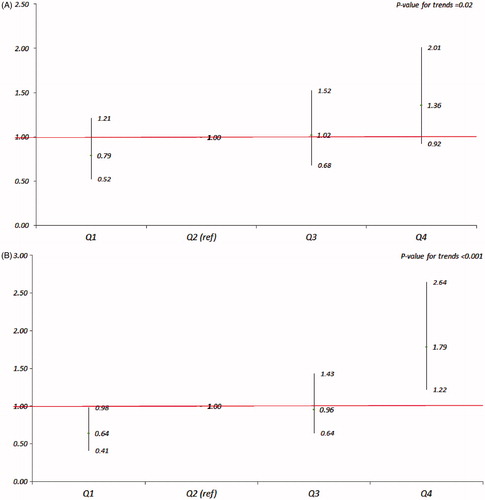
and provide adjusted odds ratios (ORs) and 95% confidence intervals (95% CIs) from logistic regression analyses. shows the ORs of GCT level ≥7.8 mmol/L for FNSI as continuous variable, and shows the ORs of GCT level ≥7.8 mmol/L for quartiles of FNSI with Q2 as the referent by gender. From the , in both genders, every unit increase in FNSI was associated with approximately threefold higher odds (OR, [95% CI]: 3.59 [1.45, 8.91]) for being in the group of GCT ≥ 7.8 mmol/L for mothers giving birth as boys and approximately sixfold higher odds (5.88 [2.45, 14.12]) for giving birth as girls. In , when compared to the referent group (Q2), the ORs (95% CIs) of being in the group of GCT ≥ 7.8 mmol/L for Q1, Q3 and Q4 were 0.79 (0.52, 1.21), 1.02 (0.68, 1.52) and 1.36 (0.92, 2.01) for boys and 0.64 (0.41, 0.98), 0.96 (0.64, 1.43) and 1.79 (1.22, 2.64) for girls, respectively; the p values for trends were <0.05 for both genders.
Figure 2. Odds ratios (95% CIs) of GCT ≥ 7.8 mmol/L for FNSI as a continuous variable by gender after adjustment for maternal age (years), residence status (urban versus rural area), education (<9 yrs versus ≥9 yrs), nationality (Han nationality versus other minorities), disease history (positive versus negative), reproductive history (positive versus negative), reproductive health insurance (with versus without) and gestational age (weeks).
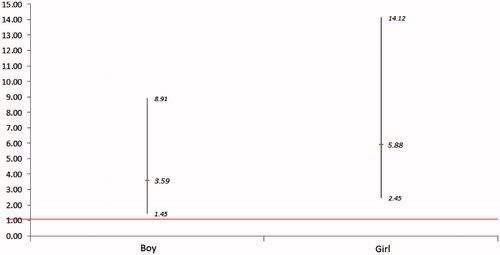
Figure 3. ORs (95% CIs) of GCT ≥ 7.8 mmol/L for quartiles of FNSI with Q2 as the referent by gender (A – boy; B – girl) after adjustment for maternal age (years), residence status (urban versus rural area), education (<9 yrs versus ≥9 yrs), nationality (Han nationality versus other minorities), disease history (positive versus negative), reproductive history (positive versus negative), reproductive health insurance (with versus without) and gestational age (weeks).
Discussion
In this study, we have observed that newborns with a higher FNSI are more likely born from mothers whose GCT levels, measured at gestational age 24–28 weeks, were equal to or higher than 7.8 mmol/L, the level used to warrant further examination for gestational diabetes mellitus. Although all pregnant women with GCT ≥ 7.8 mmol/L (n = 614) were referred for a further 75 g, 2 h oral glucose tolerance test, only 62% of them (n = 383) did so and none were diagnosed with GDM. This suggests that a high level of blood glucose during pregnancy, even if not sufficient for a diagnosis of GDM, is a risk for fetal overnutrition. The results from Gillman et al. [Citation16] indicate that women with GDM are more likely to have larger babies; however, the potential relationship between GDM and subsequent adolescent obesity is uncertain because the impact of GDM on adolescent’s risk of obesity through birth weight is greatly attenuated by adjustment for other variables, such as the mother’s BMI.
Using birth weight as a proxy indicator of fetal nutritional status has been criticized for its limitations. For instance, it cannot explain the relationship between certain risk exposure and fetus survival in the short term [Citation17]. In addition, birth weight is affected by numerous genetic and environmental factors, such as maternal race [Citation18], size, body composition [Citation19], birth order [Citation20], birth intervals [Citation21] and gender [Citation22]. Thus, the long-term impact of birth weight on health in later life may be diluted by other related risk factors. However, because FNSI reflects the inter-relationship at birth between fetal growth and maternal metabolism maintenance, it is sensitive to both undernutrition and overnutrition. It has been shown that girls aged 5–11 years within the highest quintile of FNSI (over-nutrition) had over twofold higher odds for central obesity, high level of triglycerides, low level of high-density-lipoprotein cholesterol and metabolic syndrome [Citation11]. The results from this study show that girls within the highest quartile of FNSI have much higher odds of having had mothers with a GCT level ≥7.8 mmol/L. These girls may have an elevated risk profile for cardiovascular disease in the future. We also observed that girls in the first quartile of FNSI had much lower odds of their mothers having a GCT ≥ 7.8 mmol/L. It is unclear, however, what the possible mechanism might be. When compared to the referent group (Q2) the highest quartile of FNSI in boys did not reach the statistical significance; however, a trend toward an increased OR of GCT ≥ 7.8 mmol/L was apparent with an increase level of FNSI. This may be due to that in utero, boys have higher energy demands for growth and, therefore, are relatively less sensitive to overnutrition status, but more sensitive to undernutrition status. For girls, a high but pre-diabetic level of maternal blood glucose may be considered as an overnutrition environment; therefore, placing girls at relatively higher risk of in utero overnourishment.
In summary, from this initial examination of the relationship between GCT level and fetal nutritional status using FNSI, we found that women with a GCT level ≥7.8 mmol/L during gestational ages 24–28 weeks had higher FNSI babies. Children with high levels of FNSI may be prone to develop an unfavorable cardiovascular profile in the future, particularly among girls. This finding suggests the need for longer follow-up cohort studies to examine the impact of high levels of blood glucose during pregnancy on the future health of offspring.
Declaration of interest
This study has been funded by Brock University Advancement Fund.
Acknowledgement
Thanks to Dr. John Hay for his valuable review and comments.
References
- Barker DJ. Fetal origins of coronary heart disease. BMJ 1995;311:171–4
- Richardson LJ, Hussey JM, Strutz KL. Origins of disparities in cardiovascular disease: birth weight, body mass index, and young adult systolic blood pressure in the national longitudinal study of adolescent health. Ann Epidemiol 2011;218:598–607
- Singhal A, Wells J, Cole TJ, et al. Programming of lean body mass: a link between birth weight, obesity, and cardiovascular disease? Am J Clin Nutr 2003;77:726–30
- Miura K, Nakagawa H, Tabata M, et al. Birth weight, childhood growth, and cardiovascular disease risk factors in Japanese aged 20 years. Am J Epidemiol 2001;153:783–9
- Rich-Edwards JW, Stampfer MJ, Manson JE, et al. Birth weight and risk of cardiovascular disease in a cohort of women followed up since 1976. BMJ 1997;315:396–400
- Bateson P, Barker D, Clutton-Brock T, et al. Developmental plasticity and human health. Nature 2004;430:419–21
- Gluckman PD, Hanson MA. Living with the past: evolution, development, and patterns of disease. Science 2004;305:1733–6
- Oken E, Gillman MW. Fetal origins of obesity. Obes Res 2003;11:496–506
- Pettitt DJ, Jovanovic L. Birth weight as a predictor of type 2 diabetes mellitus: the U-shaped curve. Curr Diab Rep 2001;1:78–81
- Banci M, Saccucci P, Dofcaci A, et al. Birth weight and coronary artery disease. The effect of gender and diabetes. Int J Biol Sci 2009;5:244–8
- Liu J, Sempos C. Foetal nutritional status and cardiovascular risk profile among children. Public Health Nutr 2007;10:1067–75
- American Diabetes Association. Diagnosis and classification of diabetes mellitus. Diabetes Care 2010;33:S62–9
- Retnakaran R, Qi Y, Sermer M, et al. An abnormal screening glucose challenge test in pregnancy predicts postpartum metabolic dysfunction, even when the antepartum oral glucose tolerance test is normal. Clin Endocrinol (Oxf) 2009;71:208–14
- Schaefer-Graf UM, Pawliczak J, Passow D, et al. Birth weight and parental BMI predict overweight in children from mothers with gestational diabetes. Diabetes Care 2005;28:1745–50
- Boney CM, Verma A, Tucker R, Vohr BR. Metabolic syndrome in childhood: association with birth weight, maternal obesity, and gestational diabetes mellitus. Pediatrics 2005;115:e290–6
- Gillman MW, Rifas-Shiman S, Berkey CS, et al. Maternal gestational diabetes, birth weight, and adolescent obesity. Pediatrics 2003;111:e221–6
- Wilcox AJ. On the importance – and the unimportance – of birthweight. Int J Epidemiol 2001;30:1233–41
- Collins JW Jr, Hammond NA. Relation of maternal race to the risk of preterm, non-low birth weight infants: a population study. Am J Epidemiol 1996;143:333–7
- Maternal anthropometry and pregnancy outcomes. A WHO collaborative study. Bull World Health Organ 1995;73:1–98
- Seidman DS, Ever-Hadani P, Stevenson DK, et al. Birth order and birth weight reexamined. Obstet Gynecol 1988;72:158–62
- King JC. The risk of maternal nutritional depletion and poor outcomes increases in early or closely spaced pregnancies. J Nutr 2003;133:1732S–6S
- Cogswell ME, Yip R. The influence of fetal and maternal factors on the distribution of birthweight. Semin Perinatol 1995;19:222–40