Abstract
Correct and consistent condom use can prevent susceptible people from acquiring HIV infection. However, in many countries repeated cross-sectional studies reveal a trend of increasing prevalence of HIV infection alongside an increase in reported condom use. Changes in sexual behaviour that reduce the number of new HIV infections will not become apparent through changes in HIV prevalence until some time after the behaviour change takes place. Limitations in the data used to assess condom use may also explain the concurrent increases in condom use and HIV prevalence. One common indicator of condom use, the UNGASS indicator (condom use at last higher risk sex of those aged 15–24), has been chosen to illustrate how changes in the proportion of people who report using condoms do not always explain changes in the size of the group who had high risk behaviour. Indicators based on the proportion of the whole population who have sex without using a condom would be better measures of the size of the group at highest risk of HIV infection.
Résumé
Un préservatif bien utilisé peut protéger les personnes vulnérables du VIH. Néanmoins, dans nombreux de pays, des études révèlent une prévalence croissante de l'infection parallèlement à une augmentation de l'emploi de préservatifs. Il faut du temps pour que les changements du comportement sexuel qui réduisent le nombre de nouvelles infections influencent la prévalence du VIH. Les limitations des données utilisées pour évaluer l'utilisation de préservatifs expliquent aussi que la hausse de l'utilisation de préservatifs coı̈ncide avec une hausse de la prévalence du VIH. Un indicateur commun, défini par la session extraordinaire de l'Assemblée générale sur le SIDA, a été choisi pour montrer comment l'évolution de la proportion de personnes disant utiliser des préservatifs n'explique pas toujours l'évolution de la taille du groupe ayant un comportement à haut risque. Cet indicateur est la proportion des jeunes de 15 à 24 ans ayant eu des relations sexuelles dans l'année précédente avec un partenaire avec qui ils ne vivent pas et qui ont utilisé un préservatif la dernière fois qu'ils ont eu des rapports avec ce partenaire. Les indicateurs basés surla proportion d'individus ayant eu des relations sexuelles sans utiliser de préservatif mesureraient mieux la taille du groupe à plus haut risque d'infection à VIH.
Resumen
El uso correcto y consistente del condón puede prevenir la infección con VIH en personas susceptibles. En muchos paı́ses, sin embargo, repetidos estudios transversales revelan una tendencia hacia un aumento en la prevalencia de infección de VIH junto con un aumento en el uso de condón reportado. Los cambios en el comportamiento sexual que llevan a una reducción en el número de nuevas infecciones de VIH no se traducen en cambios en la prevalencia de VIH hasta un tiempo después de que hayan ocurrido los cambios de comportamiento. Las limitaciones en los datos usados para evaluar el uso de condón también pueden explicar el aumento simultáneo en el uso de condón y la prevalencia de VIH. Se ha escogido uno de los indicadores comunes del uso de condón, el indicador UNGASS, para ilustrar cómo los cambios en la proporción de personas reportando uso de condón no siempre explican los cambios en el tamaño del grupo que tenı́a comportamientos de alto riesgo. Este indicador es la proporción de personas entre 15 y 24 años de edad que tenı́an relaciones sexuales con una pareja con la cual no convivı́a durante el último año, que usó un condón la última vez que tenı́a relaciones sexuales con esa pareja. Se medirı́a mejor el tamaño del grupo que corre el más alto riesgo de infección de VIH usando indicadores basados en la proporción de toda la población que tiene relaciones sexuales sin usar condón.
Correct and consistent condom use can prevent susceptible people from acquiring HIV infection.Citation1 Cohort studies have shown that consistent condom use is protective against HIV infection, but inconsistent use is not.Citation2 In UgandaCitation3 and Thailand,Citation4 repeated cross-sectional measurements have shown that condom use increased over the period in which HIV prevalence decreased. However, in many countries repeated cross-sectional studies reveal a trend of increasing prevalence of HIV infection alongside increased reporting of condom use within and outside cohabiting relationships, e.g. in Kenya, Tanzania and Zimbabwe.Citation5Citation6Citation7
Condom use is usually measured by asking survey respondents to recall the occasions on which they did or did not use a condom. It can be described by use on a specified occasion and the consistency of use over time. There are two units of measurement: sexual acts during which condoms are used and the people who used them. Condom use can acquire several dimensions, because patterns of use typically vary according to the relationship between sexual partners. People vary in the type(s) of partner(s) they have, both at any one point in time and over a period of time. Because sex, and condom use, are behaviours which are repeated, time is an essential component of most measures.
Condom use measures which describe the proportions of people who are using condoms (or the proportions who are not) are important for measuring the impact of programmes and also in determining the upper limit of HIV infection in the population. Measures that describe the average amounts of protected and unprotected sex which is taking place in a population may be more useful in establishing how fast HIV infection could spread through a population, and in targeting public health messages and condom promotion effectively. Uninfected people who have sex without using a condom are not at risk of contracting HIV unless the partner is infected. If the partner is infected, the risk of infection increases with coital frequency if a condom is not used, or is not used consistently. At the population level, the average risk of HIV infection will be high in populations where a large number of sex acts take place without the correct use of a condom and between discordant couples (i.e. one is infected, one is not).
It could be argued that in populations with a generalised epidemic, the demographer's and the epidemiologist's “gold standard” measure of condom use is the proportion of all sex acts in a population in which a condom is properly used. In populations where HIV infection is still concentrated among one or more subsets of people with high-risk behaviours (core groups) this measure might be misleading–the risky sex acts will not spread infection widely if they all occur among a small group of people. In such populations, a measure based on the number of people who are having unprotected sex may better describe the potential for HIV infection to spread.
Currently, most data are from cross-sectional surveys, and the aspect of condom use that is usually measured is use at last sex with a specific partner. This is largely for pragmatic reasons: it is easier to recall and report whether a condom was used on a specific occasion than to report about use in a more general sense, and it is easier to interpret a yes or no answer than one about frequency.
In populations with a generalised epidemic the existing measures based on condom use at last sex may not accurately describe the amount of unprotected sex, because they do not include information on the frequency of sex or the consistency of use.
National indicators of condom use
There is currently a focus on using key indicators of sexual behaviour to describe and track trends at national and sub-national levels. These indicators are used to assess the impact and success of AIDS prevention programmes and to allocate resources. At the UN General Assembly Special Session on HIV/AIDS (UNGASS) in June 2001, 189 countries established a declaration of commitment to a programme of national and international activities to combat HIV/AIDS. Progress towards these goals will be measured by the set of indicators outlined in the Declaration.Citation8
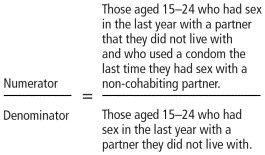
The UNGASS indicator of behaviour is the proportion of those aged 15–24 who had sex with a non-cohabiting partner in the last year who used a condom the last time they had sex with that partner. It is one of a set of condom use indicators that are based on condom use at last sex with a particular type of partner.Citation9Citation10 The behavioural indicator is called “condom use last higher risk sex”:
Figure 1 Levels of condom use at last higher risk sex and HIV prevalence for Benin, Tanzania, Uganda and Zambia, 1994–2002
Recent estimates of this indicator for Benin, Tanzania, Uganda and Zambia are given in Table 1
Table 1 Estimates of the UNGASS indicator from the most recent Demographic and Health Surveys: Benin, Tanzania, Uganda and Zambia
Condom use has been measured in a similar manner in longitudinal studies of HIV riskCitation3 and in case-control studies.Citation11 It is primarily a measure of the activity of prevention programmes and interventions, so there is no a priori reason for this to correlate with HIV prevalence. The outcome of programmes and interventions is assessed by national HIV prevalence (proportion of the population currently infected), which is easier to measure than the incidence of new infections. Therefore action is measured in programmatic terms and the results are measured in epidemiological terms.
Although condom use is clearly a key component of HIV prevention, indicators of condom use often appear contrary.
Figure 1 Levels of condom use at last higher risk sex and HIV prevalence for Benin, Tanzania, Uganda and Zambia, 1994–2002
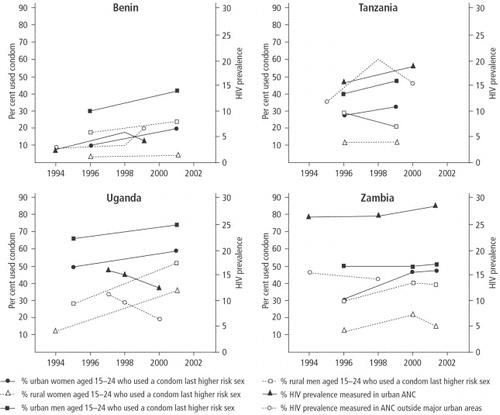
shows a clear trend in Uganda: reported condom use increased over the period as HIV prevalence decreased. Both HIV prevalence and condom use appear to be increasing over time in urban Tanzania, whilst in the rural areas condom use is stable among men and decreasing among women, with HIV prevalence fluctuating. In both Benin and Zambia condom use appears to be increasing and HIV prevalence is either increasing or stable in urban and non-urban areas.
Conclusions about the effects of condom use drawn from these comparisons are somewhat dangerous. The prevalence estimates reflect past infection rates and can suffer from bias resulting from structure of the surveillance scheme. Behavioural surveys can suffer from sampling errors and reporting and non-response bias. The methods used to estimate behaviour and prevalence may have changed over time. However, these difficulties may be overshadowed by more fundamental issues with regard to the interpretation of condom use indicators as an epidemiological risk factor for HIV infection.
Why should condom use increase at the same time as HIV prevalence?
This is in part due to the relationship between HIV prevalence and incidence. HIV prevalence changes according to HIV incidence, treatment and mortality. We can rarely measure incidence directly so we have come to rely on prevalence estimates. The long duration of infection with HIV means that prevalence changes relatively slowly. Prevalence will continue to increase whilst the number of new HIV infections is greater than the number of AIDS deaths, and this can occur even once the incidence rate has started to decline. In most countries, HIV prevalence started to increase before condom use, and the HIV epidemic has a momentum resulting from the number of infected people still mixing (sexually) with uninfected people. This means behaviour change lags behind prevalence change. In many countries, condoms may not have been commonly used before the start of the HIV epidemic, but are now being used more often in response to the (perceived) threat of HIV infection. This change in behaviour did not come about until people became aware of the risk of HIV infection and that condom use can reduce this risk. This increased awareness may have resulted from AIDS prevention campaigns or interventions, or because the impacts of HIV infection began to affect individuals directly. In many countries, the initiation and scale of HIV prevention activities has been determined by the epidemic state, but it may also have been governed by factors in addition to HIV prevalence. If behaviour change begins in response to the direct impacts of HIV prevalence on the general population, rather than as a result of prevention programmes, the HIV prevalence at the time behaviour begins to change is likely to be higher than in populations where behaviour change comes about early in the epidemic as the result of prevention programmes. Condom use can sometimes appear as a marker of increased risk for HIV infection in populations where condoms have been used in response to the HIV epidemic.Citation2Citation12
The lagging of behaviour change behind prevalence should not last indefinitely. If effective condom use increases to a sufficiently high level it should reduce the incidence of new HIV infections. After some time, prevalence will decrease in response to reduced incidence.
Measures of condom use, like other measures of sexual behaviour, do not show a simple relationship with HIV prevalence, and we should not expect to see such a relationship. Indicators of condom use can show whether programmes are having an effect, but are they useful for the demographer and the epidemiologist concerned with the scale and magnitude of the epidemic? If not, is this a cause of concern when condom use measures are used as key criteria for decisions about future HIV prevention activities? It begs the following questions:
| • | What are we trying to measure with indicators of condom use? | ||||
| • | How should we interpret condom use measures? | ||||
| • | Could we make better use of the existing data on condom use? | ||||
We try to answer these questions using the UNGASS indicator, calculated from DHS data, as an example.
Limitations of the UNGASS indicator and similar measures
Indicators of this sort describe the proportion of people who were “condom users” on the last occasion they had sex, which is easy to interpret but limited by the fact that people may not be consistent in their condom usage. The people who are inconsistent in their behaviour may be the group whose behaviour is most amenable to change. These indicators do not describe whether condoms are used properly; improper use can undermine their efficacy.
From the demographer's and the epidemiologist's point of view the most important limitation of the UNGASS indicator, and other measures of condom use, is that they do not describe the changes in the size of the group who are “at risk” of contracting HIV infection–the uninfected people who have sex without using condoms. The size of that group depends not only on condom use among the sexually active but also on what fraction of the population is sexually active. As the UNGASS indicator changes over time, it is not possible to ascertain whether the change is because of behaviour change among individuals within the sexually active group or because some individuals with different condom use patterns have joined, or left, the group.
Figure 2 Stacked bar graph showing men and women aged 15–24 at different points in time, categorised by their reported sexual behaviour in the preceding yearCitation13Citation14Citation15Citation16Citation17Citation18Citation19Citation20Citation21
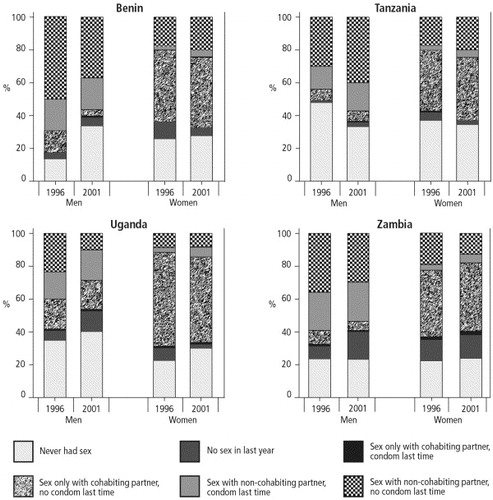
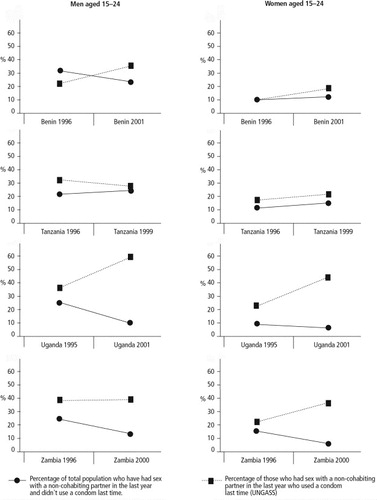
Figure 3 Trends in the size of the highest risk group and in the UNGASS indicator of condom use among men and women aged 15–24 in Benin, Tanzania, Uganda and ZambiaCitation13Citation14Citation15Citation16Citation17Citation18Citation19Citation20Citation21
The group of people described as non-cohabiting partners is likely to include several different types of sexual partner. The differing composition of this group may explain some of the differences between the countries in the estimates of condom use with non-cohabiting partners . Even among one type of non-cohabiting partner, the duration of the relationship between the partners can affect the decision about whether to use a condom. Therefore, the average HIV risk posed by non-cohabiting partners may differ between countries.
Figure 4 Trends in the levels of three indicators among young men and women in Zambia, by age group and sex, 1996–2002Citation15Citation16Citation17Citation22
emphasises that additional information on sexual mixing patterns is required to infer the size of the group most at risk of HIV infection from indicators which describe the levels of condom use. The data in are from four successive surveys in Zambia, two DHS and two sexual behaviour surveys.Citation15Citation16Citation17Citation22 The levels of condom use at last higher risk sex among women aged 20–24 are within the same range as those for men aged 15–19, but the size of the group at highest risk is very different, because fewer women than men have non-cohabiting partners.
For those concerned with the epidemiology of HIV infection in a population, the size of the highest risk group is probably a more relevant measure of condom use behaviour than the UNGASS indicator. However, it may still be limited by the reliance on last sex as a measure of typical behaviour, because this does not convey a picture of what usually happens over an extended period of time.
The consistency with which an individual uses condoms is not described by use at last sex, but this may not be an important limitation in the construction of condom use indicators. For every inconsistent user assigned to the condom users group, based on what happened at last sex, the correct number will be assigned to the non-users group. The relative distribution of the truly inconsistent users between the groups of users and non-users at last sex should reflect the proportion of the time that the inconsistent users do and do not use condoms. Some error will be introduced if inconsistent users are predisposed to report use or non-use at last sex, regardless of what actually happened, or if there is a trend over time in the frequency of use by inconsistent users.
People who have sex more often will contribute more to the overall number of sexual encounters in a given time period than people who have sex only occasionally. Indicators which rely on estimates of condom use at last sex count each person who had sex at least once in a period of time, and so highly active and less active individuals contribute equally to the measure.
The rate at which people acquire new partners and the duration of partnerships can have an important effect on the amount of condom use in a population. If condoms are used more often with newly acquired partners than with longstanding partners, the total amount of condom use will be higher in a population with a high number of predominantly short-term relationships than in a population with a smaller number, and slower turnover, of relationships that tend to last longer.
There is a drawback to using indicators of condom use at the population level to make comparisons between different populations or to compare the same population at different points in time. Even when clearly defined and properly measured, the population level indicators rely on crude distinctions. The size of the group at risk can be better described by estimating the proportion of the total population that had sex with a non-cohabiting partner without using a condom, but there are still limitations in such a measure. The distribution of the types of relationship between non-cohabiting partners is likely to differ between countries and change over time; the duration of relationships between non-cohabiting partners will vary; the frequency of sex with these partners may change over time and differ between populations. These factors influence what proportion of people use condoms, how many condoms are used (and in what proportion of acts). Most importantly, the interplay between these factors alters the risk of HIV infection attached to unprotected sex with a non-cohabiting partner.
Existing data on condom use and their limitations
Surveys capture information on condom use patterns from questions about the timing of a sex act with a partner, the use of a condom on that occasion with that partner, the relationship to the partner, whether condom use is usual with that partner, and perhaps the frequency with which the respondent usually has sex with that partner. This information may be gathered for several different types of partner, either by asking explicitly about condom use during sex with a particular type of partner, or by asking about the last partner, the penultimate partner and so on, and obtaining information on condom use and type of partner in each case. In retrospective surveys there is a limit to the number of partners and the reference period for which data can be collected, because of the reporting burden and the accuracy of recall. In particular, retrospective measures of frequency, based on questions such as “How often did you…” are subjective, especially in the light of campaigns which promote condom use. Surveys rarely collect information on the breakage or slippage of condoms; those that do are often not representative of the general population and simply ask whether this has ever happened to the respondent, which does not provide enough information to quantify how often it happens.
The information available from survey data is incomplete; we cannot enumerate all of the occasions on which condoms were used, and all of the occasions on which they were not used, for all of the survey respondents for an indefinite period of time.
The number of occasions on which condoms are used during a specified period of time is determined by coital frequency. Information on coital frequency is therefore key to understanding condom use at the population level, particularly if the two are related. This might happen if condoms are more often used with unfamiliar partners with whom sex is less frequent
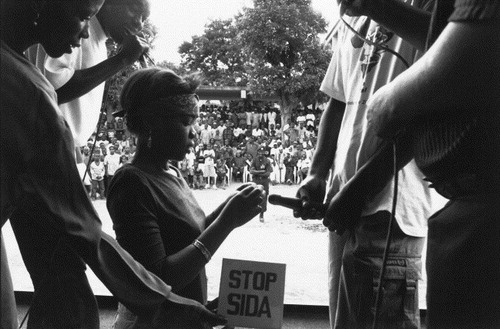
Condom use demonstration, school musical production, Maputo, Mozambique, 2002
By carefully stratifying the population according to age and marital status, survival analysis techniques can be used to determine approximate coital frequency from the distribution of time since last sex with a particular type of partner.Citation23 The information given by respondents about condom use at last sex can be used to roughly classify the person as a condom user. Additional information on the time of the first sex with each partner, and on initial condom use with that partner, would make it possible to improve such rough estimates of coital frequency and patterns of condom use. Measures based on information of this sort should provide a more accurate reflection of condom use and sexual behaviour in a population. Current measures describe the proportion of people who have sex with (or without) condoms; information on coital frequency would allow us to derive measures which describe the proportion of all sex acts in which condoms are used.
The accuracy of these estimates rests on the quality of the data. Demographic and Health Surveys are large-scale, population-based surveys, and so the data collected should be representative of the men and women in their countries. The question of whether or not these people accurately reported their sexual behaviour cannot readily be answered. Reporting bias may be a problem because the inconsistent condom users may be inclined to report condom use at the last occasion if they are aware that this is a desirable behaviour, or not to report use if condoms are stigmatised in the population.
Conclusion
This analysis confirms how far indicators of sexual behaviour and condom use differ between countries. The prevalence of condom use and the size of the risk groups are very different and do not show any association with HIV prevalence. The implications of these results are that condom use indicators cannot be used in isolation to explain risk behaviour or epidemic trends at the national level. Estimates based on the whole population, relating to non-use of condoms, describe risk behaviour better than estimates of condom use within a particular sub-group.
Acknowledgements
A previous version of this paper was presented at the seminar: “Taking Stock of the Condom in the Era of HIV/AIDS”, Gaberone, Botswana, 13–17 July 2003, organised by the International Union for the Scientific Study of Population and the Department of Population Studies, University of Botswana, and has benefited from discussion during the meeting.
References
- S Weller, K Davis. Condom effectiveness in reducing heterosexual HIV transmission. The Cochrane Library Issue 3. 2002; Update Software: OxfordAt: 〈http://cochrane.athens.ac.uk〉
- S Ahmed, T Lutalo, M Wawer. HIV incidence and sexually transmitted disease prevalence associated with condom use: a population study in Rakai, Uganda. AIDS. 15(16): 2001; 2171–2179.
- A Kamali, LM Carpenter, JAG Whitworth. Seven-year trends in HIV-1 infection rates, and changes in sexual behaviour, among adults in rural Uganda. AIDS. 14: 2000; 427–434.
- KE Nelson, DD Celentano, S Eiumtrakol. Changes in sexual behavior and a decline in HIV infection among young men in Thailand. New England Journal of Medicine. 335(5): 1996; 297–303.
- M Waithaka, R Bessinger. Sexual Behavior and Condom Use in the Context of HIV Prevention in Kenya. 2001; Measure Evaluation, Carolina Population Center, University of North Carolina, Population Services International, Kenya: Chapel Hill.
- MEASURE, National AIDS Control Programme Tanzania, Bureau of Statistics Tanzania. AIDS in Africa during the Nineties: Tanzania. A review and analysis of surveys and research studies. 2001; Carolina Population Center, University of North Carolina: Chapel Hill.
- National AIDS Council, Ministry of Health and Child Welfare, MEASURE Project, et al. AIDS in Africa during the Nineties: Zimbabwe. A Review and Analysis of Survey and Research Results. Chapel Hill: Carolina Population Center, University of North Carolina, 2002.
- United Nations General Assembly Special Session on HIV/AIDS. Monitoring the Declaration of Commitment on HIV/AIDS. Guidelines on Construction of Core Indicators. 2002; Joint United Nations Programme on HIV/AIDS (UNAIDS): Geneva.
- UNAIDS. National AIDS Programmes: A Guide to Monitoring and Evaluation. 2000; UNAIDS: GenevaAt: 〈http://www.unaids.org/publications/documents/epidemiology/surveillance/JC427-Mon&Ev-Full-E.pdf〉. Accessed 27 July 2003
- Family Health International. Behavioural Surveillance Surveys; Guidelines for Repeated Behavioural Surveys in Populations at Risk of HIV. 2000; Family Health International: Arlington.
- KE Nelson, DD Celentano, S Suprasert. Risk factors for HIV infection among young adult men in northern Thailand. Journal of the American Medical Association. 270(8): 1993; 955–960.
- LM Carpenter, A Kamali, M Payne. Independent effects of reported sexually transmitted infections and sexual behavior on HIV-1 prevalence among adult women, men, and teenagers in rural Uganda. Journal of Acquired Immune Deficiency Syndromes. 29(2): 2002; 174–180.
- Bureau of Statistics (Tanzania), Macro International. Tanzania Demographic and Health Survey 1996. 1997; Bureau of Statistics/Macro International.
- National Bureau of Statistics (Tanzania), Macro International. Tanzania Reproductive and Child Health Survey 1999. 2000; National Bureau of Statistics/Macro International.
- Central Statistical Office (Zambia) Central Board of Health, Macro. Zambia Demographic and Health Survey 2001/2. 2003; Central Statistical Office, Central Board of Health, ORC Macro: Calverton MD.
- Central Statistical Office (Zambia) Ministry of Health, Macro International. Zambia Sexual Behaviour Survey 2000. 2000; Central Statistical Office (Zambia), Ministry of Health, Macro International.
- Central Statistical Office (Zambia), Ministry of Health, Macro International. Zambia Demographic and Health Survey 1996. 1997; Central Statistical Office, Macro International.
- Institut National de la Statistique et de l'Analyse Économique ORC Macro. Enquête Démographique et de Santé au Bénin 2001. 2002; INSAE/ORC Macro.
- Kodjogbé, Nicalse G, Mboup. Enquéte Démographique et de Santé, République de Bénin 1996. 1997; Institut National de la Statistique et de l'Analyse Économique/Macro International.
- Statistics Department (Uganda), Macro International. Uganda Demographic and Health Survey 1995. 1996; Statistics Department (Uganda)/Macro International.
- Uganda Bureau of Statistics, ORC Macro. Uganda Demographic and Health Survey 2000–2001. 2001; UBOS/ORC Macro.
- Central Statistical Office (Zambia), Ministry of Health (Zambia), Project Concern International (Zambia), et al. Zambia Sexual Behaviour Survey 1998. 1999.
- H Leridon. La frequence des rapport sexuels: donnés et analyses de cohérence. Population. 5: 1993; 1381–1408.