
Abstract
Background
Myelination is a dynamic process starting during fetal life and proceeds predominantly after birth in a well-defined, predetermined manner. MR techniques such as diffusion-weighted images and the measurement of the apparent diffusion coefficient (ADC) have been applied to the study of normal brain development.
Aim of the work
To demonstrate the role of Diffusion Weighted Imaging and ADC maps in assessing normal progression of the infantile brain myelination.
Patients and methods
The present work included 30 infants with normal MRI study of the brain, normal psychomotor development and normal neurological examination. Conventional MRI, DWI and ADC maps were done for all the infants, the average ADC values were calculated in selected areas in white matter.
Results
The age of studied children ranged from 1 month to 3 years, 13 males (43.3%) and 17 females (56.7%). In each of the selected areas of the white matter of the brain, examined ADC showed the highest values at birth and there was a significant decrease with age (p < 0.05).
Conclusion
ADC values decrease with progressive increase of age. Using ADC values is useful in assessment of normal myelination development in the infantile brain and matches the results of conventional MRI.
1 Background
Myelination is a dynamic process that starts during fetal life and proceeds predominantly after birth, at least until the end of the third year in a well-defined predetermined manner.Citation1
It is useful to characterize myelination evolution in normal brain development in order to allow assessment of neurodevelopment that can enhance our understanding of early brain growth changes during both normal and abnormal brain development.Citation2
MR imaging is a safe, noninvasive method for evaluating the development of myelination in infants. Diffusion weighted MRI and ADC maps depend on the fact that as the formation of myelin by the oligodendrocytes proceeds, an increase in brain cholesterol and glycolipids concentration and a decrease in water content take place. This results in a change of white matter diffusion properties.Citation3
Myelination begins at around 20 weeks gestational age (GA) and continues up to around 2 years of age. As myelination precedes, the water content of white matter (WM) decreases, causing a reduction in signal intensity (SI) on T2 weighted imaging. There is a corresponding increase in glycolipids, cholesterol and proteins, which causes an increase in SI on T1 weighted imaging. Changes in the SI of WM due to myelination are demonstrated at different ages on T1 and T2 weighted imaging. T1 weighted imaging is better at demonstrating myelination in the first 6–8 months after birth and T2 weighted imaging is better between 6 and 18 months.Citation4
The water content of the brain tissues declines between 24 weeks and term. Myelin is seen in many gray matter nuclei and white matter tracts of the brainstem and cerebellum around 28 weeks of gestational age. However, new myelin is not seen between 28 and 36 weeks gestational age.Citation5
During the first year of life, myelin spreads throughout the brain according to a predetermined scheme of chronological and topographic sequences. It proceeds centrifugally, from inferior to superior and from posterior to anterior. In the brain-stem, myelination proceeds from the dorsal to the ventral areas. In the cerebral hemispheres, it proceeds from the central sulcus toward the pole and from the occipital and parietal lobes toward the frontal and temporal lobes. Sensory fibers myelinate before motor fibers, and projection pathways earlier than association pathways; sensitive, visual, and auditory tracts are already myelinated at birth.Citation3
Diffusion magnetic resonance imaging (DWI) studies the diffusivity of water, i.e. the random microscopic movement of water molecules, or Brownian motion, induced by thermal energy. The movement of water molecules is affected by various tissue components (cell walls, membranes, intracellular organs, macromolecules).Citation6–Citation8
MR measurement of the Brownian movement of water molecules can be applied at different, increasingly complex levels: DWI, ADC maps, DTI and Tractography.Citation9
2 Aim of the work
The aim of the work is to demonstrate the role of Diffusion Weighted Imaging and ADC maps in assessing normal progression of the infantile brain myelination.
3 Patients and methods
The present work included 30 infants with the following inclusion criteria:
| 1. | Normal MRI study of the brain. | ||||
| 2. | Normal psychomotor development. | ||||
| 3. | Normal by neurological examination. | ||||
All infants included in the study underwent the following:
| 1. | Full history taking. | ||||
| 2. | Thorough clinical examination. | ||||
| 3. | All the infants were sedated and no discomfort or complications were found by care takers. | ||||
| 4. | Conventional Magnetic Resonance Imaging including T1 WI, and T2 WI were done and they were essentially normal. | ||||
| 5. | Diffusion Weighted Imaging and ADC maps were done for all the infants, the average ADC values were calculated in selected areas in the white matter as follows: | ||||
| 6. | Regions of interest of five pixels were outlined manually in these areas by using a combination of the image with a b value of 0 images and ADC maps to help identify relevant anatomy. | ||||
| 7. | Data from the medical ethics were considered, the infant’s parents were aware of examination, informed consent was obtained. | ||||
4 Imaging parameters
MR imaging performed at 1.5 T was done for all patients using both conventional and DW sequences. DW imaging was performed with a maximum diffusion-sensitizing gradient of a b value of 1000 s/mm2 in three orthogonal planes. By using an echo-planar technique, transverse images were obtained, both with and without the diffusion gradient: 6500/101 (repetition time msec/echo time msec); section thickness, 5 mm; intersection gap, 2.5 mm; field of view, 20 cm; matrix size, 128_128; one signal acquired. Conventional MR sequences comprised transverse (480/16) and sagittal (450/8) T1-weighted sequences and transverse T2-weighted sequences (3000/30–90).
5 Statistical analysis
Statistical analysis was performed. A general linear regression model was used to examine the relationship between ADC and subject age.
6 Results
The present work included 30 children with their ages ranging from 1 month to 3 years, they were 13 males and 17 females (). Nineteen of them had ophthalmological abnormalities (e.g. retinoblastoma) and were recommended for MRI for preoperative evaluation of their condition or for post management follow up, eleven had minor trauma and were recommended for MRI to exclude intracranial hemorrhage. All of them were neurologically free.
Table 1 Distribution of the studied cases according to demographic data (n = 30).
shows the minimum and maximum ADC values measured at different white matter areas of the brain of the studied population.
Table 2 Distribution of the measured ADC values in the selected white matter areas.
In each of the nine areas of the brain, examined ADC showed the highest values at birth and there was a significant decrease with age, (p < 0.05). ().
Table 3 Correlation between age and the measured ADC values.
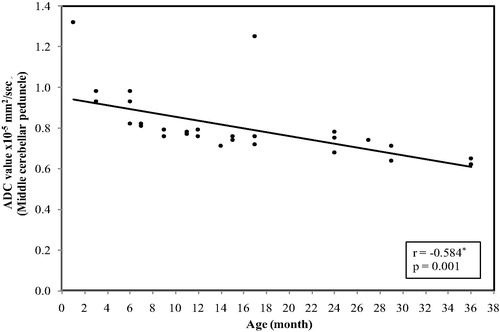
In the middle cerebellar peduncle, the ADC values ranged between (1.32 × 10⁻⁵ mm2/s) at age of 1 month and reaches(0.62 × 10⁻⁵ mm2/s) at 3 years with mean ± SD value of (0.81 ± 0.16) and median value of (0.76 × 10⁻⁵ mm2/s) ().
Figure 1 Correlation between age (by months) and ADC value in middle cerebellar peduncle. The restriction appeared at age of 3 months with significant decrease in the ADC values with progression of the age (p = 0.001).
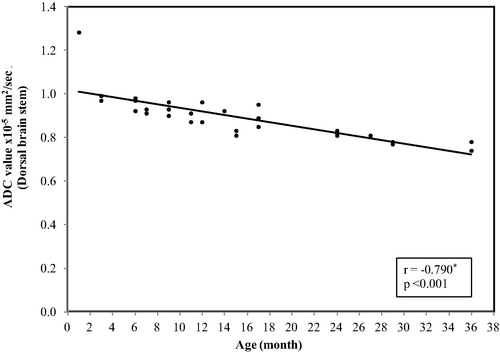
In the dorsal aspect of the brain stem, the ADC values ranged between (1.28 × 10⁻⁵ mm2/s) at age of 1 month and reaches (0.74 × 10⁻⁵ mm2/s) at 3 years with mean ± SD value of (0.89 ± 0.10) and median value of (0.90 × 10⁻⁵ mm2/s) ().
Figure 2 Correlation between age (by months) and ADC value in dorsal brain stem. The restriction was present at age of 1 month with a significant decrease in the ADC values with progression of the age (p < 0.001).
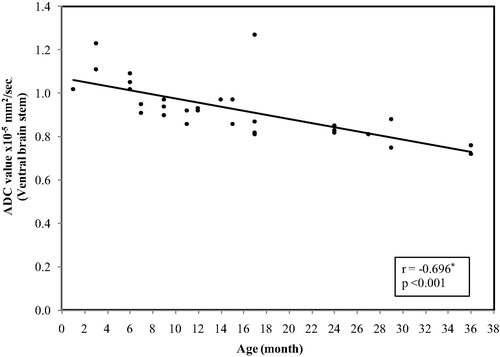
In the ventral aspect of the brain stem, the ADC values ranged between (1.27 × 10⁻⁵ mm2/s) at age of 1 month and reaches (0.72 × 10⁻⁵ mm2/s) at 3 years with mean ± SD value of (0.93 ± 0.13) and median value of (0.92 × 10⁻⁵ mm2/s) ().
Figure 3 Correlation between age and ADC value in ventral brain stem. The restriction appeared at age of 6 months in some of the cases and at the age of 7 months in other cases with a significant decrease in the ADC values with progression of the age (p < 0.001).
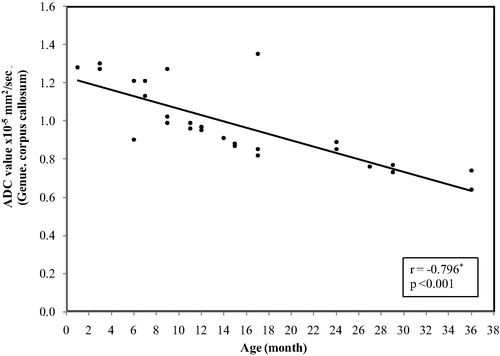
In the genu of the corpus callosum, the ADC values ranged between (1.35 × 10⁻⁵ mm2/s) at age of 1 month and reaches (0.64 × 10⁻⁵ mm2/s) at 3 years with mean ± SD value of (0.98 ± 0.20) and median value of (0.93) ().
Figure 4 Correlation between age and ADC value in genu of the corpus callosum. The restriction appeared at age of 9 months with a significant decrease in the ADC values with progression of the age (p < 0.001).
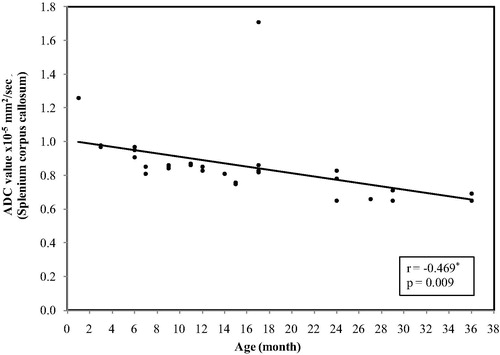
In the splenium of the corpus callosum, the ADC values ranged between (1.71 × 10⁻⁵ mm2/s) at age of 1 month and reaches (0.65 × 10⁻⁵ mm2/s) at 3 years with mean ± SD value of (0.86 ± 0.20) and median value of (0.84 × 10⁻⁵ mm2/s) ().
Figure 5 Correlation between age and ADC value in splenium of the corpus callosum. The restriction appeared at age of 3 months with a significant decrease in the ADC values with increase the age (p = 0.009).
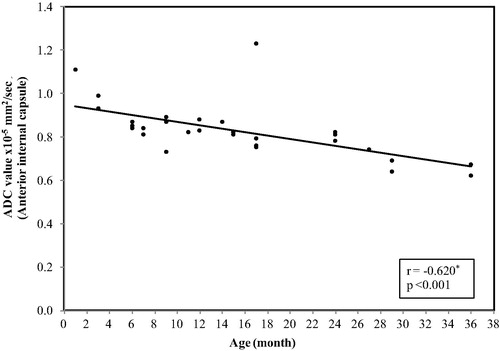
In the anterior limb internal capsule, the ADC values ranged between (1.23 × 10⁻⁵ mm2/s) at age of 1 month and reaches (0.62 × 10⁻⁵ mm2/s) at 3 years with mean ± SD value of (0.83 ± 0.12)and median value of (0.82 × 10⁻⁵ mm2/s) ().
Figure 6 Correlation between age and ADC value in anterior limb internal capsule .The restriction appeared at age of a significant decrease in the ADC values with increase the age (p < 0.001).
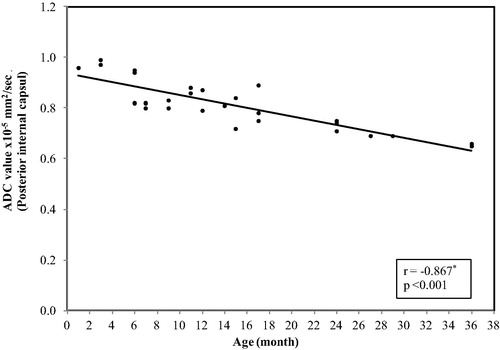
In the posterior limb of the internal capsule, the ADC values ranged between (0.99 × 10⁻⁵ mm2/s) at age of 1 month and reaches(0.65 × 10⁻⁵ mm2/s) at 3 years with mean ± SD value of (0.81 ± 0.09) and median value of (0.80 × 10⁻⁵ mm2/s) ().
Figure 7 Correlation between age (by months) and ADC value in posterior limb internal capsule. The restriction was present at age of 1 month with a significant decrease in the ADC value with increase the age (p < 0.001).
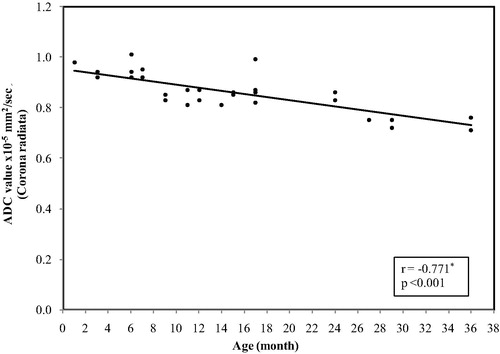
In the corona radiata, the ADC values ranged between(1.01 × 10⁻⁵ mm2/s) at age of 1 month and reaches (0.71 × 10⁻⁵ mm2/s) at 3 years with mean ± SD value of (0.86 ± 0.08) and median value of (0.86 × 10⁻⁵ mm2/s) ().
Figure 8 Correlation between age and ADC value in corona radiate. The restriction was present at age of 1 month with a significant decrease in the ADC values with increase the age (p < 0.001).
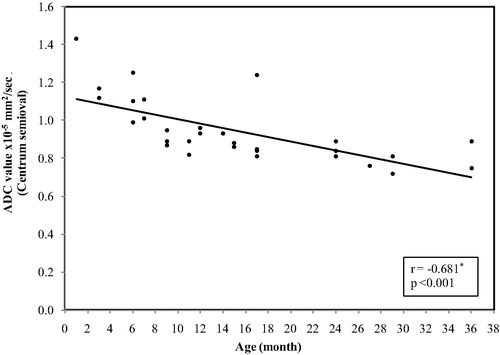
In the centrum semiovale, the ADC values ranged between(1.43 × 10⁻⁵ mm2/s) at age of 1 month and reaches (0.72 × 10⁻⁵ mm2/s) at 3 years with mean ± SD value of (0.95 ± 0.17) and median value of (0.89 × 10⁻⁵ mm2/s) ().
Figure 9 Correlation between age (by months) and ADC value in centrum semiovale .The restriction appeared at age ranging between 6 and 9 significant with a decrease in the ADC values with increase the age (p < 0.001).
7 Discussion
MR imaging is a noninvasive method for evaluating the development of myelination in infants. Diffusion weighted MRI and ADC maps depend on the fact that as the formation of myelin by the oligodendrocytes proceeds, an increase in brain cholesterol and glycolipids concentration and a decrease in water content occur. This leads to a change of white matter diffusion properties.Citation3
In the present work we measured the ADC value in selected areas of the white matter in thirty infants whose ages ranged from 1 month to 36 months. The non myelinated white matter has high water and low molecular contents and so showed non restricted ADC values (more than 1 × 10⁻⁵ mm2/s).
Neil et al. imaged 22 newborns 36 h after birth. ADC was measured in all subjects. Neil et al. reported that a correlation existed between ADC and gestational age, suggesting the potential role of brain water in the elevation of ADC in neonates.Citation10
With progression of myelination there is a drop in the water content and progressive increase of the molecular contents with consequent more restricted ADC values as confirmed by Forbes et al., Löbel et al. and Zhai et al. They used diffusion to detect the progression of myelination and their results showed a significant decrease in ADC values in the white matter with increase in the age of their subjects.Citation11–Citation13
This is also confirming the results of Engelbrecht et al. who measured the ADC values in 44 children in variant white matter locations including the genu and splenium of the corpus callosum, the anterior and posterior limb of the internal capsule, the middle cerebellar peduncle, frontal and occipital white matter and the anterior and posterior pons. These sites showed non restricted ADC values before the brain maturation and restricted ADC values after brain maturation.Citation14
Our results revealed that water diffusion of the measured white matter locations decreased during maturation, with the most significant change within the first year thereafter becoming more gradual.
Robust negative correlations were found between age and the measured average ADC values in each of the measured locations (p < .005), these findings were consistent with the findings reported in a study by Zhang et al.Citation15
The differences in ADC we detected in white matter match with those predicted noted from the sequential pattern of myelination observed in conventional MR studies.
8 Conclusion
It is important to characterize myelination evolution in normal brain development in order to better study demyelination diseases. Diffusion-weighted images and the measurement of the ADC can be applied to the study of normal brain development and myelination. ADC values decrease with progressive increase of age. Using ADC values is helpful in the assessment of the normal myelination development in the infantile brain and matches the results of the conventional MRI imaging.
Conflict of interest
None declared.
Notes
Peer review under responsibility of Alexandria University Faculty of Medicine.
Available online 16 June 2015
References
- S.C.DeoniE.MercureA.BlasiD.GasstonA.ThomsonM.JohnsonMapping infant brain myelination with magnetic resonance imagingJ Neurosci3122011784791
- B.Aubert-BrocheV.FonovI.LeppertG.B.PikeD.L.CollinsHuman brain myelination from birth to 4.5 yearsMed Image Comput Comput Assist Interv11Pt. 22008180187
- C.ParazziniE.BianchiniF.TriulziMyelinationP.Tortori-DonatiR.BiancheriA.RossiC.RaybaudPediatric neuroradiology: brain head, neck and spine2010SpringerNew York2140
- A.J.BarkovichConcepts of myelin and myelination in neuroradiologyAJNR Am J Neuroradiol21200010991109
- S.J.CounsellE.F.MaaloufA.M.FletcherP.DugganM.BattinH.J.LewisMR imaging assessment of myelination in the very preterm brainAJNR Am J Neuroradiol232002872881
- A.CherubiniG.LuccichentiF.FasanoP.PeranG.E.HagbergE.GiugniImaging nervous pathways with MR tractographyRadiol Med11122006268283
- P.G.NuciforaR.VermaS.K.LeeE.R.MelhemDiffusion-tensor MR imaging and tractography: exploring brain microstructure and connectivityRadiology24522007367384
- M.WahlY.O.LiJ.NgS.C.LahueS.R.CooperE.H.SherrMicrostructural correlations of white matter tracts in the human brainNeuroimage5122010531541
- D.K.JonesStudying connections in the living human brain with diffusion MRICortex4482008936952
- J.J.NeilS.I.ShiranR.C.McKinstryG.L.SchefftA.Z.SnyderC.R.AlmliNormal brain in human newborns: apparent diffusion coefficient and diffusion anisotropy measured by using diffusion tensor MR imagingRadiology209119985766
- K.P.ForbesJ.G.PipeC.R.BirdChanges in brain water diffusion during the 1st year of lifeRadiology22222002405409
- U.LobelJ.SedlacikD.GullmarW.A.KaiserJ.R.ReichenbachH.J.MentzelDiffusion tensor imaging: the normal evolution of ADC, RA, FA, and eigenvalues studied in multiple anatomical regions of the brainNeuroradiology5142009253263
- G.ZhaiW.LinK.P.WilberG.GerigJ.H.GilmoreComparisons of regional white matter diffusion in healthy neonates and adults performed with a 3.0-T head-only MR imaging unitRadiology22932003673681
- V.EngelbrechtA.SchererM.RassekH.J.WitsackU.ModderDiffusion-weighted MR imaging in the brain in children: findings in the normal brain and in the brain with white matter diseasesRadiology22222002410418
- L.ZhangK.M.ThomasM.C.DavidsonB.J.CaseyL.A.HeierA.M.UlugMR quantitation of volume and diffusion changes in the developing brainAJNR Am J Neuroradiol26120054549