
 ?Mathematical formulae have been encoded as MathML and are displayed in this HTML version using MathJax in order to improve their display. Uncheck the box to turn MathJax off. This feature requires Javascript. Click on a formula to zoom.
Abstract
Beach rock is a peculiar formation when compared to other types of rock formations. One such formation is found in Andaman and Nicobar Island of India. It needs intensive and extensive investigation on its formation. The present work aimed to collect the beach rock samples along the Coast of Andaman Island and subjected to mineral and multi-elemental analysis using spectroscopic techniques. The presence of mineral in beach rock samples is identified by FT-IR spectroscopic technique. The constituents of minerals present in the beach rocks are further confirmed by XRD technique. Elemental concentrations of beach rock samples have been analyzed using non-destructive technique of energy dispersive X-ray fluorescence (EDXRF) spectrometry. The concentrations of Al, Ca, K, Fe, Ti, Si, V, Co, Cu, Ba, Zn, Pb, Cd & Mn are determined. The geochemical behavior of elements in the region is discussed. The spectroscopic techniques reveal the cementing minerals and elemental compositions of beach rocks of Andaman Island, India. Results are discussed and the conclusions are drawn.
Keywords:
1 Introduction
Beach rock formation is peculiar compared to other types of rock formations. It is a sedimentary formation commonly appearing as layered deposit inclined towards the sea. It is influenced by the effects of carbonate cement-aragonite or magnesium calcite initially formed in the inter-tidal zone. Like the beach itself, beach rock represents a transition between the marine and meteoric environments, where processes from each environment commonly affect it. Beach rock also acts as a resistant barrier to erosion, thus affecting the shoreline's rate of erosion and overall development. However beach rock can be quite useful in describing and delineating environments of deposition [Citation1]. Beach rock forms most commonly on beaches composed of calcareous shell and coral grains, but it can also develop in beaches of quartz sand or other mineral composition. It forms best on sand beaches; shingle or conglomeratic beach rock is less abundant. The natural factor of the beach, such as gentle slope of the foreshore, sufficient shell content and ground water temperature have also favored the formation of beach rocks. Essential to beach rock development is ground water with enough calcium to provide cementing effect.
Beach rock formation is found in many places in the world [Citation2–Citation[3]Citation[4]Citation[5]Citation[6]Citation[7]Citation[8]Citation[9]Citation[10]Citation[11]Citation12] and few places in India [Citation13–Citation[14]Citation15]. The beach rock samples of Tamilnadu were analyzed for cementating minerals and to study the elemental composition Instrumental Neutron Activation Analysis (INAA) and Particle Induced X-ray Emission (PIXE) techniques were used [Citation16,Citation17]. One such beach rock formation is found in the Andman Island [Citation13]. The Quaternary rocks of Andaman-Nicobar Archipelago are very significant as they have various types of sediments capable of unraveling the climatic history, sea level variations and neotectonic activity, shore sand, beach rock, raised beaches, corals and sediments associated with mangroves are the important constituents of the Holocene deposits. Of these entire beach rocks are very significant as they represent the former strandline and hence sea level variations. The beach rocks are common all along the coastal tract of Andaman-Nicobar Archipelago [Citation13]. These islands are represented by an active sub-ariel ridge located between the Arakan-Yoma In the north and Java-Sumatra in the south (Lat 6 45 N to 13 43 N; Long 92 15 E to 94 00 E). Geologically the Andaman basin is very interesting as they have a long sedimentary record ranging from Cretaceous to Recent. The basin is studied for its geology and paleontology since a century and several valuable contributions have been made [Citation18,Citation19]. A detailed examination is required to understand the process of cementation of beach rocks of Andaman Island by studying the mineral and elemental composition using spectroscopic techniques.
The EDXRF technique is chosen for the present work due to its advantages like non-requirement of chemical treatment of the samples; it is less time consuming non-destructive method. It is a rapid multi-elemental technique. Many workers reported earlier the determination of elemental composition of various environmental matrices by EDXRF technique [Citation20–Citation[21]Citation[22]Citation[23]Citation[24]Citation[25]Citation26]. The objective of the work is to determine (i) minerals composition of beach rocks by FTIR spectroscopic study and it is confirmed by XRD technique (ii) the elemental composition of beach rocks by EDXRF (iii) comparison of elemental concentration with crustal average values.
2 Materials and methods
2.1 Sample collection and preparation
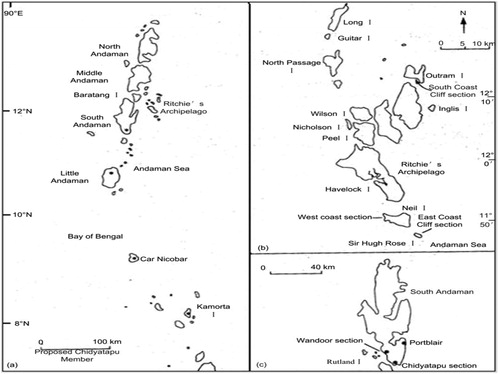
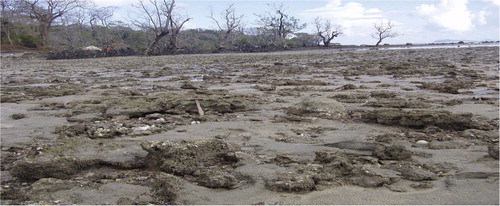
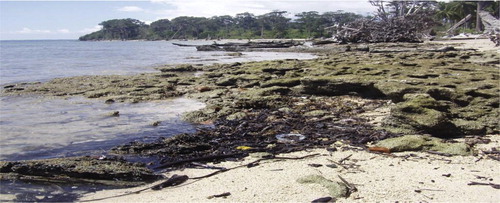
The samples were collected at three locations (Wandoor-B1-B2), (Neill Island-- B3–B4), (Chidyatapu-B5-B8) using global positioning system (QueM5 with accuracy: up to 10 m). A detailed geological survey was carried out before the fieldwork. At these localities the samples were collected along the tide line i.e. along the horizontal transect. In each location 3 – 5 samples of 2 kg bulk of beach rock samples were collected in a polythene bags. All the samples were cleaned, weathered surface removed and the remaining fresh materials crushed into small pieces. These samples are powdered using agate mortar and dried for 24 h at a temperature of 110 °C and then pulverized to particle sizes not greater than 2 mm mesh screen [Citation17]. The location map and typical beach rock photos where the samples were collected are presented in Figs. 1–3.
2.2 FT-IR technique
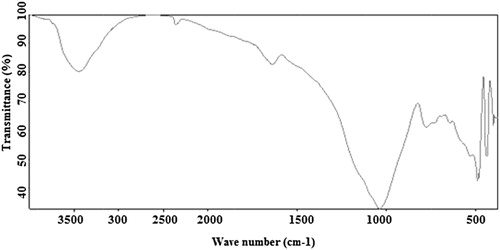
The major and minor minerals are qualitatively determined by FT-IR technique. The Bruker Alph series FT-IR is available in Department of Chemistry, Tiruvanamalai. Tamilnadu, India is made use of in the present work for recording IR spectra of the samples at room temperature in the received state. The KBr pellet technique (1:20) pellets were followed for the mineral analysis. For each samples five to six pellet specimens are prepared and the spectra were taken in the mid region of 4000-400 cm−1. The typical FT-IR spectrum is shown in Fig. 4.
2.3 XRD technique
The X-ray patterns of beach rock samples were recorded at room temperature by using X-ray diffractometer (D500, Siemens) having a curved graphite crystal diffracted monochromator, with a source of CuKα radiation and NaI(Tl) scintillation detector from Indian Institute of Technology, Chennai, Tamil Nadu, India. Qualitative mineralogy of the beach rock samples is determined with the standard interpretation procedures of XRD.
2.4 EDXRF technique
The powder samples were dried at 110 °C in an oven until no further weight loss was observed. One gram of the fine ground sample and 0.5 g of the boric acid were mixed. The mixture was thoroughly ground and pressed to a pellet of 30 mm diameter using a 15 ton hydraulic press. The prepared samples were analyzed using the EDXRF available at EOHS, EnSD, RSEG, Indira Gandhi Centre for Atomic Research (IGCAR), Kalpakkam, Tamilnadu. The instrument used for this study is a PW 4025 Minipal supplied by M/s Philips, Netherlands. The spectrometer is fitted with a side window X-ray tube (9 W) that has Rhodium as anode. The power specifications of the tube are 4–30 kV; 1 μA- 1 mA. Removable sample changer of the instrument accommodates 12 samples at a time. Selection of filters, tube voltage, sample position and current are fully computer controlled. Beam spot area (elliptical) for the instrument is 81.7 mm2. The instrument has the features of Multi Channel Analyzer (MCA) test, standardless determination and automatic gain correction. Gain correction is performed when the beam stop is in the reference position. Beam stop contains a reference sample (an alloy of aluminum and copper). Copper is used for gain correction. Al and Cu are used for instrument energy calibration. The standard stream sediment (GBW 7305) was used as reference material for standardizing the instrument and the values are presented in .
For elements Al, Ca, K, Fe, Si, Ti, V, Cu, Zn and Mn, Kα lines and for Ba, La and Pb, Lα lines were used for X-ray analysis. The region of interest for Co is 3.025–3.240 KeV while that of Cd is 6.815–7.120 KeV. For Cd and Co an exposure time of 300 s was used. For elements Al, Ca, K, Fe, Si and Ti, the exposure time was 60 s. For elements Ba, Cu, Mn, Pb, V and Zn, time of exposure was 200 s.
Table 1 Comparison of stream sediment standard values obtained using EDXRF (Elements in ppm unless % is indicated).
3 Result and discussions
3.1 FT-IR analysis
The absorption frequencies of the peaks in the spectra of each site in wave number unit (cm−1) are reported in . By comparing the observed frequencies with available literature, the minerals such as quartz, orthoclase, albite, kaolinite, montmorllinite, calcite and aragonite are identified. The mineral wise discussion is as follows.
Table 2 Observed absorption frequency in the region of 400–4000 cm−1.
3.1.1 Quartz
Quartz is ubiquitous mineral and forms one of the abundant constituent in all the samples. It is an important component of many sediments as well as sedimentary and igneous rocks. The characteristic peaks of quartz are reported by several workers [Citation27–Citation[28]Citation[29]Citation[30]Citation[31]Citation[32]Citation[33]Citation[34]Citation[35]Citation36]. It could be observed from that the infrared absorption bands appearing at 1160, 795, 775, 695 and 455 cm−1 may suggest the presence of quartz.
Out of the five peaks observed for quartz, the bands at 795–800 cm−1 and 775–780 cm−1 may be assigned due to symmetrical stretching modes and those at 690–695 cm−1 and at 455–460 cm−1 may be due to symmetrical bending mode and asymmetrical bending respectively. Out of these two stretching modes and two bending modes, 795–800 cm−1 and 690–695 cm−1 are widely used as the diagnostic peaks for quartz. Almost all workers have found that a doublet appearing at or around 795 cm−1 and 775 cm−1 is the characteristic feature of quartz. Such a clear observation is obtained in the spectra of samples (B1, B2, B4 & B6).
Most of the workers have calculated the crystallinity index of quartz using the intensity of symmetrical stretching mode lying at 800–795 cm−1 and the symmetrical bending at 700–695 cm−1. Based on the above suggestion, the nature of crystallinity of other minerals may be understood. Unfortunately, these two peaks i.e., at 800 cm−1 and at 780 cm−1 are not always appearing together for all the samples. However, it may be essential to find out the crystallinity of quartz in the samples. The 695 cm−1 peak, present only in the samples (B3, B6 & B8), gives useful information on the nature of mineral with regard to the structural stability. The intensity of this peak gives the type of crystallinity. The symmetrical bending vibrations of Si–O group obtained at 695 cm−1 is more useful to find whether it is crystalline or amorphous. In the amorphous state, 695 cm−1 peak will be missing. This is a well known fact. As the 695 cm−1 peak is exhibited by the spectra of the samples (B3, B6 & B8) the quartz mineral in these samples are in crystalline form. From , it is seen that quartz present invariably in all the samples indicates, it plays vital role for the formation of beach rocks of coastal area concerned.
3.1.2 Feldspar
The feldspars are the most important mineral groups in all rock types. They are the silicates of aluminium with potassium, sodium and calcium and rarely barium. They may belong to either the monoclinic or the triclinic systems, but the crystals of the different systems resemble each other closely in angles and crystal habit. The general formula for the feldspars can be written as WZ4 O8 in which W may be a Na, K, Ca, and/or Ba and Z is Si and/or Al, the Si:Al ratio ranging from 3:1 to 1:1. Since all feldspars contain a certain minimum amount of Al, the general formula may be some what more specifically stated as WAl (Al, Si) Si2O8, the variable (Al, Si) being balanced by variation in the proportions of univalent and bivalent cations. The potassic feldspar (KAl Si3O8) are classified into sanidine, orthoclase and microcline. Sanidine and orthoclase are monoclinic and microcline is triclinic. The plagioclase feldspar albite (Na Al Si3O8) and anorthite (CaAl2 Si2O8) have a triclinic crystal structure and form end members of solid solution.
Feldspar group of minerals have been analyzed by IR spectroscopic technique and the frequencies of absorption were reported by many workers [Citation27–Citation[28]Citation[29]Citation[30]Citation[31]Citation[32]Citation[33]Citation[34]Citation[35]Citation[36]Citation[37]Citation[38]Citation[39]Citation40]. The infrared absorption frequency of the bands at 585 cm−1, 540 cm−1, 435 cm−1 & 405 cm−1 may suggest the presence of feldspar. The peaks at 435 & 540 cm−1 are indicating the presence of orthoclase in the samples where as 405 & 585 cm−1 in all the samples indicates the presence of albite. The band assignments for different minerals are given in .
Table 3 Band assignments for different minerals of Beach rocks of Andaman Island.
The invariable presence of quartz and feldspar present in almost all the samples indicates that these are ubiquitous minerals in sediments. Quartz is primarily a detrital mineral, although it is authigenic in origin. Feldspar also plays a role subordinate to that of quartz in sediments. Beach rock can form from sand and gravel of almost any composition, including quartz and feldspar but carbonate sand provides the most common framework for formation. In view of this, quartz and feldspar may be considered to be the constituents of beach rocks and sediments. In the study area these two minerals are found to occur but forming lower proportion as reflected from the number and area of the peaks.
3.1.3 Carbonate minerals (calcite, aragonite and dolomite)
The major absorption bands of carbonate spectra in the 5000–666 cm−1 region have been attributed to the fundamental vibrations of the carbonate radical, and various bands have been assigned to correspond to the vibrations of the carbon and oxygen atoms along the crystallographic axial directions.
From the , the presence of calcite in samples is identified from i.r. absorption bands occurring at 2875, 2515, 1800, 1425, 875 & 715 cm−1. The i.r. absorption bands at 1785, 1475, 1080 & 855 cm−1 are present in the samples identified by aragonite [Citation27–Citation[28]Citation40] and also dolomite is identified by the presences of i.r, absorption band at 2525 cm−1 by comparing with other workers [Citation27–Citation[28]Citation[29]Citation[30]Citation[31]Citation[32]Citation[33]Citation[34]Citation[35]Citation[36]Citation[37]Citation[38]Citation[39]Citation40].
The IR spectra of calcite and dolomite are characterized by bands at 715 cm−1 and 725 cm−1 respectively. These bands appear unperturbed and sharp with varying intensity depending on the concentration of these minerals. But in the present study the 725 cm−1 peak is completely absent in all the samples showing the absence of dolomite. If dolomite was present, then phase change would have occurred at lower temperature.
The large number peaks of calcite in the infrared (i.r) spectrum indicate the abundance of calcite in the samples and it may be due to the typical beach rock formation. Beach deposits along many coasts were cemented with either aragonite or calcite because some of these beach rock derive their cement from seawater. Seawater is several times supersaturated with respect to calcite and aragonite and also it is the source of the cementing agent calcium carbonate.
3.1.4 Clay minerals (kaolinite, montmorillonite & illite)
➣Kaolinite
Kaolinte is a clay mineral crystallizing in the monoclinic system and forming the chief constituent of china clay and Kaolin. It is a hydrous aluminum silicate commonly formed by weathering and decomposition of rocks containing aluminum silicate compounds; feldspar being the chief source. Kaolinite is present in the samples by the absorption band at 3690, 3660, 3620, &1035 cm−1 variably in the samples under investigations as is evidenced from the [Citation41–Citation[42]Citation[43]Citation44].
➣Montmorillonite
Montmorillonite is a very soft phyllosilicate mineral that typically forms in microscopic crystals, forming clay. From the values reported in , the presence of montmorillonite is shown by the absorption band at 475 & 3445 cm−1 [Citation41–Citation[42]Citation[43]Citation44]. The most distinguishing feature of the montmorillonite spectrum is the broad absorption band that ranges from 3300 to 3500 cm−1. This band typically centered around 3400 cm−1 may be due to H–O–H stretching of water molecules present in the interlayer region of montmorillonite [Citation41–Citation[42]Citation[43]Citation44].
➣Illite
Illite is a non-expanding, micaceous mineral. It occurs as an alteration product of muscovite and feldspar in weathering and hydrothermal environments. It is common in sediments, soils and argillanceous sedimentary rocks as well as in some low grade metamorptic rocks. Infrared features of illite are rarely diagnostic because it is so variable in chemical composition. The presence of peak around 915 cm−1 in the samples is attributed to illite, it is reported in [Citation41,Citation42].
Clay minerals such as kaolinite and montmorillonite are present in almost all the samples. Kaolin and montmorillonite appears to arise from the weathering of many kinds of rocks under various climatic conditions. All, therefore, are found in residual soils. Although the clay minerals occur in sediments, kaolinite is the characteristic mineral of an acidic fresh water environment whereas illite or montmorillonite signify an alkaline or sodic lake. The presumed differences however, seem not to be applicable to the fresh, brackish and marine facies of the mollasse. Hence the presence of clay minerals in the samples may contribute towards the occurrence of beach rock formation.
3.2 XRD analysis
Qualitative mineralogy of the beach rock samples is determined with the standard interpretation procedures of XRD. Major mineral in the studied sample is quartz and calcite. The mineral wise discussion is as follows. Fig. 5 shows the ypical XRD spectrum of beach rocks of Andaman Island.
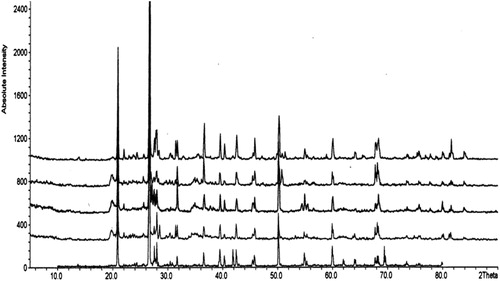
3.2.1 Quartz
Quartz is ubiquitous and forms one of the most abundant mineral in all the samples. It is identified by the distinctive reflection at 4.26 Å, 3.34 Å, 2.46 Å, 2.28 Å, 2.24 Å, 1.85 Å, 1.67 Å, 1.54 Å, 1.45 Å, 1.38 Å and 1.18 Å.
3.2.2 Feldspar
The feldspar mineral is invariably present in all samples. Albite is identified by basal reflection at 4.03 Å, 3.64 Å, 3.24 Å, 3.13 Å, 3.18 Å, 3.14 Å, 2.93 Å, 2.84 Å, 2.27 Å and 1.98 Å. The basal reflection at 3.771 Å, 3.21 Å, 2.98 Å, 499 Å, 1.44 Å and 1.333 Å indicate the presence of orthoclase.
3.2.3 Clay mineral
The clay mineral kaolinte is identified in the samples by basal reflection at 1.66 Å, 1.78 Å, 3.54 Å and 3.59 Å.
3.2.4 Carbonate minerals
➣Calcite
Calcite is identified as the most abundant mineral in the samples by the presence of large no of peaks in diffractogram. It is identified distinct reflections in the d spacing of 3.03 Å 3.838 Å, 2.832 Å, 2.278 Å, 2.090, 1.925 Å, 1.909 Å, 1.872 Å, 1.621 Å, 1.602 Å, 1.521 Å and 1.438 Å.
➣Aragonite
It is identified by the basal reflections at 3.391 Å, 2.693 Å, 2.487 Å, 1.977 Å, 1.619 Å, 1.436 Å and 1.415 Å.
3.3 EDXRF analysis
Concentrations of elements of interest (Al, Ca, K, Fe, Ti, Si, V, Cu, Co, Cd, Ba, Zn) in beak rock samples of Andaman measured for samples B1(Wandoor), B3 (Neil Island) and B5 (Chidayatapu) using EDXRF are reported in . The measured elemental concentrations are compared with the crustal average and also beach rocks of Tamilnadu in . The quantitative and qualitative analyses of elements are discussed below. Al, Fe, K and Ti contents are found to be much less than both the values of earth crust and beach rocks of Tamilnadu. While Si content is found to be less than the crustal average, Ca has been found to be much more than both crustal average and Tamilnadu region. Trace metals V, Co & Mn are found to be much less than both crustal average and Tamilnadu region. While other trace metals; Cu, Ba, Zn, and Cd are less than the crustal values. However, there is no change in the Pb values. The typical EDXRF spectrum of beach rock given in Fig. 6.
❖Aluminum (Al)
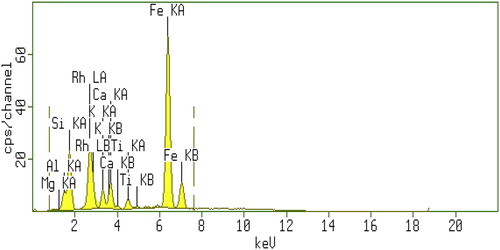
Table 4 Elemental concentration of Beach rock samples of Andaman Island (in ppm unless % is indicated).
Table 5 Comparison of Beach rock samples of Andaman Island of the present study to crustal average and Beach rocks of Tamilnadu, India (in ppm unless % is indicated).
Aluminum is a chemically stable and usually non-anthropogenic element. It is considered as an index of the aluminosilicate content of sediment and also used as an indicator of terrigenous debris of which the clay minerals and feldspar are quantitatively the most important. From the , it is seen that Al concentration varied from 0.13 to 0.97% with an average of 0.44%. B1 and B5 recorded the lowest and highest concentration respectively. The lowest value at B1 may be due to the increased percentage of sand and calcium carbonate. The highest concentration at B5 suggests a higher degree of weathering and reflects the degree of influence of finer nature of sediments. The variation of Al content of the samples probably reflect the diverse influence of terrigenous and authigenic materials [Citation45].
❖Calcium (Ca)
In general, Calcium was found to be the most abundant element in beach rock samples. It was found to be the more dominant element than other elements in the present study also. This may be due to typical beach rock formation [Citation17]. It varied from 22.46 to 29.37% with an average of 26.95%. The lowest and highest value of this element was recorded in B5 and B3 respectively. Variation of calcium in the samples may be thought of as being controlled by clay minerals. The highest concentration of Ca in the samples may be due to the significant incorporation of clay sized CaCO3 material in sediments.
❖Potassium (K)
Potassium content in the beach rock samples of the study area varied from 0.31 to 0.34% with an average of 0.32%. The lowest and highest concentrations of this element were recorded for B1 and B5 respectively. As potassium first goes into the solution but does not remain dissolved, it is absorbed by the clay content. The difference in the behavior of sodium and potassium during the weathering is due to greater resistance of potash feldspar as compared to plagioclase feldspar [Citation46]. Presence of feldspar mineral in the study area has been confirmed by FT-IR and XRD techniques.
❖Iron (Fe)
Iron is one of the most common and abundant element in earth's crust. It is present in the environment as a result of natural as well as anthropogenic activity and has frequently been used as an indication of natural changes in the heavy metal carrying capacity of the sediments. The concentration of iron varied from 0.23 to 1.48% with an average of 0.69%. It registered the lowest and highest values for B1 and B5 respectively. This may be due to iron being incorporated within calcite during primary precipitation of calcite in reducing condition and the result of input and sedimentation rate of detrital mineral into the depositional environment [Citation47].
❖Titanium (Ti)
Titanium an abundant element in the earth's crust, is a common constituent of rocks, soils and sediments and is primarily found in the minerals rutile (TiO2), ilmenite (FeTiO3) and sphene (CaTiSiO5). This element has shown lower value compared to the crustal average value. The lower concentration of Ti in the present study may be attributed to decreasing oxidative precipitation or currents and turbulence at the confluence might have dispersed considerably the flocculated particles to the sea before settling as has been interpreted for Fe.
❖Silicon (Si)
Silicon content in the beach rock samples of the study area varied from 0.78 to 6.43% with an average of 2.98%. The lowest and highest concentrations of this element were recorded for B1 and B5 respectively. This element has lower value compared to the crustal average. This may be due to the typical beach rock formation.
❖Vanadium (V)
Vanadium is a ubiquitous element. Vanadium is emitted into the air, water and terrestrial ecosystem from a large number of diverse sources, which include waste effluents from vanadium metal industries, alumina plants, textile mills, iron and steel industries (which use vanadium as alloying material) and chemical industries.
From , it is seen that vanadium concentrations varied from 7.7 to 33.9 ppm with an average of 17.3 ppm. The lowest and the highest levels were recorded for B1 and B5 respectively. Vanadium content in the present study, when compared to crustal average, was found to be lower. The distribution of vanadium in marine sediments is largely controlled by the input and sedimentation of detrital mineral in which it is principally located in mineral lattice position [Citation48]. This may be one of the reasons for the vanadium variation in the beach rock samples.
❖Cobalt (Co)
Cobalt is one among the most widely, distributed heavy metals in terrestrial and aquatic environment. Cobalt content is found to be lower compared to crustal average values. The low concentration of this element may be attributed to its mobility, which is reduced in the carbonate dominant environment [Citation49].
❖Copper (Cu)
There are several sources of copper emission to the atmosphere. Natural sources like wind blown, dusts, vegetation exudates, volcanic emissions, sea salt sprays and result from anthropogenic sources including metal production wood and fossil fuel combustion and waste incineration. Copper content is found to be lowest and highest at B1 (1.8 ppm) and B5 (9.4 ppm) respectively. The concentration found in the present study is lower compared to crustal average.
❖Barium (Ba)
From the it is observed that Ba varies from 159.5 to 255.9 ppm with an average of 194 ppm. B1 and B5 recorded the lowest and highest concentration respectively. The concentration of Ba may be explained by the formation of sizable amount of barites (BaSO4) in the carbonates [Citation50].
❖Zinc (Zn)
Zinc is one of the most ubiquitous and mobile of heavy metals and is transported in natural water systems to a great extent in dissolved form. The mean value of zinc concentration in the present study is compared to the crustal abundance and is found to be lower. This may be due to the carbonate in the environment diluting the heavy metal concentration.
❖Lead (Pb)
To understand the fate and transport of anthropogenic lead, its geochemistry in terrestrial and marine environments must be considered. The Concentration of lead in the earth crust has been estimated at 13 ppm. The concentration of lead in the present study is more or less the same at 12.9 ppm.
❖Cadmium (Cd)
Cadmium is poorly concentrated in all the samples of beach rocks, the distribution ranging from 0.78 to 1 ppm. The low concentration of this element may be attributed to its mobility, which is reduced in the carbonate dominant environment.
❖Manganese (Mn)
Manganese is an essential micronutrient for plant and animals. Processing of iron ores in which, manganese is present in significant concentration constitute the major sources of manganese pollution.
In the present study, this element concentration (137.4 ppm) has found to be higher than crustal abundance (0.5 ppm). This is may be due to dissolution of carbonate causing the formation of manganese bicarbonate, which is stable, in aerobic environment at low pH. Another possible reason under oxic water condition is that Mn occurs as insoluble Mn(III) and Mn(IV) oxides, whereas in anoxic conditions it occurs as Mn(II) in the dissolved phase. During sub-oxic and anoxic condition Mn2+ diffuses upwards in the sediment column and Mn can precipitate in the form of Mn oxide/hydroxides at or near the freshwater–seawater interface.
The variation of the different trace elements in the present study may be due to the nature of weathering processes, and the velocity of transporting media. The total trace elements concentrations in sediments depend not only on the trace element input but also on the mineral composition of the sediment, which can be different from area to area. Another possible reason may be the difference attributed to the hydrothermal alteration and metasomatism processes, i.e. the area was subjected to surface and subsurface processes of alteration. This is the reason attributed for the variation of elemental concentration in beach rock samples.
3.4 Conclusion
Beach rock samples were collected from Andaman Island to study their cementing mineral and geochemical nature using spectroscopic techniques. The qualitative identification of the minerals in beach rock samples was carried out by using FT-IR and XRD techniques. The combined techniques reveal the presence of minerals such as quartz, orthoclase, albite, kaolinte and montmorlinte in the samples. The bulk mineralogy of beach rock samples from the IR and XRD studies reveals that calcite, aragonite and slightly lesser extent quartz are the dominant minerals. A similar mineralogical composition characterizes the beach rocks of other locality.
From the EDXRF analysis, the Biogenic element (Ca) showed high concentration compared to all other elements. This may be due to the typical beach rock formation. The variation of the different trace elements in the present study may be due to the nature of weathering processes, and the velocity of transporting media.
The advantages of the proposal of FT-IR, XRD and EDXRF approach with respect to the traditional one are tremendous and preparation (no acidic dissolution is necessary), experimental procedure, cleanliness and simplicity) and analysis time. The combined technique gives the information for the cementing minerals and elemental composition in the beach rocks and its formation.
Acknowledgment
The authors are highly indebted and grateful to Dr. C. Rajashekhar and Mr. Alok Athavale, Paleobiology Group, Agharkar Research Institute, Pune, India for their kind guidance, geological aspects and samples provided for analyzing beach rocks of Andaman Island, India for the present work. We recored of our special gratitude to Dr. K.K. Satapathy, Head, EnSD and Dr. M.V.R Prasad, Head, EOHS, EnSD, RSEG, Indira Gandhi Centre for Atomic Research (IGCAR), Kalpakkam, Tamilnadu, India in carrying out EDXRF analysis in their division.
Notes
Peer review under responsibility of Mansoura University.
References
- R.RavisankarE.ManikandanM.DheenathaylanDetermination and distribution of rare earth elements in beach rock samples using instrumental neutron activation analysis (INAA)Nucl Instr Meth B2512006496500
- R.J.RussellOrigin of beach rockZeit fur Geo61196216
- R.J.RussellBeach rockJ Trop Geo1719632427
- T.AlexanderssonMediterranean beach rock cementation: marine precipitation of Mg-calciteStanleyJ.DanielMediterranean sea: a natural sedimentation laboratory1972203223
- J.D.MillimanMarine carbonates1974Springer-VerlagBerlin375
- L.KathyBinkleyH.BruceB.H.WilkinsonR.M.OwenVadose beach rock cementation along a southeastern Michigan marl LakeJ Sed501980953961
- T.P.ScoffinD.R.StoddartBeach rock and intertidal sedimentsA.S.GoudieK.PyeChemical sediments and geomorphology1983Academic Press, IncLondon401425
- M.K.H.El-SayedBeach rock cementation in AlexandriaEgypt Mar Geo8019882935
- D.KnealeH.A.VilesBeach cement: incipient CaCo3 – cemented beach rock development in the intertidal zone North Uist ScotlandSed Geo1322000165170
- D.ReyB.RubioA.M.BarnabeuF.VilasFormation exposure and evaluation of a high latitude beach rock in the intertidel zone of the corrubedo complex(Ria de Arousa,Galicia, NW spain)Sed Geo169200493105
- S.DarrenD.A.RichardS.A.EugeneFormation of beach rock at siesta key Florida and its influence on barrier island developmentMar Geo20020031929
- K.OmotoIsotope fractionations and radio carbon ages of beach rock samples collected from the Nansei Islands, south west of JapanRad Env82006406418
- K.ReddiahT.E.SivaprakasamN.V.Subba RaoP.T.CherianK.R.HalderT.RoySouth Indian beach rockInd J Mari Sci3197436
- R.RavisankarM.DheenathayaluJ.DajkumarsahayamG.Victor RajamanickamV.Meenakshi sundaramV.GajendiranStudy of background radiation along the south east coast Tamil NaduRad Pro Env262003426430
- B.G.WagleBeach rocks of the Central West Coast of IndiaGeo Mar Lett1021990111115
- R.RavisankarA.RajalakshmiP.EswaranV.MeenakshisundramManikandanP.Magudapathyet alGamma ray spectroscopic and PIXE analysis of beach rock samples of south east coast of Tamil Nadu, IndiaIJPIXE172007193203
- R.RavisankarP.EswaranN.P.SeshaderssanM.Brahmaji RaoInstrumental neutron activation analysis of beach rock samples of south east coast of Tamilnadu, IndiaNucl Sci Tech1842007204211
- C.KarunakaranK.K.RaySahaTertiary sedimentation in Andaman-Nicobar geosynclineJ Geo Soc India919683239
- M.S.SrinivasanAndaman-Nicobar Islands: a future petroleum source for India Oil and coal news19681921
- AkMohantyS.K.DasV.VijayanSenguptaS.K.SahaGeochemical studies of monazite sands of chhatrapur beach placer deposit of Orissa, India by PIXE and EDXRF methodNucl Instru Meth B2112003145154
- F.L.MelquiadesC.R.AppoloniApplication of XRF and field portable for environmental analysisJ Rad Nucl Chem2622004533541,
- P.MahawatteK.R.DissanayakaR.HewamannaElemental concentration of some ayurvedic drugs using energy dispersive XRFJ Rad Nucl Chem2702006657660
- V.CojocaruD.I.StruminskaB.SkwarzecA.PantlicaE.PincovschiEDXRF versus INAA in a pollution control of soilJ Rad Nucl Chem26820067178
- D.GuptaJ.M.ChatterjeeR.GhoshA.MitraK.RoyM.SandSarkarEDXRF analysis of municipal solid waste using 109Cd sourceApp Rad Iso6552007512516
- J.LartigueT.MartinezP.Avila-PerezG.ZarazuaS.TejadaEDXRF analysis of some cigarette paperJ Rad Nucl Chem27332007759762
- T.AkyiizS.AkyiizA.BassariRadioistope excited X-ray flurescence analysis of ashes from coal fired power plants in TurkeyJ Rad Nucl Chem22720074348
- R.J.P.LyonInfrared absorption spectroscopyJ.ZussmanPhysical methods in determinative mineralogy1967Academic pressNew York371403
- ClarenceKarrJr.Infrared and Raman spectroscopy of lunar and terrestrial minerals101974Academic PressNewyork325358
- J.D.RussellM.J.WilsonInfrared methods a hand book of determinative methods in clay mineralogy851987Blackie and Son Ltd1167
- S.N.GhoshInfrared spectra of some selected minerals, rocks and productsJ Mat Sci13197818771886
- V.C.FarmerInfrared spectroscopy data hand book for clay materials and other nonmetallic mineralsVanOlphenFripit1979Pergaman PressOxford, London .285337
- R.RavisankarA.RajalakshmiE.ManikandanMineral characterization of soil simples in and around SALT field area, Kelambakkam, Tamil Nadu IndiaActa Cienc IndicaXXXIIP32006341346
- R.RavisankarG.SenthilkumarS.KirubaA.ChandrasekaranPrince PrakashJebakumarMineral analysis of coastal sediment samples of Tuna, Gujarat, IndiaInd J Sci Tech372010774780
- R.RavisankarP.EswaranG.SenthilkimarA.ChandrasekaranS.KirubaMineralogical characterization studies of ancient potteries of Tamil nadu, India by spectroscopic techniquesE-Journal Chem7S12010S185S190
- R.RavisankarS.KirubaA.ChandrasekaranG.SenthilkumarC.MaheswaranAnalysis of ancient potteries of Tamil nadu, India spectroscopic techniquesInd J Sci Tech382010858862
- R.RavisankarS.KirubaA.ChandrasekaranA.NaseeritheenM.SeranP.D.BalajiDetermination of firing temperature of some ancient potteries of Tamil nadu, India by FT-IR spectroscopic techniqueInd J Sci Tech39201010161019
- R.RavisankarApplication of spectroscopic techniques for identification of minerals from the beach rocks of Tamil nadu IndiaEARFAM192009272276
- V.C.FarmerThe IR spectra of minerals421974Minerological SocietyLondon308320
- J.L.WhiteInterpretation of infrared spectra of soil mineralsSoil Sci11219712231
- J.L.WhiteInterpretation of infrared spectra of soil mineralsSoil Sci11219712267
- S.A.FyshP.M.FredericksFourier transform infrared studies of aluminous goethites and hematitesClay Clay Miner3151983377382
- P.J.LaunerRegularities in the infrared absorption sperctra of silicate mineralsAm Min371952764784
- V.StubicanR.RoyIsomorphous substitution and infra red spectra of the layer lattice silicatesAm Min4619613251
- P.CambierInfrared study of goethite of varying crystallinity and particle size; I, interpretation of OH and lattice vibration frequenciesClay Min2121986191200
- N.P.WijayanadaD.S.CronanThe geochemistry and mineralogy of marine sediments from the eastern Indian oceanMar Geo1171994275285
- R.RavisankarUsing different analytical techniques to study beach rocks of Tamilnadu, IndiaNucl Sci Technol202009140145
- U.BrandBiogeochemistry of late palaeozic North American brachiopods and secular variations of sea water compositionBiogeochem71989159
- D.H.LoringGeo chemistry of cobalt, nickel, chromium, and vanadium in sediments of the estuary and open Gulf of St. LawrenceCan J Earth Sci16197911961209
- N.ShaidS.S.AhmedM.QadeeruddinS.KhaulaGeochemical stream sediment survey in winder valley, Balochistan, PakistanGeo Chem762002112
- N.EkinciR.EkinciR.PolatG.BudakAnalysis of trace elements in medicinal plants with energy dispersive X-ray flurescenceJ Rad Nucl Chem26012004127131