
 ?Mathematical formulae have been encoded as MathML and are displayed in this HTML version using MathJax in order to improve their display. Uncheck the box to turn MathJax off. This feature requires Javascript. Click on a formula to zoom.
Abstract
This research article reports the novel UV-vis spectroscopic studies on as-synthesized conducting polyindole (PIn) through chemical polymerization route at room temperature using anhydrous ferric chloride as an oxidant. The complex optical properties of derived samples were studied by using UV-vis spectroscopy. The as-synthesized polymeric samples exhibited absorption around 220–300 nm. The optical band gap was found to ranges over 4.630–5.224 eV. The maximum optical conductivity for 0.6 M FeCl3 was found to be 7.93 × 10⁸ S−1 at 275 nm. The estimated optical band gap accomplished that this material has potential applications in optical devices.
1 Introduction
Now days, in the development of new efficient and enhanced materials, there was rising research focus towards the synthesis of conducting polymers like polyaniline (PANi), polypyrrole (PPy) and polythiopene (PTh) due to their high electrical conductivity, interesting electrochemical properties, and easy processability [Citation1–Citation[2]Citation3]. These electrical and electrochemical properties of such conducting polymers show much assurance for commercial applications in battery materials [Citation4], electrochromic devices [Citation5], sensor technology [Citation6], and nonlinear optics [Citation7]. However, among various aromatic-compound-based conducting polymers, polyindole (PIn) has received excellent research interest due to its close structural similarities with the polymers mentioned above [Citation8–Citation[9]Citation10]. PIn is electroactive polymer, which can be derived either by chemical oxidation or by electrochemically oxidation of monomer using FeCl3 or CuCl2 as an oxidant [Citation11]. PIn shows good thermal stability, high-redox activity and stability, and slow degradation rate in comparison with PANi and PPy [-Citation12 Citation13 Citation14 ].
The available literature reported that, PIn has been derived chemically by oxidation of indole using a supramolecular assembly of chloroauric acid as an oxidant [Citation15]. The formation of nanorods and microspheres of PIn conducting polymer based on chemical synthesis using two miscible and two immiscible solvents respectively without surfactant and supported by UV-vis spectrum [Citation16]. Joshi et al. focused on indole polymerization governed by chloro-auric acid also reduction of Au3+ ions occurred simultaneously in a single step, was monitored using UV-vis absorption spectroscopy [Citation17]. There are various techniques of polymerization, but chemical polymerization is easier than other techniques. The synthesis of conducting polymers through chemical oxidative polymerization route offers mass production at sensible cost.
This research article is intended by presenting a more systematic report on the novel complex optical study of as-synthesized PIn through chemical route using oxidant FeCl3 at room temperature. From the literature of materials science, not a single report present on the complex optical study of PIn synthesized using an oxidant FeCl3. The as-synthesized materials were characterized through X-ray diffraction (XRD), field emission scanning electron microscope (FE-SEM) analysis, and ultra violet-visible (UV-vis) spectroscopy.
2 Experimental
2.1 Materials
All chemicals, such as monomer indole, oxidant anhydrous iron (III) chloride (FeCl3), hydrogen peroxide (H2O2) used as catalyst, were of analytical grade and procured from SD Fine Chemicals, India. The indole monomer was used as received for synthesis of PIn without further purification. The polymeric materials were prepared via chemical oxidative technique using FeCl3 as an oxidant. In the typical procedure, monomer and oxidant in stiochometric ratio were dissolved in deionized water. Consequently, H2O2 (0.1 M) was added into the reaction mixture, which wont to enhance the rate of reaction and conjointly yield. The reaction mixture was allowed for constant stirring for 12 h to complete polymerization reaction with a magnetic stirrer at 30 °C. The precipitate was washed with copious amounts of triply distilled water until the washings were clear and then kept for overnight at room temperature. Subsequent to this step, sample was sintered at 60 °C for 30 min. By adopting same route, successful synthesis of five samples of different wt. % was carried out.
3 Results and discussion
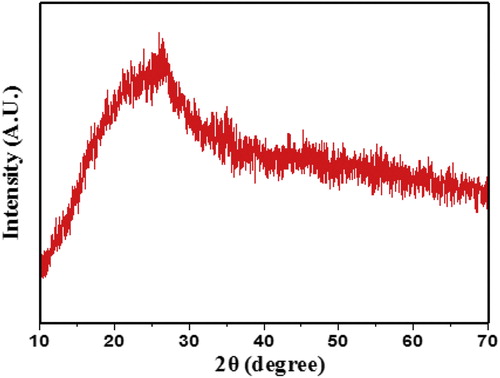
The XRD pattern of powder sample was recorded on Rigaku miniflex-II X-ray diffraction using CuKα radiation (λ = 1.54 Å) in the range 10°–70°. The XRD pattern for PIn powder sample with 0.6 M of FeCl3 is depicted in Fig. 1. The pattern shows the broad hump appears at 2θ region of 18–28° and absence of well-defined peaks clearly pointed out that the as-synthesized material is purely amorphous.
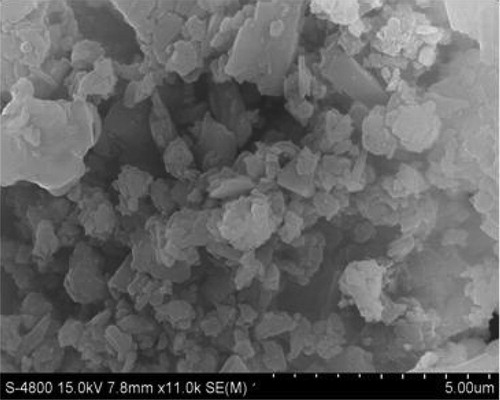
The morphology and structural features of the material studied by FE-SEM (JEOL JSM-6360). The surface morphology of PIn powder sample with 0.6 M of FeCl3 was analyzed by FE-SEM and the micrograph is displayed in Fig. 2. The FE-SEM micrograph represents the macro-granular structure formed by the aggregation of small globular structures. The nature of particles has irregular in structure which reflects definite amorphous morphology. The micrograph depicts the presence of aggregation up to some extent as well as an agglomeration of particles.
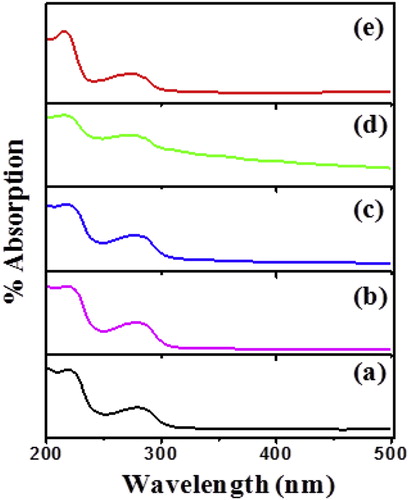
In order to study the complex optical properties of as-synthesized PIn materials, the UV-vis spectroscopic analysis were carried out through Agilent Technologies, Cary 60 UV-vis. Fig. 3 shows UV-vis spectrum of PIn with different concentration of FeCl3. To investigate the optical parameters of as-synthesized material, the analysis of the spectrum was carried out. From the plot, it is observed that, the % absorption is higher on the lower wavelength side. The spectrum of as-synthesized material exhibits absorption around the 220–300 nm. The two different absorption peaks, at 225 nm and 280 nm grew due to wide chain length distribution of polymer [Citation18].
The optical band gap of PIn (0.3–0.7 M of FeCl3) was calculated by using the plot between αhν and photon energy hν (eV) as depicted in Fig. 4 (a–e). The material has many applications depend upon its optical band gap. The relation between absorption coefficient (α) and incident photon energy (hν) can be expressed as in Equation Equation(1)(1)
(1) [Citation19–Citation[20]Citation21];
(1)
(1) where, A is constant and Eg is optical band gap of material.
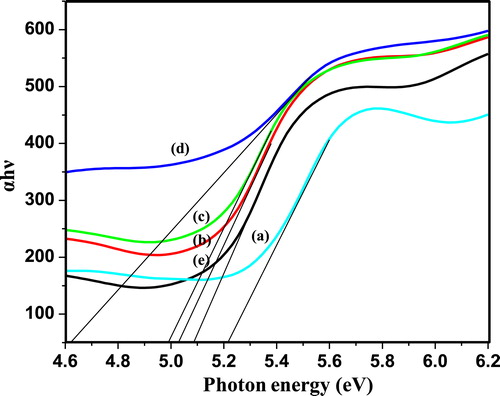
The values of the optical band gap of PIn with different concentration of FeCl3 have been determined in the energy range 4.630–5.224 eV. The optical band gap energy values obviously concluded that, this material has potential application in optoelectronics devices. Fig. 4 clearly represents that, PIn with 0.6 M of FeCl3 oxidant has least optical band gap energy value, which was found to be 4.630 eV, which has been evaluated by extrapolation of a linear plot of the graph. It is also observed that, the optical band gap energy values decreases with increase in concentration of oxidant up to 0.6 M of FeCl3, thereafter increases with further increase in concentration of oxidant.
Fig. 5 (a–e) represents the extinction coefficient as a function of photon energy for PIn (0.3–0.7 M of FeCl3). The extinction coefficient indicates the amount of absorption loss when electromagnetic wave propagates through a material, which is a measure of fraction of light lost owing to scattering and absorption per unit distance of penetration medium. The extinction coefficient is directly related to the absorption of material and is related to the absorption coefficient. Extinction coefficient has been estimated by the relation Equation(2)(2)
(2) [Citation22];
(2)
(2) where, K is extinction coefficient, α is % absorption coefficient and λ is wavelength. It can be seen from Fig. 5 that, up to 5.1 eV, extinction coefficient decays exponentially and remains almost constant with humps at 4.5 eV. Beyond 5.1 eV, extinction coefficient shows a steep rise. As shown in Fig. 5, the exponentially decrease in extinction coefficient with an increase in photon energy represents that, the fraction of light lost owing to scattering and absorbance sincreases. Also, the loss factor decreases with increase in photon energy.
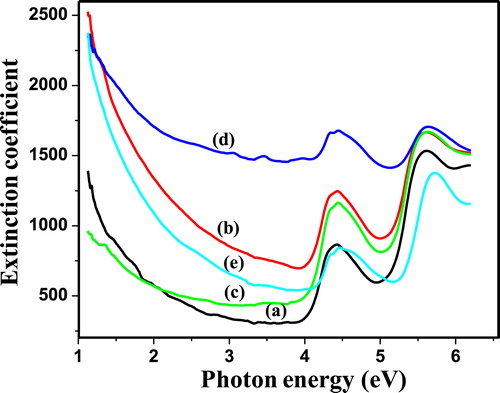
Fig. 6(a–e) shows, the plot of refractive index (n) as a function of wavelength (λ) for PIn samples with different (0.3–0.7 M) concentration of FeCl3. The refractive index (n) has been computed using relation Equation(3)(3)
(3) [Citation23];
(3)
(3) where, n is refractive index and Ts is % transmission coefficient.
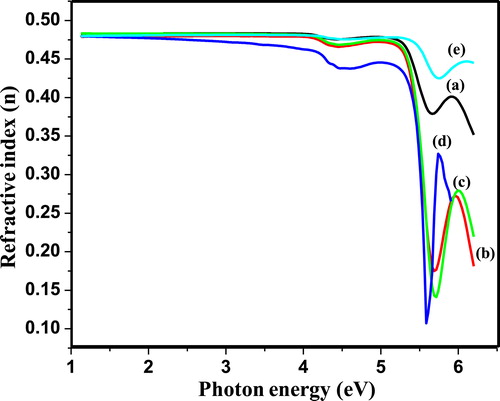
It can be observed that, the refractive index of as-synthesized material decreases with increase in photon energy; it reflects that, the synthesized polymeric samples represent normal dispersion behaviour. The variation in n values with photon energy shows the interaction takes place between photon and electrons. Thus, we can attain the desired material for fabricating the optoelectronics devices by estimating the photon energy as internal energy of device depends on the photon energy. The decrease in extinction coefficient and refractive index with increase in photon energy may be correlated with an increase in absorption coefficient and decrease in the transmittance.
The complex dielectric constant is the basic intrinsic property of materials. The real part of the dielectric constant represents how much it will slow down the velocity of light in the material. Whereas, the imaginary part of dielectric constant indicates how a dielectric material absorbs energy from an electric field owing to dipole motion. Fig. 7 (a–e) shows the real dielectric constant (εr) as a function of photon energy, while Fig. 8 (a–e) displays the imaginary dielectric constant (εi) as a function of photon energy of as-synthesized PIn (0.3–0.7 M of FeCl3) samples. The real and imaginary parts of the dielectric constant evaluated through the relations [Citation24];(4)
(4)
(5)
(5)
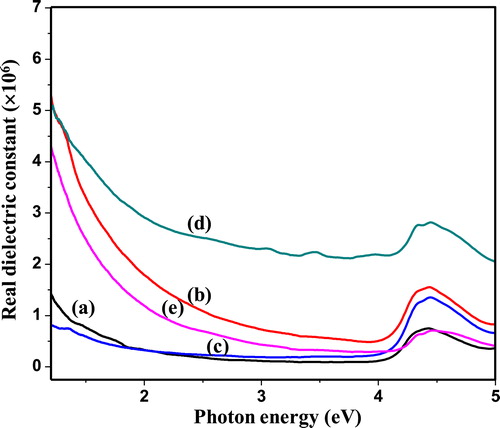
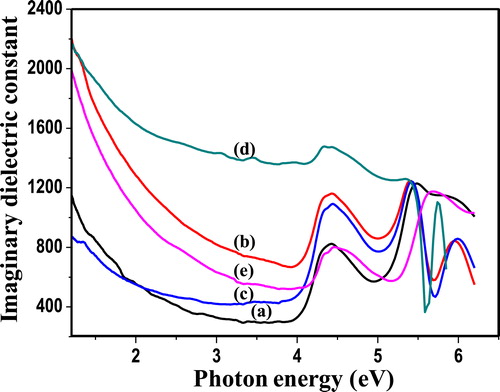
where, εr is real part of dielectric constant, n is refractive index, εi is imaginary part of dielectric constant and k is extinction coefficient. The figures, 7 and 8 reveals that real and imaginary part of dielectric constant decreases with increase in photon energy. The data of real and imaginary part of dielectric constant provide knowledge concerning the loss factor which is the ratio of imaginary to real dielectric constant. These results indicate that in synthesized material loss factor increases with decrease in photon energy. The real part of the dielectric constant decreases a little-bit rapidly with increase in photon energy in higher region but in lower region it decreases gradually. However, the imaginary part of the dielectric constant decreases gradually with increase in photon energy.
The optical response of material is generally calculated in terms of optical conductivity (σ) can be estimated through relation Equation(6)(6)
(6) [Citation25];
(6)
(6) where, α is absorption coefficient, n is refractive index and c is velocity of light. Fig. 9 (a–e) represents the plot of optical conductivity versus wavelength for PIn (0.3–0.7 M of FeCl3). From the figure, it can be observed that optical conductivity directly depends upon an absorption coefficient and refractive index of as-snthesized PIn with different concentration of FeCl3. It can be noticed that optical conductivity increases rapidly over the range 260–290 nm.
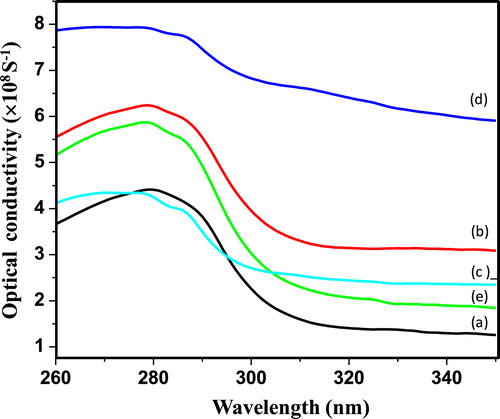
From Fig. 9, it is clearly observed that, optical conductivity increases with increase in concentration of oxidant up to 0.6 M of oxidant. Further, increase in concentration of oxidant results in decrease of the optical conductivity. The values of optical conductivity for all samples are calculated in the range 4.25–7.89 × 10⁸ S−1 at 280 nm. The optical conductivity was found to be gradually increases after 260 nm, correlated with gradual increase in absorption coefficient for all samples. The optimum value of optical conductivity for PIn with 0.6 M of FeCl3 at 275 nm is found to be 7.93 × 10⁸ S−1 ().
Table 1 Values of optical band gap (Eg) and optical conductivity (σ) for PIn with 0.3–0.7 M of FeCl3.
4 Conclusions
In the summary of present work, we successfully made attempt to discuss the complex optical properties of as-synthesized PIn samples with different concentration of FeCl3 as an oxidant through chemical polymerization method at room temperature. The amorphous nature of as-synthesized material confirmed through XRD as well as FE-SEM analysis. The absorption spectrum of as-synthesized PIn samples has been analyzed ranges over 200–500 nm for the determination of optical parameters. These as-synthesized polymeric samples show absorption around the 220–300 nm. The least optical energy band gap was found to be 4.6302 eV, which corresponds to PIn with 0.6 M of FeCl3. With the help of UV-vis study, we have represented the optical constant i.e. extinction coefficient, refractive index, real dielectric constant, and imaginary dielectric constant. The optical conductivity increases with increase in wavelength and this can be attributed to increase in absorption. The as-synthesized PIn material with 0.6 M of FeCl3 has maximum optical conductivity value, which was found to be 7.93 × 10⁸ S−1 at 275 nm. The critical analysis of results shows that all complex optical parameters vary with the concentration of oxidant. The estimated optical band gap energy has accepted value for photovoltaic activities and has potential for application in solar cells and optical devices.
Acknowledgements
Authors are very much thankful to Head, Department of Physics Sant Gadge Baba Amravati University, Amravati for providing the necessary facilities.
Notes
Peer review under responsibility of Mansoura University.
References:
- J.StejskalP.BoberM.TrchovaJ.HorskyJ.PilarZ.WalterovaThe oxidation of aniline with p-benzoquinone and its impact on the preparation of the conducting polymer, polyanilineSynth Met19220146673
- J.K.XuG.Q.ShiL.T.QuJ.X.ZhangElectrosyntheses of high quality polypyrrole films in isopropyl alcohol solution of boron trifluoride diethyl etherateSynth Met1352003221222
- S.S.JeonS.J.YangK.J.LeeS.S.ImA facile and rapid synthesis of unsubstituted polythiophene with high electrical conductivity using binary organic solventsPolym51201040694076
- N.MermilliodJ.TanguyF.PetiotA study of chemically synthesized polypyrrole as electrode material for battery applicationsJ Electrochem Soc133198610731079
- A.G.MacDiarmidA.J.EpsteinApplication of thin films of polyaniline and polypyrrole in novel light-emitting devicesACS Symp Ser6721997395415
- H.G.XueS.L.MuBioelectrochemical response of the polypyrrole xanthine-oxidase electrodeJ Electroanal Chem3971995241247
- H.LindenbergerD.SchafersiebertS.RothM.HanackSynthesis and properties of polypyrrole prepared by electrochemical polymerization of α-bipyrroleSynth Met1819873741
- D.SazouThe dynamical behavior of the electrochemical polymerization of indole on Fe in acetonitrile-water mixturesSynth Met13020024554
- A.A.IsmailS.H.SanadA.A.El-MeligiInhibiting effect of indole and some of its derivatives on corrosion of C-steel in HClJ Mat Sci Technol162000397400
- M.DudukcuB.YaziciM.ErbilThe effect of indole on the corrosion behaviour of stainless steelMat Chem Phys1302004138141
- J.XuJ.HouS.ZhangR.ZhangG.NieS.PuElectrosyntheses of high quality poly(5-methylindole) films in mixed electrolytes of boron trifluoride diethyl etherate and diethyl etherEur Polym J42200613841395
- P.C.PandeyR.PrakashCharacterization of electropolymerized polyindole-application in the construction of a solid-state, ion-selective electrodeJ Electrochem Soc145199841034107
- D.BillaudE.B.MaaroufE.HannecartChemical oxidation and polymerization of indoleSynth Met691995571572
- P.S.AbthagirK.DhanalakshmiR.SaraswathiThermal studies on polyindole and polycarbazoleSynth Met93199817
- A.KumarR.PrakashSynthesis of nano ground nutshell-like polyindole by supramolecular assembled salts of ss-DNA assisted chloroauric acidChem Phys Lett51120117781
- B.GuptaD.S.ChauhanR.PrakashControlled morphology of conducting polymers: formation of nanorods and microspheres of polyindoleMat Chem Phys1202010625630
- L.JoshiR.PrakashPolyindole-Au nanocomposite produced at the liquid/liquid interfaceMat Let662012250253
- L.JoshiR.PrakashOne-pot synthesis of polyindole-Au nanocomposite and its nanoscale electrical propertiesMat Let65201130163019
- K.R.NemadeS.A.WaghuleyUV-VIS spectroscopic study of one pot synthesized strontium oxide quantum dotsResults Phys320135254
- B.UmaK.S.MurugesanS.KrishnanS.J.DasB.M.BoazOptical and dielectric studies on organic nonlinear optical 2-furoic acid single crystalsOptik124201327542757
- K.ForoutaniB.PourabbasM.SharifM.FallahianS.KhademiM.MohammadizadehIn situ deposition of polythiophene nanoparticles on flexible transparent films: effect of the process conditionsMat Sci Semi Process1920145761
- J.DalalN.SinhaB.KumarStructural, optical and dielectric studies of novel non-linear bisglycine lithium nitrate piezoelectric single crystalOpt Mat372014457463
- F.A.JenkinsH.E.WhiteFundamentals of optics1957McGraw-HillNew York
- A.GoswamiThin film fundamentals1996New Age IntNew Delhi
- P.SharmaS.C.KatyalDetermination of optical parameters of α-(As2Se3)90 Ge10 thin filmJ Phys D Appl Phys40200721152120