
 ?Mathematical formulae have been encoded as MathML and are displayed in this HTML version using MathJax in order to improve their display. Uncheck the box to turn MathJax off. This feature requires Javascript. Click on a formula to zoom.
Abstract
The automatic variable wavelength interferometry, VAWI, technique is used to determine the optical properties of Poly(ether ether ketone), PEEK, highly oriented fiber. The main part of this technique is the Pluta polarizing interference microscope attached with the automatic moving interference filter via stepper motor. The VAWI technique depends on measuring the optical path length differences at certain positions in microinterferogram. These positions are the coincidence and anti-coincidence of the fiber fringe with the free medium fringes. The measured refractive indices and birefringence values are utilized to calculate some optical constants of PEEK fiber using Cauchy and Sellmeier's equations. Also using some structure relationship, some molecular structure and orientation parameters of PEEK fiber as a function of the wavelength of the incident light are calculated. The method allows us to determine any molecular structure parameters of PEEK fiber at any wavelength in the visible spectrum. Microinterfrograms are given for illustration.
1 Introduction
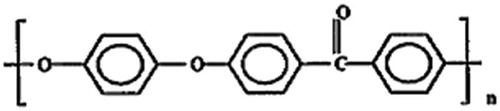
Poly(ether ether ketone), (PEEK) fiber is a semi-crystalline engineering polymer material; its scientific name is poly(oxy-1,4-phenyene-oxy-1, 4-phenyene). The melting and glass transition temperatures are (Tm = 340 °C, Tg = 143 °C) [Citation1]. The excellent mechanical properties of PEEK make it attractive for use as a matrix material for high performance engineering thermoplastic. PEEK fiber has a remarkable applications in many advanced industries, such as opto-electronics and aerospace systems, because of its chemical stability and high mechanical strength [Citation2,Citation3]. In the melting state, PEEK is amorphous, it has its crystalline structure during the solidification process. The percentage of the crystalline and amorphous regions depends on the conditions of the solidification process. Thermal and crystallization behavior, processing, morphology, mechanical and structural properties of PEEK fiber were studied [Citation3–Citation[4]Citation[5]Citation[6]Citation[7]Citation8]. The chemical structure of PEEK fiber is:
The specific optical and dispersion properties give detailed information about the structure behavior of the fiber material. The refractive effects are a key information of molecular orientation, crystalline and amorphous regions, and other structural properties of the synthetic fibers [Citation9]. Also, the methods for characterizing its optical, mechanical and structural parameters relationship are of considerable interest. Voice et al. [Citation5] and Cakmak [Citation10] studied the molecular orientation in uniaxially drawn PEEK from the X-ray, refractive index and intrinsic birefringence measurements.
Interferometric measurement techniques have been recognized as a precise tool for studying the fibrous materials [Citation11,Citation12]. The VAWI-technique [Citation11] is specially recommended for studying highly and partially oriented polymer fibers. The spectral dispersion properties and refractive index profile of some highly oriented fibers have been studied [Citation13–Citation[14]Citation[15]Citation16] using VAWI technique.
In this article, the VAWI-technique is used for studying Poly(ether ether ketone), PEEK, highly oriented fiber. The optical properties of PEEK fibers are measured. The obtained results are utilized to calculate some molecular structure parameters of the PEEK fiber such as the high frequency refractive index n∞, the average oscillator wavelength λo and the oscillator length strength So, polarizability per unit volume, density, the mass fraction of crystalline and amorphous regions, the optical stress coefficient, and molecular orientation behavior of PEEK fibers.
2 Theoretical considerations
2.1 Optical and dispersion properties
The refractive index and birefringence are considered as keys for determining the optical properties of the fiber material. Variable wavelength microinterferometry [Citation11], VAWI, depends on measuring the optical path length difference, between the fiber material and its surrounding medium, at different positions called coincidence position. The optical path length differs, , when the incident light vibrates parallel to the fiber axis can be measured by using the following equation [Citation11]:
(1)
(1)
The subscript s refers to the coincidence and/or anti-coincidence number, qs is the increase in the initial interference order m1 and t is the thickness of the fiber. When the light vector vibrates perpendicular to the fiber axis, a similar formula is expressed. The above equation can be used to determine the spectral dispersion curves of the refractive indices n|| and n⊥. The birefringence Δn is given by the following equation [Citation11]:(2)
(2)
Using the values of the refractive indices n|| and n⊥, the isotropic refractive index, nios, can be calculated using the following equation [Citation17]:(3)
(3)
The relation between the refractive index of the fiber material and the wavelength of monochromatic light used can be investigated from the well known Cauchy's dispersion relation [Citation18]:(4)
(4) where n(λ) is the refractive index at a given wavelength λ, A and B are Cauchy's constants. The values of these constants depend on the molecular structure behavior of the material.
Another dispersion relation is between the transmitted photon energy E and the refractive index n of the fiber material. For a single oscillator, this relation is described by a Sellmeier's equation as follows [Citation19]:(5)
(5) where Eo is the average excitation energy for the electronic transition or oscillation energy and Ed is the dispersion energy. The above equation can be calculated for the different polarization states of the light vector. The resulting data can be analyzed to determine the long wavelength refractive index n∞, the oscillator length strength So and the average oscillator wave length λo of the fiber material by using the single term Sellmeier's oscillator [Citation20].
(6)
(6) where
. By substituting in equation Equation(6)
(6)
(6) , one can write:
(7)
(7)
The values of the long wavelength refractive index n∞, the oscillator length strength So and the average oscillator wave length λo throw light on the optical transitions of the electron in the energy gab of the fiber material.
2.2 Structure relationship and molecular orientation parameters
The optical properties such as the refractive indices n||, n⊥, and niso, and the birefringence Δn of the fiber material throw light on the structure of fiber material at the molecular level. These optical parameters are related to some physical structure parameters by some structure relationship. The polarizabilities Φ can be calculated by application the following Lorentz–Lorenz equation [Citation17]:(8)
(8)
This relation can be used, when the light vector parallel and perpendicular to the fiber axis, for determining the polarizabilities Φ||, Φ⊥ and Φiso. The average density of the fiber material can be calculated using the derived values of the refractive indices using the following formula [Citation21]:(9)
(9) where ρa is the density of amorphous regions of the fiber, ρa = 1.264 gcm−3 [Citation5] for PEEK fiber material and
is the average refractive index which can be calculated using the following equation:
(10)
(10)
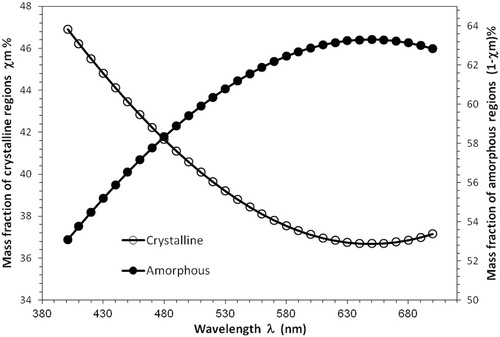
The mass fraction crystallinity of semi-crystalline polymers depends on their densities. The amorphous regions are denser than fully crystalline regions in the fiber material. Therefore the data of the density can be used to calculate the mass fraction crystallinity χm using the following equation [Citation21]:(11)
(11) where ρc and ρa in equation Equation(11)
(11)
(11) refer to the densities of the crystalline and amorphous regions, respectively, and ρc = 1.311 g/cm3 for PEEK fibers [Citation5]. There is a linear relationship between the crystalline and amorphous regions. So the mass fraction of amorphous is given by the following relation:
(12)
(12)
The mean square density fluctuation can be calculated, using the densities values ρa and ρc, by the following relation [Citation22]:(13)
(13)
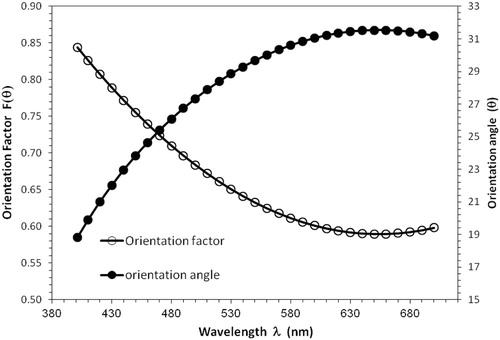
The molecular orientation can be calculated by using the values of the measured refractive indices n|| and n⊥. The Hermans orientation factor fΔ(θ) is then related to the refractive indices by the relation [Citation23,Citation24]:(14)
(14) where Δo is the intrinsic birefringence which is measured when all the molecules are perfectly aligned. This value for PEEK fiber was previously measured and equals 0.302 [Citation5]. The optical orientation angle θ relates to the Hermans optical orientation factor by the following equation [Citation23,Citation24]:
(15)
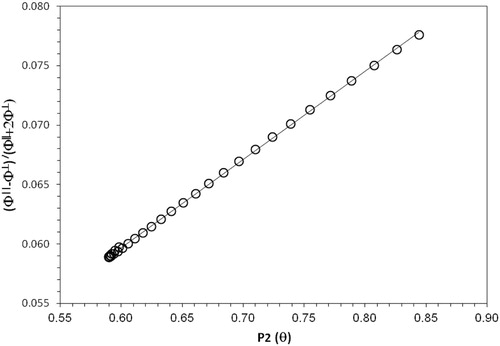
(15) where θ defines the angle between the polymer chain and the fiber axis. Cunningham et al. [Citation25] derived the relation between the optical orientation factor and the polarizabilities Φ|| and Φ⊥ per unit volume by the relation:
(16)
(16)
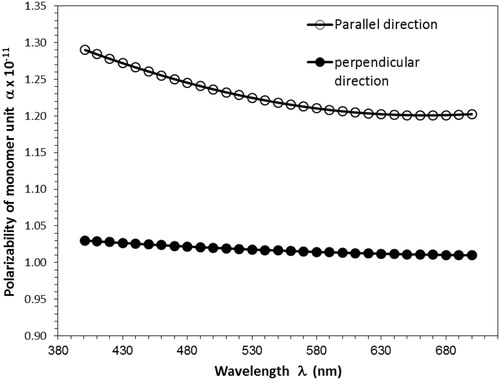
The quantity [Δα/3αo] is a structure constant that depends on the molecular orientation factor called the electric polarizability constant. The refractive indices n|| and n⊥ of a polymer depend on the total polarizabilities of the molecules α|| and α⊥ along and across such monomer unit, respectively. This leads to the Lorentz–Lorenz equations given by [Citation22]:(17)
(17) where α is caused by the deformation of the electron clouds in and between the molecules of the dielectric under the influence of the effective field. An analogous formula can be used for the perpendicular direction of the light vector for determining α⊥, where ψ is the permittivity of the free space = 8.85 × 10⁻¹² Fm−1, NA is the Avogadro's number = 6.022 × 10²³mol−1, M is the monomer unit molecular weight, M for PEEK fiber = 1153.1 gmol−1 [Citation5], and ρ is the bulk polymer density.
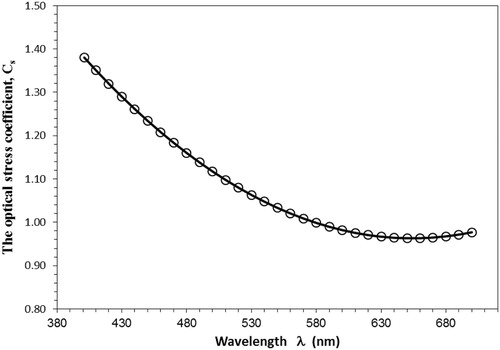
The optical stress coefficient, Cstress, is dependent on the chemical structure of the polymer. The value of this coefficient depends solely on the mean refractive index and the optical anisotropy of the random link as shown in the following equation:(18)
(18) where K is the Boltzmann's constant and T is the absolute temperature. The difference between the polarizabilities along and across the axis of such monomer unit, Δα = α|| − α⊥, is called the optical configuration parameter.
3 Experimental results and discussions
The variable wavelength interferometeric, VAWI, technique [Citation26] was used with its image analysis software program to measure the optical properties of PEEK fibers. This technique was adjusted in the subtractive position [Citation26] for measuring the diameter of PEEK fiber. The diameter is found to be 22.4 µm.
For measuring the refractive index, the microscope was arranged for obtaining duplicated images of PEEK fiber, one when the light vector vibrates parallel to the fiber axis and the other when the light vector vibrates in the perpendicular direction. The software program was adjusted for measuring the fiber refractive indices. All the measurements were done at a room temperature of 25 °C. Fig. 1(a, b) shows a microinterferogram of duplicated images of PEEK fiber. The upper image of the fiber is for measuring the refractive index n|| when light vibrates parallel to the fiber axis. The lower image is for measuring the refractive index n⊥ when light vibrates perpendicular to the fiber axis. The microscope was rearranged in the position for obtaining a single image of PEEK fiber. Fig. 1(c) shows a microinterferogram of PEEK fiber for measuring the fiber birefringence.
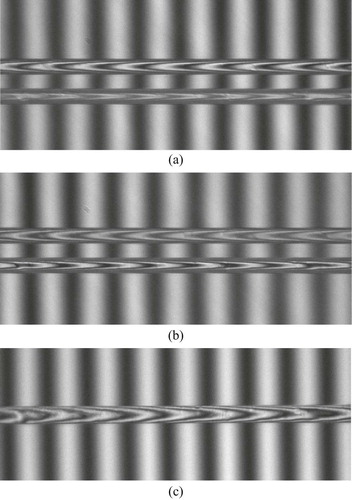
Fig. 2 shows a normal dispersion behavior of refractive indices n||, n⊥ and niso, and birefringence Δn of PEEK highly oriented fiber over the visible range of spectrum. It is clear that the PEEK fiber material has normal dispersion behavior. Toconfirm this normal behavior, the Cauchy's dispersion formula was used for PEEK fiber. To verify this equation, a relation between the refractive indices n|| and n⊥, and 1/λ2 was plotted. Fig. 3 gives the graphical representation of this relationship which takes a linear behavior. The constants A and B of Cauchy's dispersion formula were determined. The results are given in . The values of A and B throw light on internal structure of PEEK fiber. It is clear that the structure properties, on the molecular level, in the parallel direction are higher than the perpendicular direction. The accuracy in measuring the optical path length difference is about 0.05λ which leads to an accuracy in measuring the refractive index of 0.003 as given in Ref. [Citation27].
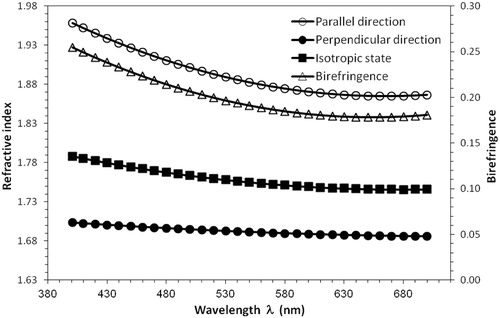
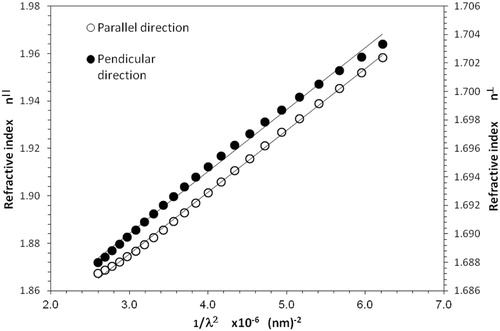
Table 1 The optical and dispersion parameters of PEEK fiber using automatic VAWI technique.
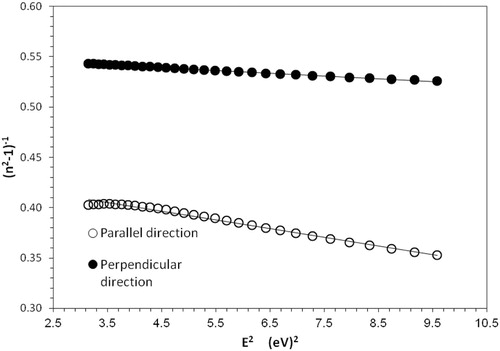
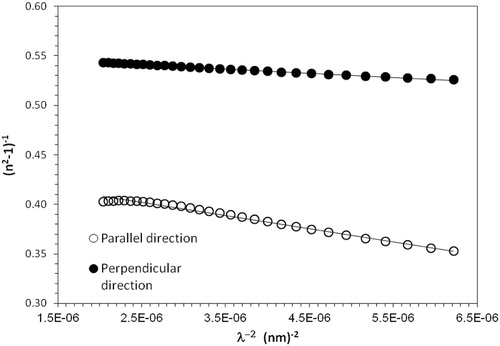
The interaction of electromagnetic light wave with PEEK fiber material was interpreted by the refraction effects. These effects manifest through the frequency dependence on the refractive index. Also, they related to the oscillation and dispersion of the bounded electrons of the PEEK fiber material. The oscillation and dispersion energies Eo and Ed can be determined by plotting a relation between (n2 − 1)−1 and the square of the photon energy E2. Fig. 4 shows the linear relationships from which the oscillation and dispersion energies Eo and Ed were obtained. The dispersion properly normalizes the interaction potential describing the optical effects that are due to the relationship between electronic optical properties of the PEEK fiber material and its chemical bond [Citation19]. The measured refractive indices can be analyzed to determine the high frequency refractive index n∞ and the average oscillator wavelength λo by plotting a linear relation between (n2 − 1)−1 verses λ−2 as shown in Fig. 5. Using equations Equation6(6)
(6) and Equation7
(7)
(7) and the slopes and intersect parts of the linear relation in Fig. 5, the high frequency refractive index n∞, the average oscillator wavelength λo and the oscillator length strength So of PEEK fiber are calculated and the results are given in .
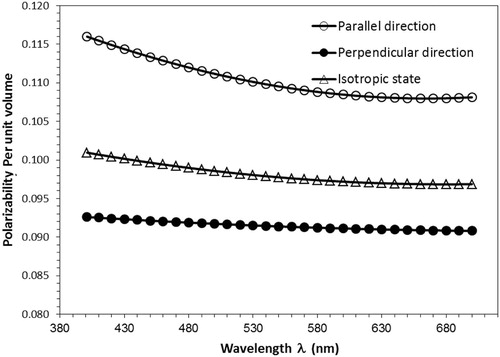
According to Lorentz–Lorenz equation, there is a direct relationship between the refractive index and the polarizability per unit volume. Fig. 6 shows the dispersion curves of the polarizability per unit volume Φ||, Φ⊥ and Φiso when the incident light beam in the visible range of spectrum.
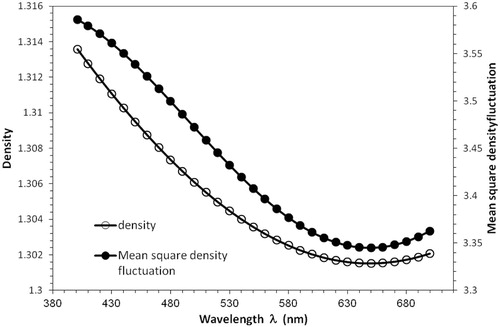
The density of PEEK fibers is directly related to its refractive index by equation Equation(9)(9)
(9) . So that the density varies with the variation of the wavelength of the incident light as shown in Fig. 7. The decrease in the density of PEEK fiber material with increasing the wavelength gives evidence on the inter-chain interaction. It is reasonable that the density changes are similar to the dispersion curves of the refractive index of PEEK fiber.
PEEK fibers are semi crystalline polymer material. The degree of crystallinity can be calculated using the density values at different wavelengths in the visible spectrum. The variation of the degree crystallinity is due to the variation of the wavelengths values. Using equations Equation(11)(11)
(11) , Equation(12)
(12)
(12) and Equation(13)
(13)
(13) , the mass fraction of the crystalline regions χm% percentage, the mass fraction of the amorphous regions (1 − χm)% percentage, and the mean square density fluctuation
were calculated at different wavelengths in the visible range of spectrum. Fig. 8 gives the graphical representation of the mass fraction of the crystalline χm% and amorphous (1 − χm)% regions percentages with different wavelengths in the visible range of spectrum. It is clear that the percentage of crystalline regions χm% decreases with increasing the wavelength from 400 nm to 700 nm while the percentage of amorphous regions (1 − χm)% is increased. The decrease and the increase of the percentage of the crystalline and amorphous regions when using light have wavelengths varying from 400 nm to 700 nm and are due to the refraction effects which depend mainly on the wavelength of light. The relationships of the mass fraction of the crystalline and amorphous regions and refractive index are qualitative relations because these structure parameters are intrinsic properties of the fiber material. The advantage of these measurements is that they give information at any wavelength all over the visible range of spectrum. The variation of the mean square density fluctuation
is presented in Fig. 7.
The optical orientation factor and angles depend on the optical anisotropy of the fiber material, which is the birefringence. Fig. 9 shows the behavior of optical orientation factor and angle with increase in the wavelength. It is clear that the optical orientation factor decreased and the orientation angle increased with increasing wavelength. Also, there is a relation between the optical orientation factor and the electric polarizabilities α|| and α⊥ of monomer unit of PEEK fibers. Fig. 10 gives a linear relationship between the optical orientation factor P2(θ) and the value of [Φ|| − Φ⊥]/[ [Φ|| +2 Φ⊥]. The slope of this linear relation gives the constant [Δα/3αo] to be 0.0742. The value of the electric polarizability constant depends on the molecular of PEEK fiber. The optical configuration parameter Δα is the difference between α|| and α⊥. Fig. 11 shows the variation of the electric polarizability of monomer units α|| and α⊥ with the wavelength of the incident light vibrating parallel and perpendicular to the fiber axis. Fig. 12 describes the relationship between the optical stress coefficient Cs and the wavelength λ. It is clear that the value of Cs decreased with increasing the wavelength taking the same behavior of the mean refractive index. The interpretation of the changes of Cs with the wavelength of the photon energy throws light on the electrical properties arising from existing space changes in the PEEK fibers after production. It is important to note that Cs depends only on the mean refractive index and optical anisotropy of random link and independent of the degree of cross-linking of the network.
The variation of the optical properties and molecular structure of PEEK fiber material is due to the frequency dependence on its refractive index. The interaction of the photon energy with fiber material leads to the refraction effects which forced the cloud electrons of wavelength λo to vibrate by an oscillatory electric field of wavelength λ. The relation between the refractive index and these molecular structure parameters is a quantitative relation because these parameters are intrinsic properties of PEEK fiber material at a certain wavelength.
4 Conclusions
The transmitted VAWI technique is suitable for determining the optical properties of PEEK fiber on the molecular level. Thismethod enables us to determine that the molecular structure parameters at any wavelength lies in the range of the visible spectrum. The variations of these structure parameters with the wavelength are due to the variations of the transmitted light refraction effects.
From the measurements carried out, the following conclusions may be drawn:
| 1. | PEEK fiber, which has a normal dispersion behavior, obeys the Cauchy's and Sellmeier's dispersion formulae. | ||||
| 2. | The optical constants such that oscillation energy Eo, the dispersion energy Ed, the high frequency refractive index n∞, the average oscillator wavelength λo and the oscillator length strength So of the PEEK fiber material are determined by plotting (n2 − 1)−1 versus the squared photon energy E2 and the inverse of the squared wavelength λ−2 according to equations Equation(5) | ||||
| 3. | Determining the molecular structure constants fΔ(θ), θ, Φ||, Φ⊥, Φiso, χm%, (1 − χm)%, | ||||
Acknowledgment
The author would like to acknowledge a debt of gratitude and appreciation to Prof. A.A. Hamza, Professor of Physics, Faculty of Science, Mansoura University, and Ex-President of Mansoura University and British University in Egypt for his guidance, helpful advice and useful discussions.
References
- P.J.RaeE.N.BrownE.B.OrlerThe mechanical properties of poly(ether-ether-ketone) (PEEK) with emphasis on the large compressive strain responsePolymer482007598615
- YuanM.J.A.GallowayR.J.HoffmanS.BhattInfluence of molecular weight on rheological, thermal, and mechanical properties of PEEKPolym Eng Sci511201194102
- J.L.WhiteDongL.HanP.H.M.LaunRheological properties and associated structural characteristics of some aromatic polycondensates including liquid-crystalline polyesters and cellulose derivativesPure Appl Chem7611200420272049
- KongY.J.N.HayThe measurement of the crystallinity of the polymers by DSCPolymer43200238733878
- A.M.VoiceD.I.BowerI.M.WardMolecular orientation in uniaxially drawn poly (aryl ether ether ketone): 1. Refractive index and X-ray measurementsPolymer346199311541163
- WeiC.L.ChenM.YuF.F.Temperature modulated DSC and DSC studies on the origin of double melting peaks in poly(ether ether ketone)Polymer (Guildf)44200381858193
- G.C.JacobJ.M.StarbuckJ.F.FellersS.SimunovicR.G.BoemanThe effect of loading rate on the fracture toughness of fiber reinforced polymer compositesJ Appl Polym Sci962005899904
- M.A.El-BakaryDetermination of radial structural properties and spectral dispersion curves of poly(aryl ether ether ketone) fibrePolym Int5320044855
- I.H.AhdalliM.A.El-BakaryInterferometric determination of structural properties of PEN highly oriented fiberInter J Polym Mater552006733745
- M.CakmakIntrinsic birefringence of poly ether ether ketoneJ Polym Sci Polym Lett271989119121
- M.PlutaAdvanced light microscopyvol. 31993PWNWarszawa
- N.BarakatA.A.HamzaInterferometry of fibrous material1990Adam HilgerBristol
- A.A.HamzaI.M.FoudaT.Z.N.SokkarM.A.El-BakaryDetermination of spectral dispersion curves of polypropylene fibresJ Opt A Pure Appl Opt11999359366
- A.A.HamzaI.M.FoudaT.Z.N.SokkarM.A.El-BakaryThe spectral dispersion curves in highly oriented fibresPolym Test202001847853
- A.A.HamzaT.Z.N.SokkarM.A.El-BakaryInterferometric determination of the birefringence of thermo-tropic polyester fibers and its copolymers of structure (PCPT. Co. CPO)J Appl Polym Sci125201218141821
- T.Z.N.SokkarM.A.El-BakaryThe refractive index profile of highly oriented fibresJ Phys D Appl Phys342001373378
- R.J.SamuelsStructure polymer properties1974Jhon WilyNew York54
- M.PlutaAdvanced light microscopyvol. 11989PWNWarszawa57
- S.H.WempleMaterial dispersion in optical fibersAppl Opt1819793135
- P.A.LeeG.SaidR.DavisT.H.LimOn the optical properties of some layer compoundsJ Phys Chem Solids3012196927192729
- H.De VriesC.BonnebatJ.BeautempsUni- and biaxial orientation of polymer films and sheetsJ Polym Sci Symp581977109156
- H.De VriesA new approach to the continuum theory of birefringence of oriented polymersZ Colloid Polym Sci2571979226238
- P.H.HermansContribution to the physics of cellulose fibers Amsterdam; North Holland1946
- T.Z.N.SokkarK.A.El-FarahatyM.A.El-BakaryDetermination of optical properties, dispersion, and structural parameters of Poly(ethylene terephthalate) fibers using automatic variable wavelength interferometry techniqueJ Appl Polym Sci89200317371742
- A.CunninghamG.R.DaviesI.M.WardDetermination of molecular orientation by polarized infra-red radiation in an oriented polymer of high polarizabilityPolymer151974743748
- Automatic Computer-Aided Microinterferometer for Measurements and Studies of Optical and Textile Fibers “Microinterferometer Operation Manual” Institute of Applied Optics Warsaw, Poland1996
- A.A.HamzaT.Z.N.SokkarM.A.El-BakaryA.M.AliVariable wavelength microinterferometry applied for irregular fibresJ Opt A Pure Appl Opt42002371376