
 ?Mathematical formulae have been encoded as MathML and are displayed in this HTML version using MathJax in order to improve their display. Uncheck the box to turn MathJax off. This feature requires Javascript. Click on a formula to zoom.
Abstract
Composite concrete decks are commonly used in the construction of highway bridges due to their rapid constructability. The interfacial shear transfer between the top slab and the supporting beams is of great significance to the overall deck load carrying capacity and performance. Interfacial shear capacity is directly influenced by the distribution and the percentage of shear connectors. Research and design guidelines suggest the use of two different approaches to quantify the required interfacial shear strength, namely based on the maximum compressive forces in the flange at mid span or the maximum shear flow at the supports. This paper investigates the performance of flanged reinforced concrete composite beams with different shear connector’s distribution and reinforcing ratios. The study incorporated both experimental and analytical programs for beams. Key experimental findings suggest that concentrating the connectors at the vicinity of the supports enhances the ductility of the beam. The paper proposes a simple and straight forward approach to estimate the interfacial shear capacity that was proven to give good correlation with the experimental results and selected code provisions. The paper presents a method to predict the horizontal shear force between precast beams and cast in-situ slabs.
Introduction
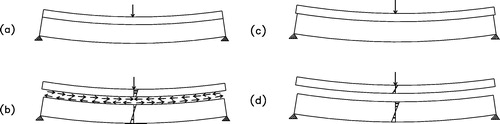
Composite concrete decks are commonly used in the construction of highway bridges, as one of the rapid forms of construction. The system consists of precast beams (web elements) supporting a cast-in-situ reinforced concrete slab (flange). Under service dead and vehicular live loads, considerable interfacial shear stresses develop which impose a significant demand on interfacial shear transfer elements, namely shear connectors. The behavior of the interface between the precast web and the cast-in-situ flange as well as the load carrying capacity of the composite girder is greatly influenced by the distribution and the percentage of shear connectors. In the absence of interfacial shear resistance, the composite action of the girder will not develop and the deck will respond as two separate elements. On the other hand, well distributed shear connectors with significant shear transfer capacity will clamp the components together and the behavior of the composite girder will approach that of the monolithically cast deck as shown in a–d.
Fig. 1 (a) Fully composite section, (b) interfacial shear transfer in composite section, (c) horizontal slip, (d) non-composite section.
Research and design guidelines, AASHTO, ACI and CSA codes [Citation1Citation[2]Citation3] suggest the use of two different approaches to quantify the interfacial shear, namely based on the maximum compressive forces in the flange at mid-span or the maximum shear forces at the supports. Several proposals were suggested to calculate the interfacial shear capacity as follows:
| 1. | In 1958 Mast [Citation4] introduced a linear shear-friction equation, and was later revised in 1960 by Anderson [Citation5]. The equation is as follows: | ||||
| 1. | In 1978 Shaikh [Citation6] proposed an equation for interfacial shear capacity that was used by PCI [Citation7] as the basis for the design equations. The equation is as follows: | ||||
| 1. | In 1994 Loov et al. [Citation8] introduced an equation applicable for both high and low clamping stresses. | ||||
| 1. | In 2001 Patnaik [Citation9] proposed a linear variation on his previous horizontal shear equations. Patnaik states that it is possible to obtain some nominal shear strength from a smooth interface with no reinforcing, but for design this is not recommended. | ||||
Experimental program
The experimental program consisted of testing seven reinforced concrete flanged beams, each beam has a thickness of 240-mm web, 150-mm web width, 60-mm flange thickness, 450 mm flange width and 2350-mm span. The beams are simply supported with a clear span of 2100-mm. The main reinforcement of all beams is 5Φ16-mm while the top reinforcement is 2Φ12-mm in the web, 5Φ10-mm/m for transverse steel (stirrups), passing through both the web and the flange in control beam (B01), and through the web only in the other six beams. The flanges are reinforced with 4Φ10-mm and transverse steel of 5Φ6/m. The beams were tested as will be described later up to the appearance of the first crack at the interface between the web and flange except for the control beam which was tested up to failure. This is mainly to allow for strengthening the beams subjected to excessive horizontal shear forces and evaluate the strengthening scheme. The test results of strengthened beams are given in a different research study (Awry et al.) [Citation10]. The beams had various shear connector configurations; namely in terms of the provided shear connector’s reinforcement area and the scheme of connector’s distribution. and summarize the details of the tested beams. The beams were cast and tested at the concrete laboratory of the HBRC (Housing and Building National Research Center).
Fig. 2 Typical details of tested beams.
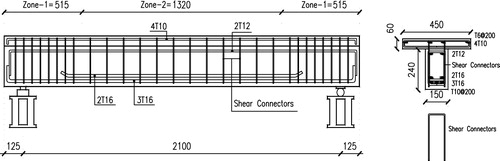
Table 1 Matrix of tested beams.
Beams B02 and B03 have the same area of equally spaced shear connectors using different diameters and spaces. Beams B06 and B07 have the same area of shear connectors varying its distribution, where as in B02 and B03, the shear connectors were equally spaced while in B06 and B07, the concentration of the connector at the ends was adopted. Beams B04 and B05 are similar to Beam B02 and B03 but with higher number of connectors ratio.
Test set-up, instrumentation and loading protocol
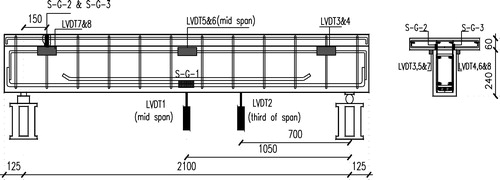
The beams were tested under monotonically increasing vertical load using a hydraulic Jack of 1000-kN capacity measured using a load cell of 1000-kN capacity. Four point loads on the beams were simulated using four steel box sections and a system of steel I-beams as shown in . Displacements were monitored using linear variable displacement transducers (LVDT) with 0.01-mm accuracy. Strains in the steel reinforcement and shear connectors were monitored with 120-ohm resistance steel strain gauges. The data were collected using a data acquisition system and “lab view” software at a rate of 1 sample per second. shows the locations of the strain gauges and the LVDTs for a typical beam.
Fig. 3 Test set-up for the beams.
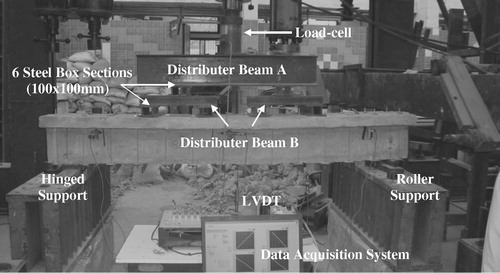
Fig. 4 Instrumentation for the beams.
Experimental results and discussion
Experimental observations and crack pattern
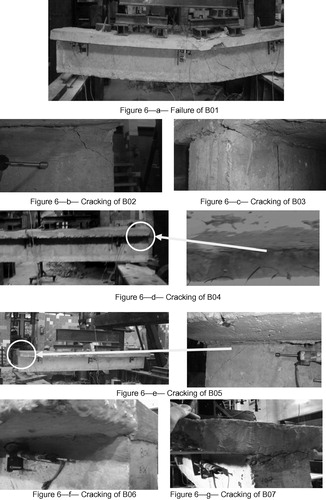
All the beams, except the control beam “B01” that was tested up to failure, were tested up to the appearance of the first horizontal crack at the interface between the web and flange. This crack was accompanied by the appearance of shear and flexural cracks in the web.
The ductility is given by the ratio of two areas under the load–strain curve of the RC beams. The first area, A1 is calculated from zero load up to the elastic peak load. The second area, A2 is calculated on the remaining curve from the elastic peak up to the higher of failure load or 80% of the maximum load. The ductility factor of all tested beams is expressed by Eq. (7), and given in . The ductility factor provides an indication on the inelastic capacity of the beams. The elastic peak load is predicted as shown in by the intersection of the initial inclined line, and the horizontal line, which is equal to the maximum load.
Fig. 5 Prediction of ductility.
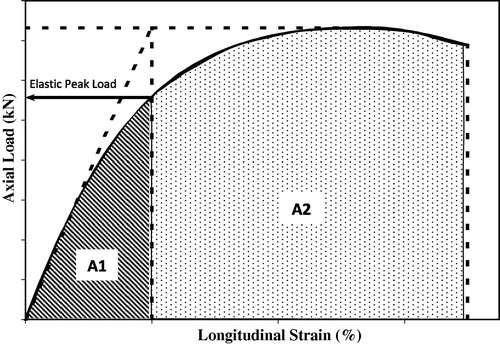
Table 2 Results of tested beams.
summarizes the recorded experimental data for the tested beams and reports the failure mode of the beams concluded from the cracks in the web accompanied by the interfacial shear crack. a–g shows the failure and crack pattern for the tested beams.(7)
(7)
Fig. 6 Failure and cracking pattern for beams.
Discussion of the experimental results
a shows the load versus mid-span deflection for all the tested beams up to the appearance of the first interfacial crack. The tested beams had various shear connector’s reinforcement ratios, around, 0.20% and 0.3%, using Ø4-mm and Ø6-mm bars. Examination of the curve shows that all composite beams with reinforcement ratios around 0.2% had almost the same ultimate load capacity of 170 kN which is 46% of the control (monolithic) beam. On the other hand the beams with reinforcement ratio around 0.3% had an ultimate load of 250 kN which is 68% of the control beam. The figure also shows that the stiffness of the beams decreased compared to the control beam, beams with ratio of shear connectors equal to 0.3% showed higher stiffness than beams with ratio of 0.2%, beams with shear connectors with 6 mm diameter showed higher stiffness than that with 4 mm diameter. Moreover the figure suggests that the load capacity is directly proportional to the reinforcement ratio regardless of the shear connectors distribution scheme, Furthermore the figure shows that concentrating the connectors at the beam ends, where the maximum shear forces are developed, results in significantly higher ductility as summarized in , slippage between web and flange is approximately equal to zero at mid span while maximum slippage occurs at the end of beam as shown in b so concentrating the connectors at the beam ends result in increasing clamping between web and flange and hence increasing ductility.
Fig. 7 (a) Load–Mid-span deflection Curves for un-retrofitted beams. (b) Horizontal shear deformation of beams.
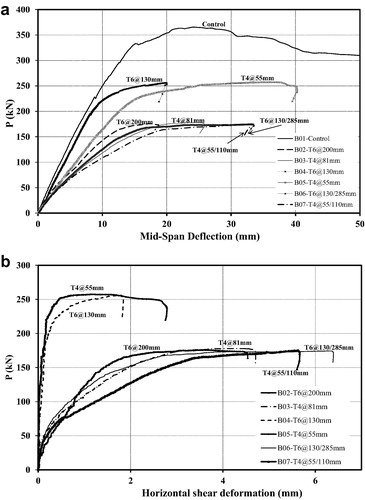
b shows the horizontal deformation between web and flange at distance d/2 from the support. The figure shows that as the shear connector’s ratio increases the horizontal shear deformation decreases. For beam with same area of shear connector, beam with 4-mm connectors having small spacing between connectors experienced more horizontal shear deformation than that with 6-mm connectors having bigger spacing between connectors than 4-mm when using equal distribution of connectors while the opposite was observed when concentrating the connectors at the ends. This can be attributed to the higher stiffness of the 6 mm bars, which governed the behavior for beams with equally spaced connectors. The relatively large number of 4 mm bars used at the ends of B07 resulted in higher stiffness compared to B06.
Analytical study
The analytical phase of this research includes a rational analysis to predict the behavior of RC composite flanged beams. Strain compatibility approach was used to predict the ultimate carrying capacity of the beams assuming the web and flange as one section-full contact (control beam). Deflection of the beam was calculated using integration of the curvature along the span of the beam. Response-2000 program [Citation11] was used to predict the ultimate carrying capacity limits in both shear and flexural over-which the experimental program was based on both flanged and rectangular sections.
Response program is a computer program based on reinforced concrete sectional analysis using the modified compression field theory. The program was used to predict the flexural and shear capacities for the beams once as monolithic flanged section and once as rectangular section with the web dimensions only. These values represent the upper and lower bounds of the capacities of the composite sections. shows the capacities of both sections for shear and moment.
Table 3 Capacities of rectangular and flanged sections.
Strut and tie model was used to analyze the beams and then compared with the experimental program. A mathematical equation was derived from several strut and tie models to calculate interfacial shear capacity of the beams. An estimation of the shear transfer capacity from previous research was conducted and compared with experimental results.
Analytical procedure using strut and tie method
The strut-and-tie method was used to predict the failure load of the tested beams. Truss mechanism was used in this study to simulate the effect of horizontal shear ties and main steel reinforcement in the tested beams. The model is shown in .
Fig. 8 The strut and tie mechanism for the tested beams.
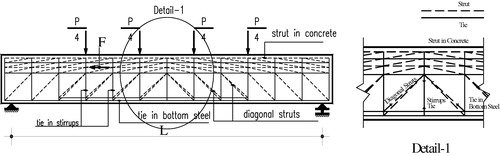
The model shows the flow of compression and tension forces in the beam. In this model, the main longitudinal compression and tension chords existed at the top concrete compression flange and at the location of the main bottom steel reinforcement, respectively. Vertical ties of the truss existed at the location of the stirrups. Diagonal struts were used between the stirrups to join the top strut with the tie at the bottom. Two truss models were used in the upper flange and in the web. The two models were connected together using vertical and diagonal members representing the steel anchor and friction between the web and concrete flange. Each beam was simulated with strut and tie model, which was loaded with 10 kN/m, and the maximum force in the horizontal member which connected the web and flange was calculated. Eq. (8–1) shows the relation used for the calculation of shear transfer failure load for beams. show the parameters used in Eq. (8–1) and the resulted failure loads of the tested beams.(8-1)
(8-1) where
Table 4 Parameters and results from strut and tie models compared with experimental results.
F(kN), max horizontal shear force from strut and tie model calculated based on the total load (P) on points according to ,
P(kN), total gravity load applied on the beam resulting in interfacial shear failure, as shown in ,
μ, coefficient of friction at the interface, Tanner 2008 [Citation12]
s(mm), spacing between shear connectors,
L(mm), span of beam, n, number of shear connector links,
Asc(mm2), area of shear connector bar,
fy(MPa), yield strength of bar.
It should be noted that the shear resistance of shear connectors were assumed to be (0,8fy) as given in Eq. (8–1). The factor 0.8 is referenced in the ECP Code [Citation13] as 0.7 and is referenced as 0.85 in Madheswaran, C.K., (2007) [Citation14].(8-2)
(8-2)
Proposed model for the calculation of shear transfer
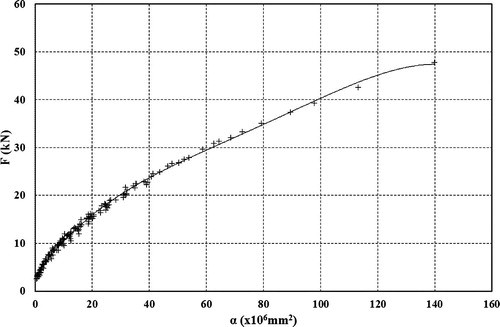
Several strut and tie models were used to predict a direct relation to calculate the interfacial shear capacity of different beams with varying parameters using the aforementioned procedure given in Eq. (9). The investigated parameters included beam span 3–10-m, depth 0.24, 0.35, 0.45, 0.55, 0.65-m and spacing between shear connectors 100, 150, 200, and 250-mm. shows the relationship established from this study.(9)
(9) where α, the factor calculated to detect horizontal shear force F due to uniformly distributed load of 10 kN/m′ on the beam span,
Fig. 9 Proposed relationship between “α“ and horizontal shear force.
s, spacing between shear connectors,
d, distance from top fiber of concrete flange to main steel,
d′, distance from top fiber of web to main steel.
The proposed model depends on different variables affecting the shear flow as follows:
| 1- | “μ“ friction coefficient, where the capacity of the composite beam is directly proportional to “μ“. | ||||
| 2- | Span(L), where the applied shear flow of the composite beam is directly proportional to “(L2)“. | ||||
| 3- | Depth of beam (d), where the applied shear flow of the composite beam is inversely proportional to “d”. | ||||
| 4- | Inclination of strut connecting the flange and the web, where the applied shear flow of the beam is inversely proportional to the inclination of the strut. | ||||
Accordingly, a factor “α“ is calculated using Eq. (9) representing all the variables affecting the shear flow. Based on the factor “α“ for any given beam the horizontal shear resulting from a uniform load of 10 kN/m′ may be directly calculated from . Using Eq. (8–2) to calculate the value of P which is the total gravity load applied on the beam resulting in interfacial shear failure.
Prediction of shear transfer using proposed model and codes
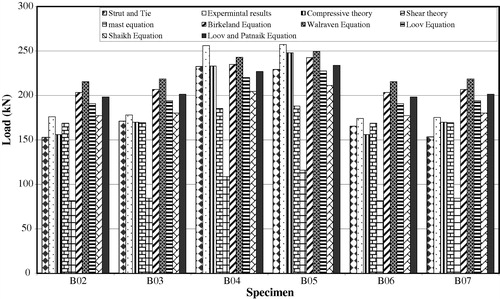
Shear transfer failure load values were calculated using available models and codes, the calculated interfacial shear failure loads results were compared with the experimental results. shows the results of the calculated interfacial shear failure load compared to the experimental values. Comparison showed that there was a good agreement between the Canadian code, proposed strut and tie model and the experimental results while a variance in results between 12% and 57% was observed for the other models.
Table 5 Maximum interfacial shear from existing models and codes compared to experimental values.
shows the comparison between the interfacial shear failure loads calculated from models and codes compared to the experimental results.
Fig. 10 Results calculated from previous research and codes compared to experimental results.
Conclusions
The present study investigates the interfacial shear behavior of composite flanged concrete beams. The behavior of beams is influenced by the ratio and distribution of ties along beam span. The following summarizes the main findings of this investigation:
| – | Using the same shear connector ratio, smaller diameter of shear connectors shows better ductility compared to larger diameter in both cases of equally distributed shear connectors along beam span and concentration of shear connectors at beam ends due to smaller spacing. | ||||
| – | Concentration of shear connectors in the vicinity of the supports shows better ductility than equally distributed shear connectors along the beam span because slippage between web and flange approximately equal to zero at mid span while maximum slippage occurs at the end of beam so concentrating the connectors at the beam ends results in increased clamping between web and flange and consequently increasing ductility. | ||||
| – | Calculation of interfacial shear force based on the maximum compressive forces in the flange at mid span gives more reasonable values than maximum shear flow at support compared to experimental values. | ||||
| – | The paper proposes a rational model using the strut and tie method to predict the interfacial shear force in beams uniformly loaded along the beam span and several models can be proposed for any other type of loading. | ||||
Notes
Peer review under responsibility of Housing and Building National Research Center.
References
- AASHTO LRFD Bridge design specification, American Associate of State Highway and Transportation Officials, Washington D.C., 2010.
- ACI Committee 318, Building Code Requirements for Reinforced Concrete (ACI 318-2008) and Commentary (ACI 318-2008), American Concrete Institute.
- CSA standard A 23.3-94 Concrete Design Handbook. Canadian-Portland Cement Association. Copy right 1995.
- R.F.MastAuxiliary reinforcement in concrete connectionsProceedings of ASCE Journal94ST6196814851504
- R.A.AndersonComposite designs in precast and cast-in-place concreteProgressive Architecture41–491960172179
- A.F.ShaikhProposed revisions to shear-friction provisionsPCI Journal23219781221
- PCI Design Handbook – Precast and Prestressed Concrete, 4th ed., Precast/Prestressed Concrete Institute, Chicago, IL, 1992.
- R.E.LoovA.K.PatnaikHorizontal shear strength of composite concrete beams with a rough interfacePCI Journal39119944869
- A.K.PatnaikBehaviour of composite concrete beams with smooth interfaceJournal of Structural Engineering12742001359366
- M.AwryT.El-AfandyH.OkailA.AbdelrahmanRehabilitation of composite concrete RC beams deficient in interfacial shear transferAzhar Journal2013
- E. Bentz, M.P. Collins, September 2001 Response-2000 V. 1.0.5.
- J.A.TannerCalculating shear friction using an effective coefficient of frictionPCI Journal2008114120
- E.C.P. 2007 Egyptian code of practice for reinforced concrete constructions, Ministry of Development, New Communities, Housing and Utilities, Housing and Building Research center.
- C.K.MadheswaranStrength of shear connectors in steel-concrete composite beamsIE(I) Journal-CV882007
- P.W.BirkelandH.W.BirkelandConnections in pre-cast concrete constructionACI Journal6331966345367
- J.WalravenJ.FrenayA.PruijssersInfluence of concrete strength and load history on the shear friction capacity of concrete membersPCI Journal32119876684
- R.E. Loov, “Design of Precast Connections”, Paper Presented at a Seminar Organized by Compa International Pte Ltd, September 25–27, Singapore, p. 8.