
Abstract
Excessive phosphorus can cause eutrophication in water bodies and needs to be reduced in most wastewaters before being discharged into receiving waters. The excess biological phosphorus removal (EBPR) process has been shown to be an economical and environmentally compatible method for reducing phosphorus from wastewaters. Despite the complexity of EBPR mechanisms, appropriately designed and operated treatment plants can easily achieve phosphorus (P) removal as long as EBPR-available organic substrates such as short chain volatile fatty acids (VFAs) and an aerobic–anaerobic (respectively) reactor configuration are provided. Some factors and operating conditions, adversely affect the performance of EBPR plants.
Available design and research information for the EBPR process were directly related to organic strength, solids and phosphorus content in wastewater. The success of excess biological phosphorus removal (EBPR) process is largely dependent on the characteristics of organic carbon present in wastewater. The COD and BOD5 content of wastewater will also determine whether a phosphorus removal EBPR system is required. For this paper, the performance of EBPR was investigated using modified contact stabilization activated sludge pilot plant. The study involved the construction of pilot plant which was setup in Quhafa WasteWater Treatment Plant (WWTP), Al Fayoum, Egypt. Results showed average removal efficiencies of COD, BOD5 and TP are 91%, 92% and 85% respectively.
Introduction
Several biochemical models have been developed to explain the mechanisms of excess biological phosphorus removal (EBPR) processes using activated sludge. Even though the most widely accepted current models agree on the aerobic EBPR metabolic pathways, some differences exist when the anaerobic EBPR processes are considered [Citation1Citation[2]Citation3]. The differences are mainly related to the means of producing reducing power for PHA synthesis. It is apparent that EBPR biochemistry is complex and no exact model exists yet, but despite this complexity, wastewater treatment plants can achieve phosphorus removal as long as wastewater containing organic substrate in the form of short-chain volatile fatty acids (SCVFAs) is introduced into the anaerobic zone of the treatment plant, and the mixed liquor is alternated between anaerobic and aerobic conditions. It is known that the best EBPR performance is obtained when influent containing volatile fatty acids (VFAs) is initially introduced into a strictly anaerobic zone. Hence, an oxygen and/or oxidized nitrogen free environment is a major prerequisite for a successful EBPR process [Citation4,Citation5]. In addition, complete VFA (e.g. acetate) uptake in the anaerobic stage is a key parameter affecting EBPR performance. The effects of different types of VFAs on EBPR performance have been investigated and it was found that acetate is the best substrate among other short chain fatty acids such as butyrate, valerate, their isoforms and propionate in terms of yielding the highest phosphorus removal per unit COD of VFA [Citation6,Citation7]. However, even when the nutritional prerequisites are strictly provided, the success of the EBPR process also strongly depends on other factors such as pH and temperature. Additionally, wastewater and operating conditions such as the influent COD/TP ratio, the amount of electron acceptor entering the anaerobic stage, and the biomass solids retention time (SRT) can influence the efficiency of EBPR. The solids retention time (SRT) is a unified design parameter that is related to the steady state specific growth rate of the biomass in a bioreactor system. It determines electron acceptor requirement and the excess biomass production rate [Citation8].

“Minimum SRT”, another design parameter, defines a critical SRT point, below which no growth of biomass can occur. The washout SRT value is selected considering the growth of the slowest growing organisms desired in the system, usually nitrifiers, and sludge flocculation [Citation8]. Because biochemical kinetic rates become slower at cold temperatures, the desired organisms will need more time to grow; i.e. their required retention time in the system will need to become longer. Failure to increase the SRT as temperature decreases may result in partial or complete loss of the desired biological treatment function(s), e.g., nitrification or EBPR. EBPR was completely lost when the SRT was reduced from 15 to 5 days at 10 °C.
Material and methods
Main objective
The idea of this investigation was applied through setting up a pilot plant in Quhafa WWTP depending on using a contact-stabilization activated sludge technique for enhancement of biological phosphorus removal in domestic wastewater treatment by some main amendments. This idea is suitable for regional conditions because activated sludge is the most common traditional system for domestic wastewater treatment plants so the use of this application to solve phosphorus contamination removal problems is more easily than other traditional methods in EBPR especially in Egypt.
The main objective is to modify the contact stabilization activated sludge system for Biological Phosphorus removal to achieve the following objectives:
| (1) | Enhance the performance of activated sludge system for BPR to sustain industrial phosphorus discharge. | ||||
| (2) | Optimize design criteria (MLSS and SRT) for BPR. | ||||
| (3) | Enhance the characteristics and amount of waste sludge to be suitable for processing and disposal. | ||||
Regional conditions
The climate in this region is defined as subtropical with an average temperature of 15 °C in winter and 35 °C in summer. The wastewater at Quhafa WWTP is mainly domestic in addition to some industrial activities. shows physical and chemical characteristics of raw waste water in Quhafa WWTP over the entire experimental period.
Table 1 The physical and chemical characteristics of raw waste water in Quhafa WWTP.
Model description
The raw wastewater will be collected from the channel connecting between grit removal chamber and aeration tank distribution chamber in Quhafa WWTP by using submersible pump (2 HP) connected directly to a polyethylene tank with a volume of 1000 L located at a high level to feed the model with raw wastewater, two small pumps connected directly to the model for each return sludge pipe.
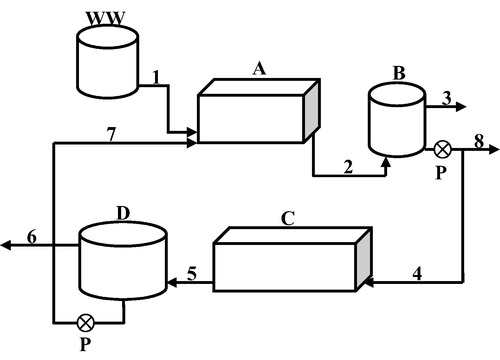
As shown in the model arrangement consisted of the following:
| – | WWT: A vertical polyethylene cylindrical tank with a volume of 1000 L located at a high level to feed the model with raw wastewater. | ||||
| – | A: Contact tank. | ||||
| – | B: Final sedimentation tank. | ||||
| – | C: Stabilization tank. | ||||
| – | D: Thickener tank. | ||||
| – | Piping system: | ||||
| (1) | Main influent pipe of diameter 1 inch with main control ball valve. | ||||
| (2) | Delivery pipe of diameter 1 inch with main control ball valve from contact tank to final sedimentation tank. | ||||
| (3) | Effluent pipe from final sedimentation tank. | ||||
| (4) | Delivery pipe of diameter 1 inch for return of sludge from final sedimentation tank to stabilization tank. | ||||
| (5) | Delivery pipe of diameter 1 inch with main control ball valve from stabilization tank to thickener tank. | ||||
| (6) | Drain pipe of diameter 1 inch from supernatant zone in thickener. | ||||
| (7) | Delivery pipe of diameter 1 inch for return of sludge from thickening tank to contact tank. | ||||
| (8) | Waste sludge pipe of diameter 1 inch from sludge zone in F.S.T. | ||||
Fig. 1 Pilot plant schematic diagram.
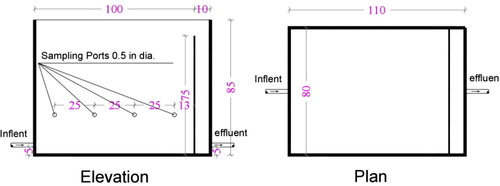
Contact tank (aerobic zone) (A)
The contact tank is a rectangular galvanized steel tank. The reactor is furnished with sampling ports 10 cm from the bottom along the effective length equipped with controlling valves as shown in . Influent distribution system consists of a plastic tube with diameter 1 inch at the bottom of the tank and effluent weir to control hydraulic retention time inside the tank. The tank is equipped with an air distribution system connected to an air compressor (3 HP) to get fine air bubbles along the length of the tank to control dissolved oxygen concentration not less than 2.0 mg/L.
Fig. 2 Contact tank (dimensions/cross sections).
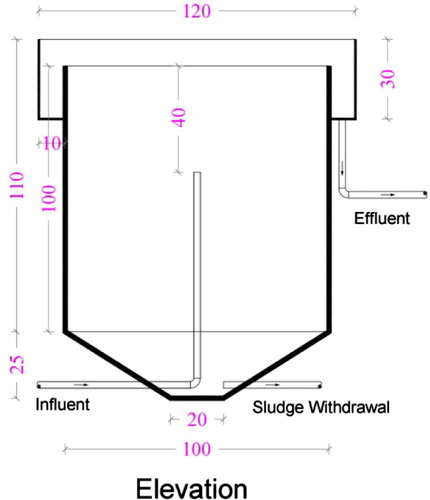
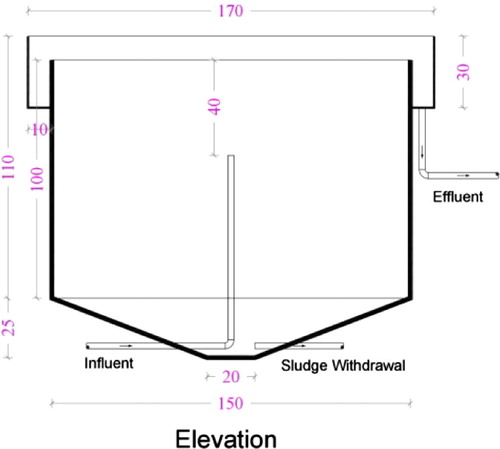
Final sedimentation tank (B)
The final sedimentation tank is a circular galvanized steel tank with 1 inch inlet pipe at the middle of the tank from the bottom and effluent weir at the outer perimeter as shown in . Water flows from the contact tank to the final sedimentation tank by gravity (final sedimentation tank is about 10 cm lower than contact tank effluent weir). Sludge withdrawal from the bottom of the tank with a controlled time pump to the inlet of stabilization tank.
Fig. 3 Final sedimentation (dimensions/cross sections).
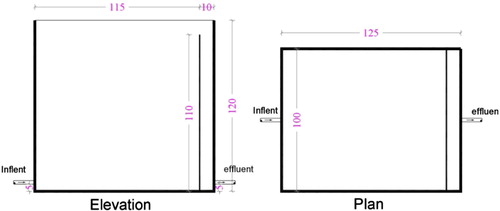
Stabilization tank (C)
The stabilization tank is a rectangular galvanized steel tank as shown in . As mentioned previously the influent sludge is timely controlled by a pump with 1/2 inch pipe at the bottom of the tank and movable effluent weir at the other side of the tank to control hydraulic retention time inside the tank. The tank is equipped with an air distribution system connected to 3.0 hp air compressor to get fine air bubbles along the length of the tank to maintain dissolved oxygen concentration not less than 2.0 mg/L.
Fig. 4 Stabilization tank (dimensions/cross sections).
Sludge thickening tank (D)
The sludge thickening tank is a circular galvanized steel tank with 1 inch inlet pipe at the middle of the tank from the bottom and effluent weir at the outer perimeter as shown in . Water flows from the stabilization tank to the sludge thickening tank by gravity. Sludge withdrawal from the bottom of the tank is achieved with a controlled time pump to the inlet of contact tank.
Fig. 5 Sludge thickening tank (dimensions/cross sections).
Experimental methodology
It is planned to work continuously 24 h a day under the realistic conditions of operation, such as sunlight and fluctuation in flow capacity and characteristics. It should be noted that raw sewage was always fed to the system without the application of any pretreatment facility e.g. settling or temperature/pH adjustment. The measured parameters during experiment were BOD5, COD, TP, TS, TSS, VSS, TDS and pH and samples were collected two times each week from influent wastewater, effluent treated water, thickener tank supernatant and contact tank.
Results and discussion
The reactor had a total volume for water line 1.44 m3 and overall retention time of 4.3 h (contact tank and F.S.T) and sludge line total volume 2.9 m3 with an overall retention time of 24 h (stabilization tank and sludge thickener). The actual retention times of the different tanks (including recycle streams) are shown in .
Table 2 Dimensions and actual retention times of the different tanks.
The return sludge ratio was kept constant at 0.35 times the influent flow. The system was operated for a total of 150 days for 1st stage, at an SRT of 10 days. The reactor was initially seeded with sludge from full scale extended aeration activated sludge Quhafa WWTP.
The average organic loading rate of the system was 1.5 kg COD/VSS.d. and volumetric loading rate 3.8 kg COD/d.
The following table indicates the units dimensions and the experimental characteristics.
Overall system performance
In that point the evaluation of the system can be achieved through the observation of concentrations for some main variables such as TP, organic matter (COD, BOD5) and pH in influent wastewater and effluent from F.S.T.
Organic matter removal efficiency
In and it can be seen that during the first three months of operation, both BOD5 and COD removal efficiencies were low and fluctuated. However, after the startup period the performance of the system started to be improved except for rare toleration which is attributed to the hydrodynamics of the system In general; high and stable, BOD5 and COD removal efficiencies were achieved.
Fig. 6 COD removal efficiency.
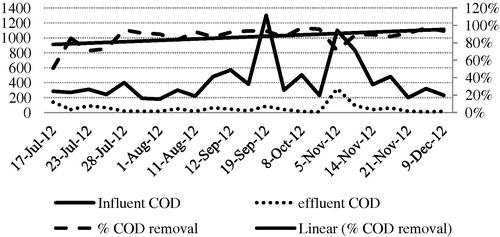
Fig. 7 BOD removal efficiency.
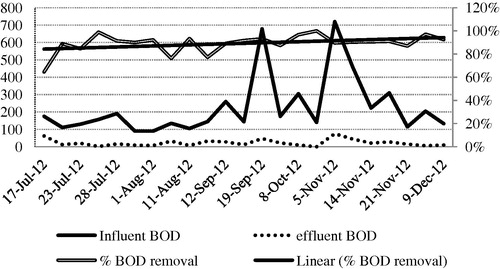
After the startup period, the average COD and BOD5 removal ratio for influent and effluent system was about 91% and 92%, respectively.
It can be seen that the COD and BOD5 removal efficiency was in the above mentioned range with a small variation, which fluctuated increasingly up to 97% and decreasingly till 89%.
Phosphorus removal efficiency
shows the phosphorus treatment efficiency at startup 1st trial, startup 2nd trial and 1st stage period.
Fig. 8 TP removal efficiency.
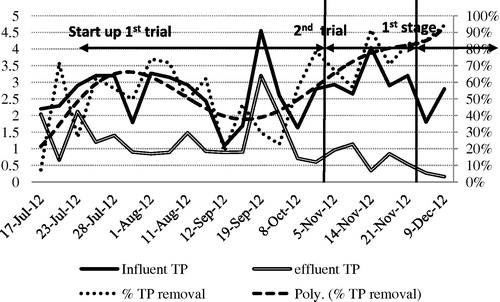
During startup period the removal efficiency of TP was unsteady, the performance of system take to decreasing and started to stop during this period at duration time from 9 September 2012 to 23 September 2012.
By observing and scrutinizing of this phenomenon has been shown the reason of this failure in TP removal efficiency during that mentioned period.
In the 1st trial of startup, an anaerobic tank was installed after stabilization tank and solids settle at the bottom of the tank because of the vertical up flow velocity so that solid concentrations at the bottom of anaerobic tank increase gradually and anaerobic sludge digestion occurs.
In the 2nd trial of startup anaerobic tank had been removed and the anaerobic zone required for phosphorus release decided to be at the lower zone of sludge thickener, the performance of the system started to improve gradually with time.
Theoretically conventional aerobic activated sludge process removes phosphorus through sludge with the efficiency about 15–25% of phosphorus can be removed without enhancing biological phosphorus removal. During our investigation the average TP removal ratio for influent and effluent system was about 85%. It can be seen that the TP removal efficiency was in the above mentioned range with small toleration, which variable increasingly up to 94% and decreasingly till 71%.
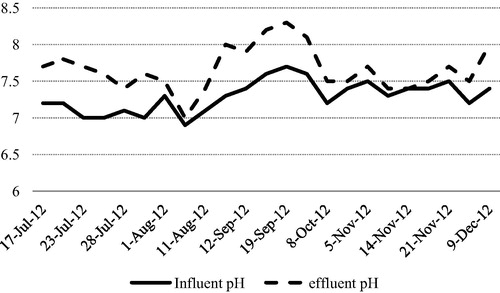
Influent and effluent pH
As shown in average influent pH 7.3 with maximum and minimum values 7.7 and 6.9 respectively while slight increase in effluent pH value with an average 7.67 and maximum and minimum values 8.3 and 7 respectively.
Fig. 9 Influent and effluent pH.
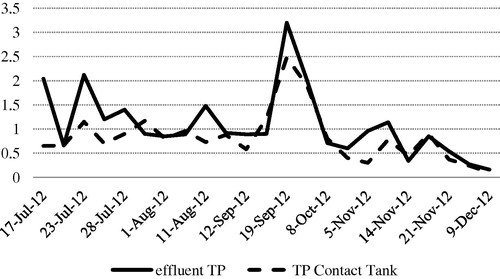
Contact tank performance
It is noticed that slight increase of TP concentration at FST effluent comparing with TP concentration inside contact tank as shown in and this increase is a result of bacteria secondary Phosphorus release at the bottom of FST as return sludge pump was working on intermittent basis.
Fig. 10 TP inside contact tank and effluent treated water.
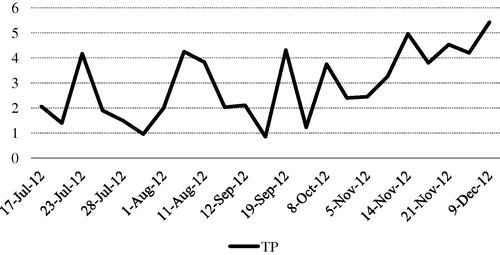
Thickener tank performance
Biological phosphorus removal can occur in the activated sludge process if aerobic phosphorus accumulating organisms (PAOs) are present in the system. The stimulation of the growth of organisms can be achieved if anaerobic and aerobic conditions alternate in turns, and volatile fatty acids (VFAs) are added or formed in the anaerobic condition by the fermenting bacteria.
As shown in values of TP concentrations in thickening tank bulk liquid considered the residual phosphorus after release operation under anaerobic conditions from internal cells of microorganisms. It can be seen that during the 1st trial of operation TP concentration was fluctuated. However, after 2nd trial of operation and startup the performance of phosphorus release into the system started to improve. Generally bulk liquid TP concentrations increasing with high stability were achieved. After startup period the maximum concentrations were 5.42 while the minimum value was 3.26 mg/L respectively.
Fig. 11 Supernatant TP.
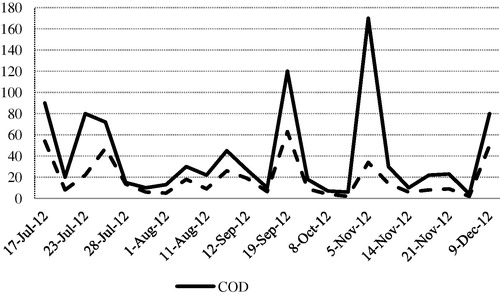
The main target of observing the organic matter concentrations in the supernatant zone (above anaerobic zone in thickener) was to evaluate the behavior of microorganisms under anaerobic zone and study the effect of phosphorus release operation from microorganism cells on consumption rate of carbon source from bulk liquid.
As shown in it can be seen that during the 1st trial of operation, both BOD5 and COD concentration in thickener effluent were fluctuated. However, after 2nd trial of operation and startup period the performance of the system started to improve except for rare toleration which is attributed to the hydrodynamics of the system in general. After startup period the maximum concentrations were 80 and 50 mg/L while the average values were 28 and 15 mg/L at the end of this experiment for COD and BOD respectively.
Fig. 12 Supernatant COD and BOD.
Conclusion
| (1) | Contact stabilization activated sludge technology proved to be successful as an excess biological phosphorus removal (EBPR). | ||||
| (2) | Using anaerobic zone to make phosphorus release before aerobic zone to achieve biological phosphorus uptake was successful in this system. | ||||
| (3) | Returning of sludge from thickener after release operation causes a change in the microorganism behavior and it became more voracious to phosphorus up take than traditional and minimize the retention time in contact tank. | ||||
| (4) | Thickener tank is able to work as an anaerobic zone and thickener at the same time. | ||||
| (5) | The average removal efficiency of COD and BOD5 was 91% and 92% respectively at the pilot plant conditions. | ||||
| (6) | The average removal efficiency of TP was 85% at the pilot plant conditions. | ||||
| (7) | The performance of phosphorus release was very successful. | ||||
Notes
Peer review under responsibility of Housing and Building National Research Center.
Related Research Data
References
- Y.ComeauK.J.HallR.E.W.HancockW.K.OldhamBiochemical Model for enhanced biological phosphorus removalWater Res.2012198615111521.184
- T. Mino, V. Arun, Y. Tsuzuki, T. Matsuo, Effect of phosphorus accumulation on acetate metabolism in the biological phosphorus removal process, in: Proc. of IAWPRC Specialized Conference, 28–30 Sept. 1987, Rome, Italy, pp. 27–38.
- H.PereiraP.C.LemosM.A.M.ReisJ.P.S.G.CrespoM.J.T.CarrondoH.SantosModel for carbon metabolism in biological phophorus removal processes based on in vivo 13C-NMR labeling experimentsWater Res.309199621282138
- J.L.BarnardG.M.StevensP.J.LeslieDesign strategies for nutrient removal plantWater Sci. Technol.1711/121985233242
- C.W.RandallJ.L.BarnardH.D.StenselDesign and Retrofit of Wastewater Treatment Plant for Biological Nutrient Removal1992Water Quality Management LibraryLancaster, Pensylvania, USA
- Z.H.Abu-GhararahC.W.RandallThe effect of organic compounds on biological phosphorus removalWater Sci. Technol.231991585594
- C.R.HoodA.A.RandallA biochemical hypothesis explaining the response of enhanced biological phosphorus removal biomass to organic substratesWater Res.3511200127582766
- C.P.L.GradyJr.G.T.DaiggerH.C.LimBiological Wastewater Treatmentsecond ed.1999Marcel Dekker, Inc.Newyork