
 ?Mathematical formulae have been encoded as MathML and are displayed in this HTML version using MathJax in order to improve their display. Uncheck the box to turn MathJax off. This feature requires Javascript. Click on a formula to zoom.
Abstract
In recent decades, high strength concrete (HSC) has been widely accepted by designers and contractors to be used in concrete structures, especially in high compressive stress elements. The research aims to study the behavior of high strength concrete columns under eccentric compression using experimental and analytical programs. The research is divided into two main parts; the first part is an experimental investigation for ten square columns tested at the Cairo University Concrete Research Laboratory. The main studied parameters were eccentricity of the applied load, column slenderness ratio; and ratios of longitudinal and transverse reinforcement. The second part is analytical analysis using nonlinear finite element program ANSYS11 on nineteen columns (ten tested square columns and nine rectangular section columns) to study the effect of the previous parameters on the column ultimate load, mid-height displacement, and column cracking patterns. The analyzed columns revealed a good agreement with the experimental results with an average difference of 16% and 17% for column ultimate load and mid-height displacement respectively. Results showed an excellent agreement for cracking patterns. Predictions of columns capacities using the interaction diagrams based on ACI 318-08 stress block parameters indicated a safe design procedure of HSC columns under eccentric compression, with ACI 318-08 being more conservative for moderate reinforced HSC columns.
Introduction
In recent years, high strength concrete columns have been widely used in many structures, especially, in high-rise buildings. ACI Committee 363 [Citation1] defined high strength concrete as a concrete strength of 41 MPa. More recently, compressive strengths approaching 138 MPa have been used in cast-in-place buildings. Concrete compressive strength higher than 65 MPa is referred to as high-strength concrete in this study.
Fig. 1.a Reinforcement arrangement along column height.
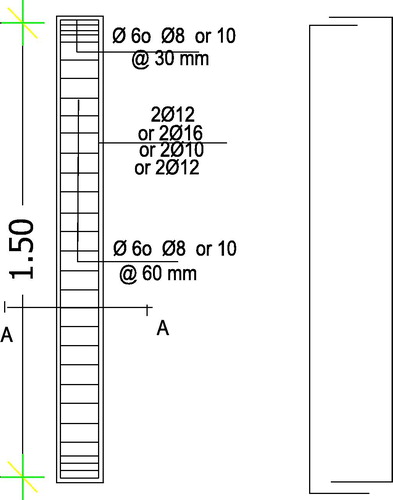
Fig. 1.b Columns section dimension and reinforcement.
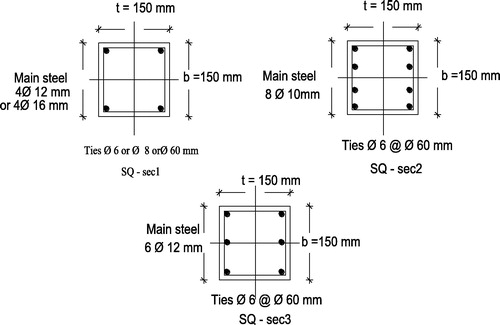
Fig. 1.c Columns setup and details.
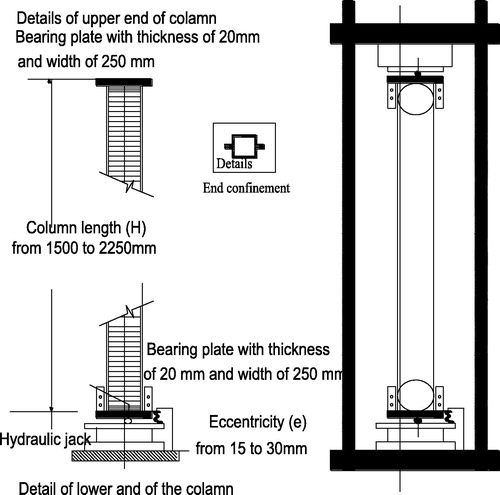
Fig. 1.d Columns setup demec points and details.
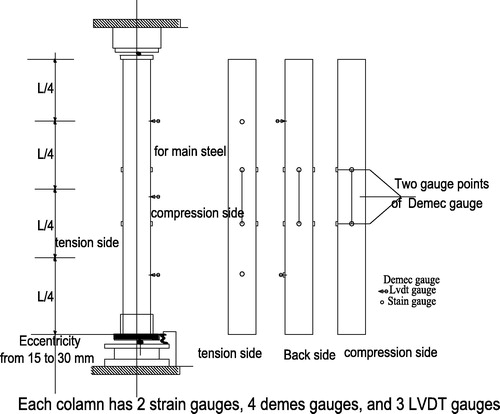
Fig. 4.a Load-concrete compressive strain for tested columns.
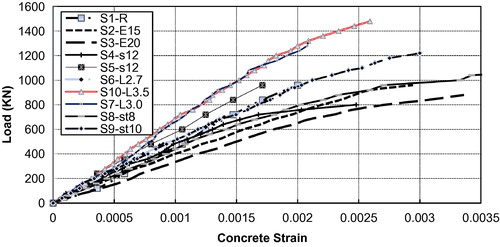
Fig. 4.b Load-stirrup tensile strain for tested columns.
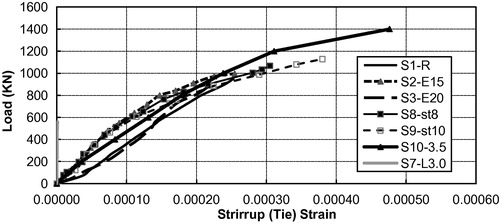
Fig. 6.a Solid 65 elements, ANSYS manual set.
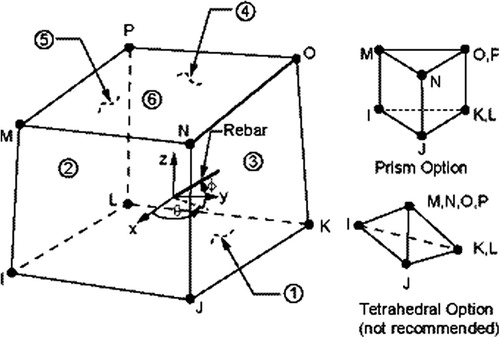
Fig. 6.b Link8, 3–D spar element ANSYS manual.
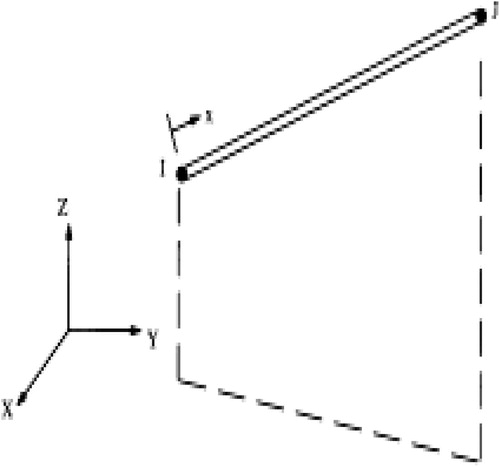
Fig. 6.c Compressive uni-axial stress-strain curve for concrete MacGregor [Citation6].
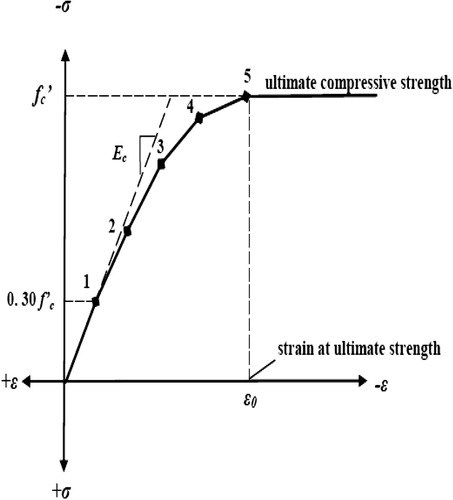
Fig. 6.d Applied boundary conditions on the model.
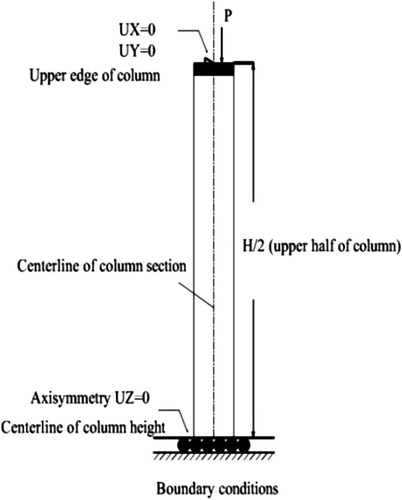
Fig. 9.a Experimental and analytical cracking patterns at failure for half of column S2–E15.
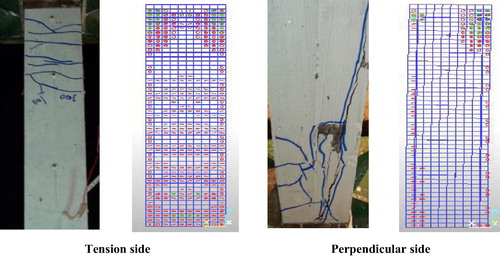
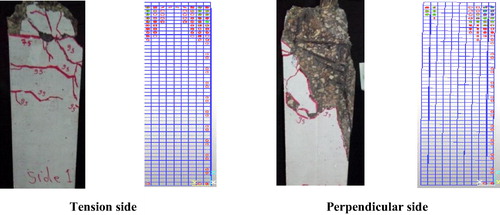
Fig. 9.b Experimental and analytical cracking patterns at failure for half of column S1–R.
Experimental and analytical studies have been carried out to study the effect of some parameters on the behavior of HSC columns. Results obtained from previous researches on HSC column due to centric and eccentric loads [Citation2-Citation[3]Citation[4]Citation[5]Citation[6]Citation[7]Citation[8]Citation[9]Citation10] indicated the following behaviors.
| a. | Rectangular columns with tie spacing equal to lateral dimension of columns showed no confinement effect. | ||||
| b. | Spalling of concrete cover tends to occur at strength below 85% of the unconfined concrete strength in columns with higher concrete strength and closely spaced transverse reinforcement. Columns behavior with closely spaced transverse reinforcement improves significantly with the use of high-strength confinement steel. | ||||
| c. | The use of larger bar diameters for longitudinal reinforcement produces little beneficial effect on the ductility of column. | ||||
| d. | Increasing ratio of longitudinal reinforcement in high-strength concrete columns leads to an increase in column capacity but decreases its ductility. | ||||
| e. | Tie configuration is very effective in strength and ductility of HSC columns. | ||||
| f. | In general, when axial load increases, the flexural ductility of the column decreases. | ||||
| g. | As eccentricity increases, columns give more ductile behavior in under and post-peak stage. | ||||
Objectives
The main objective of this study is to investigate the behavior of column members with high-strength concrete through experimental and analytical research. The study included testing of ten square columns subjected to eccentric axial compression. The aim of experimental program is to evaluate the effect of some testing parameters on the strength of HSC columns. In addition, the test results will be used to develop a recommended design approach using nonlinear finite element analysis to simulate columns leading to a better understanding of its behavior. This approach depends on the interaction between axial load and corresponding moments based on ACI 318-08 [Citation11] stress block parameters.
Moreover, it is aimed to use the conclusion of this research to extend the current ECP 203-07 [Citation12] design code provisions for HSC columns.
Experimental program
An experimental program was carried out by Hani. A. Kottb [Citation13] which consisted of ten square columns tested under eccentric loads by AMSELLER compression machine with 5000 KN capacity at the Cairo University Concrete Research Laboratory. A trial concrete mix design was made to get the target cubic compressive strength in range of 75 MPa, High-grade steel bars 10, 12, and 16 mm diameter were used for longitudinal reinforcement and mild steel bars 6 and 8 mm diameter were used for stirrups. The mechanical properties of the chosen steel bars obtained from tensile test of three samples, randomly selected from each batch, are shown in . Test program was divided into reference column and four groups representing the different studied parameters. These parameters are as follows:
| a. | Eccentricity of applied load (e) | ||||
| b. | Column slenderness ratio (H/t) | ||||
| c. | Longitudinal steel reinforcement ratio (μ) | ||||
| d. | Diameter of stirrups–transverse steel ratio (St) | ||||
Table 1 Mechanical properties of steel bars.
Group A, studies the effect of load eccentricity, Group B, studies the effect of slenderness ratio (H/t), Group C, studies the effect of longitudinal reinforcement ratios (μ), while. Group D, studies the effect of different diameters of ties (St), lists the details of these different groups.
Table 2 Properties of tested square columns in the experimental program.
Test specimens and test set up
All columns have cross sectional dimensions of 150 × 150 mm, but height varied from 1500 to 2250 mm. Longitudinal steel reinforcements were 4Φ12, 8Φ10, 6Φ12, and 4Φ16 mm to achieve steel percentage 2%, 2.7%, 3%, and 3.5%. Ties were Φ6 or Φ8 or Φ10 mm with constant spacing of 60 mm. Concrete external cover was 15 mm. All tested columns were loaded as pinned-end columns with eccentric load. Steel plate 250 × 250 × 20 mm was placed between machine head and column end to reduce the effect of load concentration.
The concrete strains in both compression and tension sides were measured by 200 mm demec gauges, the demec gauges were placed at column mid-height, lower, and upper quarters of column height in both tension and compression sides. Prior to casting of columns, two electrical strain gauges having 10 mm length were attached to longitudinal and transverse steel at mid height and were connected to data logger indicator to observe strains of steel directly. Lateral deformations of columns due to applied load were measured using three LVDT, of 0.001 mm accuracy, placed at column mid-height and both of column quarters in tension side.
In order to avoid premature failure, column ends were confined internally by reducing spacing of ties from 60 to 30 mm, and externally by adding external steel end caps to a depth of 100 mm. Those caps were constructed using steel plates of 10 mm thickness. Steel cylinders were used to give target eccentricity in both upper and lower ends of tested columns.
All specimens were tested and loaded until failure. The load was applied gradually with initial increment of 40 KN until cracking load; hence, increment was reduced to 20 KN up to failure load. At each load increment, the applied load, concrete strains, displacement at tension side, and steel strains for both main and transverse reinforcements were recorded. Details of tested columns, reinforcement, details, section configuration, test setup, and positions of the installed gauges are shown in .
Presentation of test results
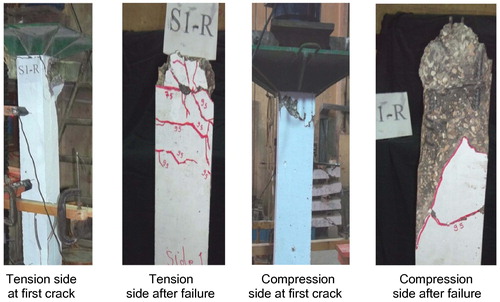
Tested columns S1–R, S2–E15 and S3–E20, with variable eccentricity, showed first crack at load 79%, 89%, 86% of its maximum load, respectively in a compression zone next to lower steel cap. Columns with different slenderness ratios S4–s12 and S5–s15, showed first crack at 85% of its maximum load with vertical compression crack, in compression zone at the middle of column height for S4–s12 while it was at lower third of column height for column S5–s15. Columns with different longitudinal steel ratios S6–L2.7 showed first crack at load 53.4% of its maximum load with vertical compression crack, in compression zone at upper of column height while column with higher longitudinal steel percentage S7–L3.0, S10–3.5 showed no visible pre-failure cracks. Columns with different stirrup diameters 8, 10 mm (S8–St8, S9–St10) had, first crack at load 90%, 85% of its maximum load with vertical compression crack, in compression zone at lower third of column height. All columns showed that by increasing load, the crack width increased and propagated until it failed. Cracking for column S1-R up to failure is shown in .
Fig. 2 Column S1–R, reference column at first crack and after failure.
For all tested columns, the maximum column displacement occurred at column mid height and with a limited displacement up to cracking loads. The maximum longitudinal concrete compressive strain corresponding to failure load occurred at mid height of column. Variations of load eccentricity on longitudinal steel strain are insignificant. Longitudinal steel strains in all columns were in compression and did not reach yield limit. Stirrups in all columns at mid height were subjected to tensile strain, but none of them reached their yield limit.
Columns with different slenderness ratios S4–s12 and S5–s15 showed maximum longitudinal concrete compressive strain at mid height of column respectively. Tension steel and stirrup strain reached its yield strain after failure load due to excessive deformation. Column has different longitudinal steel ratios S6–L2.7, S7–L3.0, S10–3.5, the tension steel did not reach its yield strain at failure load, but compression steel buckled. Stirrup strain did not reach its yield strain at failure load. Columns with different stirrup diameters Φ8, Φ10 mm (S8–St8, S9–St10) showed maximum longitudinal concrete compressive strain at column mid height. Tension steel did not reach its yield strain at failure load, while compression steel buckled under excessive compression.
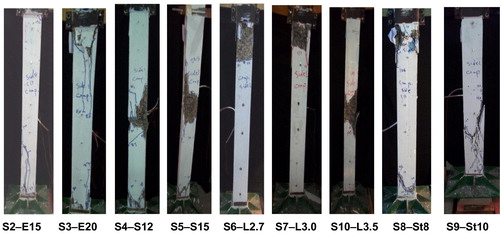
For reference column, S1–R failure occurred suddenly at upper third of column in compression side associated with spread in crushing of concrete and buckling of main bars in compression zone simultaneously in explosive brittle manner. For columns S2–E15, S3–E20 failure occurred gradually at lower third of column height in compression associated with spread in crushing of concrete, buckling of main bars in compression zone and tensile cracks simultaneously in a relatively ductile manner. For columns S4–s12, S5–s15 failure occurred gradually at middle of column height in compression associated with spread in crushing of concrete, buckling of main bars in compression zone and obvious tensile cracks simultaneously in a ductile manner. Columns with different longitudinal steel ratios S6–L2.7 showed that gradual failure occurred at upper third of column height in compression associated with spread in crushing of concrete, buckling of main bars in compression zone simultaneously in a brittle manner. S7–L3.0, S10–3.5 showed a catastrophic failure at upper third of column height in compression side. After ultimate load, failure was associated with spread in crushing of concrete, buckling of main bars in compression zone, and tensile cracks simultaneously in a relatively ductile manner. Columns S8–St8, S9–St10 with different stirrup diameters Φ8, Φ10 mm failed suddenly at upper third of column height in compression side. After ultimate load, failure was associated with spread in crushing of concrete, buckling of main bars in compression zone, and tensile cracks simultaneously in a relatively ductile manner.
The load-mid height displacement for all of the tested columns is shown in . The load-concrete compressive strains and stirrup strains for all tested columns are shown in Column crack patterns for the tested column after failure at compression side are shown in .
Fig. 3 Load-mid height displacement for tested columns.
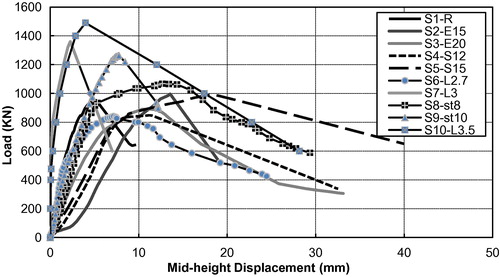
Fig. 5 View of tested columns compression side after failure.
Analysis of test results
Effect of load eccentricity
Group A, is designed to study the effect of load eccentricity. It contains control columns S1–R, S2–E15, and S3–E20, with eccentricities of 0.1, 0.15, and 0.2 of column thickness, respectively. As eccentricity of the applied loads increased, depth of compressed zone at mid height decreased. In column S1–R, the entire section was under compression; but in columns S2–E15 and S3–E20 the ratios of compressed zone to column depth were 83% and 73%, respectively.
Columns S2–E15 and S3–E20 had maximum concrete compressive strains of, 2900 and 3360 micron, respectively greater than maximum concrete compressive strain for reference column S1–R.
Specimens subjected to large load eccentricity S2–E15, S3–E20 showed greater mid height deflection at ultimate load of 63%, 89% respectively than column subjected to small load eccentricity S1–R. This amount of increase can be attributed to the increase of both eccentricity ratio as well as concrete strength in this group. Comparing displacement of S2–E15, S3–E20 specimens (having the same concrete strength) showed an increase of about 15% due to the increase of load eccentricity from 0.15 to 0.2. This assured the previous conclusions mentioned by many researches earlier, as load eccentricity increases, column undergoes greater mid height displacement.
Column S1–R failed at load 9.5% greater than column S3–E20 but 1.5% less than column S2–E15 due to greater concrete compressive strength of this column.
The load-mid height displacement showed that columns subjected to small eccentricity as reference column S1–R failed in a brittle manner, with little number of tension cracks and deformation during test and observation of sudden cover spalling and explosive compression failure. Columns subjected to large eccentricity, column S2–E15, S3–E20 showed a relatively ductile failure in comparison with propagation of tension cracks combined with large deformation with gradual cover spalling and tendency to buckle after peak load is reached. The degradation of loads also was less steeper than reference specimen S1–R which explains extension of post-peak stage longer than reference column.
Effect of column slenderness ratio
Group B, is designed to study the effect of column slenderness ratio and it consists of columns S1–R as a control column, S4–S12, and S5–S15 with slenderness ratios of 10, 12, 15, respectively. As slenderness ratio increased, depth of compressed zone at mid height decreased. In column S1–R, the entire section is under compression; but in columns S4–S12 and S5–S15 the ratios of compressed zone to depth of column are 89% and 94%, respectively.
Columns with greater slenderness ratio as in columns S4–S12 and S5–S15 had maximum concrete compressive strains of 2300 and 2100 micron, respectively greater than the maximum concrete compressive strain of 2000 micron for column S1–R.
Longitudinal steel strains in columns S4–S12 and S5–S15 turned from compression stage to tension stage and passed yield limit, while for column S1–R longitudinal steel strain was in compression stage and did not reach yield limit. Stirrups in all columns at mid height were subjected to tensile strain, but only columns S4–S12 and S5–S15 reached yield limit.
Specimens having greater slenderness ratios as specimens S4–S12, S5–S15 showed 200%, 345% greater mid height deflection at ultimate load than reference column S1–R with small slenderness ratio.
Column S1–R has slenderness ratio of 10, failed in a brittle way and greater load than columns S4–S12, S5–S15 which have greater slenderness ratio. They failed at lower load in ductile behavior with gradual cover spalling more tensile cracks, and large mid height displacement than reference column. The load mid height displacement for this group is shown in
Effect of longitudinal steel ratio
Group C, studies the effect of longitudinal steel ratio. It consists of columns S1–R as a control column, S6–L2.7, S7–L3.0, and S10–L3.5 with longitudinal steel ratios of 2.0%, 2.7%, 3.0%, and 3.5%. In column S1–R, the entire section was under compression; but in columns S6–L2.7, S7–L3.0, and S10–L3.5 the ratios of compressed zone were 94%, 100%, and 100%, respectively. Columns S6–L2.7, S7–L3.0, and S10–L3.5 showed maximum compressive longitudinal concrete strains 1740, 2090, and 2600 micron at column mid height respectively. All columns in this group except column S6–L2.7 exhibited strains greater than maximum concrete compressive strain of column S1–R.
The effect of different longitudinal steel ratios on longitudinal steel strain at mid height is significant. Longitudinal steel strains in column S10–L3.5 turned from compression to tension and reached yield limits, while for columns S1–R, S6–L2.7, and S7–L3.0 the longitudinal steel strains were in compression and did not pass yield limits. Stirrups in all columns at mid height were subjected to tensile strain, but only column S10–L3.5 reached yield limit.
Specimens having greater longitudinal steel ratios as in specimens S6–L2.7, S7–L3.0, and S10–L3.5 revealed mid height deflection at ultimate load of 130%, 41% and 73%, respectively compared with reference column S1–R.
Columns S7–L3.0 and S10–L3 failed at load of 40%, 54% higher than reference column S1-R while column S6–L2.7 which has longitudinal steel greater than reference column failed at load 13% less because of lower stiffness of the used longitudinal steel bars Φ10 mm in this column. It can be concluded that using Φ10 mm steel bars are not effective in columns of high strength concrete. These observations revealed that longitudinal steel ratio is one of the most effective factors on the ultimate load of high strength columns.
Reference column S1–R, failed in a relatively brittle way with small deformation. In case of columns with greater longitudinal steel ratio, as in columns S7–L3.0 and S10–L3.5, they failed in a catastrophic brittle behavior when peak load is reached (sudden cover spalling, showing no tensile cracks, and small mid height displacement). Column S6–L2.7, failed with a premature buckling of the used Φ10 mm steel bars.
Effect of stirrups diameter (transverse steel ratio)
Group D (studying the effect of stirrup diameters) consists of control columns S1–R, S8–St8, and S9–St10 having stirrups diameters of Φ6, Φ8, and Φ10 mm. As stirrup diameters of columns increased, the depth of the compressed zone at mid height decreased. In column S1–R, the entire section is under compression; but in columns S8–St8 and S9–St10 the ratios of compressed zone to column depth are 100% and 97%, respectively.
Columns S8–St8 and S9–St10 had maximum concrete compressive strains of 3800, and 4000 micron greater than maximum concrete compressive strain for column S1–R. Longitudinal steel strains in all columns were in compression and did not reach yield limit. Stirrups in all columns at mid height were subjected to tensile strain, but none of them reached yield limit.
Specimens having greater stirrups diameter Φ8, and Φ10 mm as in specimens S8–St8 and S9–St10 showed mid height deflection at ultimate load of 230% and 142% respectively greater than column with small stirrup diameters Φ6 as in reference column S1–R.
Columns S8–St8 and S9–St10 failed at load greater than column S1–R with ratios of 12% and 33%. It can be concluded that increasing stirrup diameter is effective in enhancing HSC column capacity - this conclusion was stated by Erdem Canbay [Citation9] and others.
It was observed that column with small tie diameter, as reference column S1–R, failed at lower load in a brittle way with small deformation. In case of columns with greater tie diameter, as specimens S8–St8, S9–St10, they failed at higher load than reference column in a ductile manner with more tensile cracks and deformation when peak load is reached.
shows load mid-height displacements for columns. Concrete compressive strains and stirrup strains for all tested columns are shown in .The descriptions of tested column results are shown in .
Table 3 Test results for all tested columns in the experimental program.
Analytical study
Non-linear Finite element modeling of HSC using ANSYS11 [Citation14] is performed to simulate HSC elements using a three dimensional solid element, SOLID65. The steel plates which are placed between column and applied loads to avoid stress concentration are, modeled using SOLID45 element. The discrete model was used to represent steel bars by using 3D spar link8 element. Bond between concrete and steel is assessed by the number of shared nodes between steel bar elements (LINK8) and concrete elements (SOLID65). All columns are modeled considering the advantage of symmetry (only one-half of columns) across their entire length to reduce computational time with the applied boundary conditions. Failure load is defined as that load when solution criterion for any of force or displacement is not convergent. shows the used elements and the stress–strain curve for concrete.
Studied cases
Finite element analysis for nineteen HSC columns (ten tested square columns and nine rectangular columns with aspect ratio 2 is carried out by ANSYS11. The properties of the analyzed columns are shown in . Results are presented and a comparison between the square column results and the corresponding actual test results is conducted. Results of rectangular columns were used as an indication to check the effect of the studied parameters on HSC rectangular columns, then a proposed interaction diagram based on ACI 318-08 [Citation11] specifications was presented. The applicability of the interaction diagram is verified by comparing results with experimental results of the square columns.
Table 4 Properties of analyzed columns in the analytical parametric study.
Results of the analyzed columns
Results of tested square columns
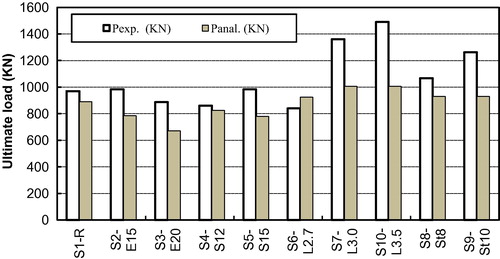
All columns showed analytically load capacities less than experimental ones, except column S6–L2.7, as analytical load capacity increased by 8% than the experimental result as shown in . This is due to the premature buckling of a relatively small longitudinal steel diameter Φ10 mm used in the compression side. As longitudinal steel ratio in the column increased, the difference between analytical and experimental results increased, this is revealed obviously in case of columns S7–L3.0 and S10–L3.5 which gave the lowest analytical estimation (74% and 68% of experimental load capacity), this refers to a greater stiffness provided from higher bar diameter.
Fig. 7.a Comparisons between columns load capacity from both experimental and analytical analyses.
Analytical results for mid height displacements at ultimate loads for all columns showed lower values than experimental ones, by 13–22% except for columns with higher longitudinal steel ratios S7–L3.0 and S10–L3.5. These two columns gave greater values of analytical mid height displacement than experimental ones, which can be explained, with the brittle behavior of these two columns as shown in . A comparison between analytical and experimental load mid-height displacements for the reference column S1-R, S2-E15 and S3-E20 showed close results up to 85% of ultimate loads as shown in .
Fig. 7.b Comparisons between columns maximum mid-height displacement from both experimental and analytical analyses.
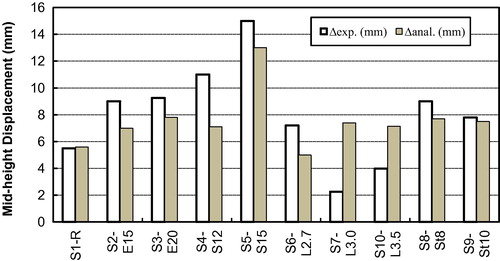
Fig. 8 Comparison between analytical and experimental mid height displacements.

Cracking patterns from analysis showed two types of cracks; the first type is horizontal flexural tension crack, which appears horizontally at column edges as small dashed lines. The second type is transverse vertical cracks, which appear as small circles represent transverse vertical tension cracks that resulted in crushing of concrete. The analytical simulation of crack propagation is in good agreement with experimental one as shown in . Analytical results of all tested square columns are listed in .
Table 5 Comparison between test and analytical results.
Results of rectangular columns
Analytical results for all rectangular columns are shown in , indicating the following;
Table 6 Results of rectangular columns from analytical simulation.
As load eccentricity (in longer dimension) increased, columns load capacity decreased by 25%. The same effect is shown in case of increasing slenderness ratio, which resulted in decrease in columns load capacity, by 13%, while in case for changing both longitudinal steel ratio or stirrups diameter a trivial increase in columns ultimate loads by 1.2% is observed.
Mid-height displacement at ultimate load for all analyzed rectangular columns showed that as eccentricity of loads increased, mid height displacement of columns increased by 31%, while in case of increasing longitudinal steel ratio mid height displacement remained almost constant. As stirrups diameter increased, columns mid height displacement increased by 3% as shown in . As stirrups diameter increased, mid-height displacements of columns increased.
Fig. 10 Load mid-height displacement for rectangular reference column & group A.
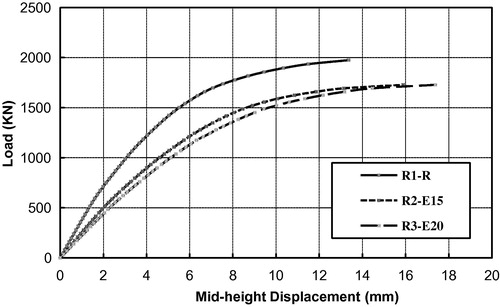
Cracking pattern for column R1–R showed no tensile cracks. Number of cracks at failure especially tension cracks have significant increase when increasing load eccentricity on columns, slenderness ratios of columns, longitudinal steel ratios, and stirrups diameter, which resulted in a more ductile behavior of these columns which assure the previously observed behaviors and modes of failure of tested square column as shown in .
Interaction diagram of studied columns
In order to determine column capacity (maximum load and moment) of high strength concrete columns, interaction diagram was drawn to obtain failure envelop of designed sections based on ACI 318-08 [Citation11]. Using experimental results (axial load & bending moment form applied eccentricity) considering (Po = f’c × Ag, Mo = f’c × b × t2. Where Ag = b × t, b, t is column dimensions). The resulted failure envelope was compared with experimental results to check applicability of that interaction diagram on high strength concrete sections subjected to axial load and bending moment. For the purpose of comparison, the ultimate capacity of the columns was calculated based on ECP 203-07 [Citation12] code.
Applicable Interaction diagrams shown in showed that they are valid and safe for all tested columns except in case of columns S4–S12, S5–S15, and S6–L2.7. This can be attributed to the additional moments resulted from the increased slenderness of columns S4–S12 and S5–S15. For column S6–L2.7, it suffered from premature buckling of its longitudinal bars in compression during test.
Fig. 11 Interaction diagram for some tested columns.
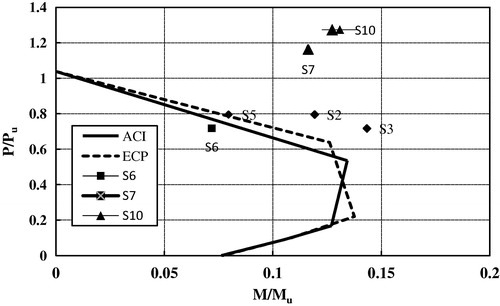
Columns S7–L3.0, S9–St10, and S10–L3.5 revealed higher load value than interaction diagram because of higher longitudinal steel ratios. lists the predicted load capacity calculated from both ACI 318-08 and ECP 203–07 codes compared to experimental results. It can be seen that results from ACI 318-08 interaction diagram are more conservative than results from ECP 203–07 code.
Table 7 Difference between experimental results and interaction diagram.
Conclusions
Based on the analysis of both experimental and analytical results for the studied columns under eccentric compression and within the range of the tested columns it can be conclude that:
| 1. | Increasing longitudinal steel ratio leads to increase of load capacity, but decreases ductility of column. As longitudinal steel ratio increased for tested column by 50% and 75% an increase in column load capacity by 40% and 54% occurred, but a decrease in mid height displacement by 59% and 27% respectively was noticed. | ||||
| 2. | Increasing the transverse steel volumetric ratio resulted in increase of load capacity, concrete compressive strain and mid height displacement at failure, column capacity increased by 12–33%, mid height displacement at failure increased by 131% and 42%. As using stirrups Φ8 and Φ10 mm instead of Φ6 mm, means an increase in transverse steel volumetric ratio by 80 and 175%, respectively. | ||||
| 3. | Using smaller longitudinal steel bar diameter (Φ10 mm) in HSC columns is not efficient. | ||||
| 4. | Increasing load eccentricity leads to decrease in column load capacity, but increase in both mid height displacement and concrete compressive strain. Increase in the load eccentricity by 50% and 100% leads to decrease in normalized load capacity by 7.5% and 16.6%, but increased mid height displacement by 63% and 89%, respectively. | ||||
| 5. | Increasing column slenderness ratio results in decrease in load capacity, but increase in both mid height displacement at failure and concrete compressive strain. In the limit of studied columns when increasing slenderness ratio from short column condition to slenderness ratio of 12 and 15 resulted in decrease in normalized load capacity by 11.3% and 9%, but increase in mid height displacement at ultimate load by 104% and 173%, respectively. | ||||
| 6. | Analytical simulations give very good prediction of experimental load capacity of HSC columns with average difference 16% from experimental ones, especially in case of moderate reinforced columns while for heavily reinforced column, analytical simulation gives relatively lower predictions of load capacity. | ||||
| 7. | Assessment of columns mid height displacement using analytical simulation agrees with experimental results with average difference of 17%. | ||||
| 8. | Column cracking patterns’ analytical simulations showed excellent agreement with experimental ones this indicate that analytical simulation can probably be used in assessment of the behavior of HSC columns with satisfying accuracy. | ||||
| 9. | Prediction of load and moment capacities, using interaction diagrams based on ACI 318-08 and ECP 203-07, is achieving relatively lower values with a reasonable safety factor to be used in designing of HSC columns under eccentric compression. In addition, for moderate reinforced HSC columns the ACI 318-08 gave conservative values. | ||||
Notes
Peer review under responsibility of Housing and Building National Research Center.
References
- ACI Committee 363State of the art report on high-strength concreteACI Struct. J.199755
- H.H.IbrahimJ.G.MacGregorModification of the ACI rectangular stress block for high-strength concreteACI Struct. J.9419974048
- M.P.CollinsD.MitchellJ.G.MacgregorStructural design considerations for high-strength concreteConcrete International1519932734
- A.M.TorkeyL.G.ShaabanDuctility of biaxially loaded high strength reinforced concrete columns, Faculty of Engineering, Cairo UniversityJ. Eng. Appl. Sci.482001655674
- M.GhoneimStrength of slender high-strength concrete columns under eccentric compression loads. Faculty of Engineering, Cairo universityJ. Eng. Appl. Sci.49200211571176
- J.G.MacGregorReinforced Concrete Mechanics and Design1992Prentice-Hall, Inc.Englewood Cliffs, NJ
- N.ALIoydB.V.RanganStudies on high-strength concrete columns under eccentric compressionACI Struct. J.931996631638
- D.CussonP.PaultreHigh-strength concrete columns confined by rectangular tiesJ. Struct. Eng. ASCE1201994783804
- ErdemCanbayGuneyOzcebeUgurErsoyHigh-strength concrete columns under eccentric loadJ. Struct. Eng.132200610521060
- K. Sungjoong, Behavior of high strength concrete columns (Ph.D. thesis), North Carolina State University, Raleigh, North Carolina, 2007.
- ACI Committee 318-08Building Code Requirements for Structural Concrete2007American Concrete InstituteFarmington Hills, Mich (p. 504)
- Egyptian Code of Practice for design and construction of R.C, Structures, ECP 203–2007.
- Hany A. Kottb, Behavior of High strength concrete columns under eccentric loads (Master thesis), Cairo University, Faculty of Engineering, Giza Egypt, 2011.
- ANSYS11ANSYS User’s Manual Revision 112011ANSYS, Inc.Canonsburg, Pennsylvania, US