
 ?Mathematical formulae have been encoded as MathML and are displayed in this HTML version using MathJax in order to improve their display. Uncheck the box to turn MathJax off. This feature requires Javascript. Click on a formula to zoom.
Abstract
Evaluation of the volume change behavior of expansive soils under controlled suction and boundary conditions is important for the proper design of different geotechnical systems. Osmotic technique was used by several researchers for suction controlled testing of expansive soil specimens. This technique involves circulating polyethylene glycol solution (PEG) over a semi-permeable membrane underlying a test specimen. Different suction controlled testing apparatuses incorporating osmotic techniques were developed included triaxial and oedometric testing conditions to simulate different boundary conditions. This paper describes a series of calibration performed on suction controlled modified oedometer and triaxial equipment used for testing expansive soil. The modified oedometer, developed by the authors, comprises of thin-wall oedometer ring instrumented with strain gauges to measure the lateral stresses evolving during the test. The first part of this paper introduces the errors that arise during osmotic suction testing, concerning the device flexibility and PEG solution losses. The second part of the paper highlights the calibration procedure for estimating lateral stresses in modified oedometer from instrumented strain gauges as well as introduces a correction for the temperature fluctuation. Finally, the effect of triaxial cell flexibility on the volume change measured during osmotic suction controlled testing as well as temperature effect on volume change measurements were evaluated and correction procedures were introduced.
Introduction
Suction control using osmotic technique is a common method used for studying the effect of suction on the behavior of unsaturated soils. Osmotic suction testing is typically used to apply suction in the range of (0–10) MPa [Citation1,Citation2]. Kassiff and Ben Shalom [Citation3] was the forerunner to apply the osmotic technique for controlling suction in geotechnical engineering. Various research groups over the world used, improved and adopted such technique to impose suction in oedometer, triaxial and direct shear testing [Citation4,Citation5,Citation1,Citation6–Citation[7]Citation8]. The osmotic suction technique was imposed on the top and bottom of test specimen by connecting the semi-permeable membrane to the top cap and the base of the device membrane behind which an aqueous solution of large sized polyethylene glycol (PEG) molecules is circulated. Several researchers have used osmotic suction control testing for the evaluation of swelling characteristics of expansive soils [Citation7,Citation2,Citation9,Citation10]. The authors are currently undergoing research to investigate the effect of suction on the swelling behavior, of a locally available expansive soil, in vertical and lateral directions. Motivation for this research stemmed from cases reported in the technical literature where lateral swelling is the main contributor to observed damages [Citation11,Citation12]. These tests are performed using suction controlled triaxial testing and thin-walled oedometer devices.
Polyethylene glycol solution (PEG) calibration is a mandatory task for osmotic control testing. This calibration provides a relationship between the PEG solution concentrations and imposed suction. Techniques and procedures for PEG calibration have been extensively discussed in the technical literature [Citation13,Citation1,Citation14], and is out of the scope of this paper. Depending on the device used (whether oedometer or triaxial), other calibrations may be needed to assess measurement errors. These errors need to be quantified and accounted for in experimental data to obtain accurate representation of soil behavior. In particular, this paper investigates the errors that may rise during expansive soil testing using osmotic suction controlled technique including axial deformation due to device flexibility and PEG solution losses due to evaporation and circulation. Furthermore, device specific calibrations needed for the proper interpretation of the volumetric behavior of expansive soils are presented.
Components of osmotic suction technique and devices used
The osmotic suction technique considered in this research, , comprised of polyethylene glycol solution (PEG) – with a molecular weight of 6000 (PEG 6000) – filled in a one liter conical flask, a semi-permeable membrane, flexible tubing, peristaltic pump for PEG circulation and an electronic balance for monitoring the change in weight of the PEG solution. The semipermeable membrane used was Spectra/Por® 3 regenerated cellulose dialysis membrane with a molecular weight cut off (MWCO) value of 3500 Daltons that is compatible with the molecular weight of PEG used (MW = 6000).
Fig. 1 Schematic layout of osmotic suction system.
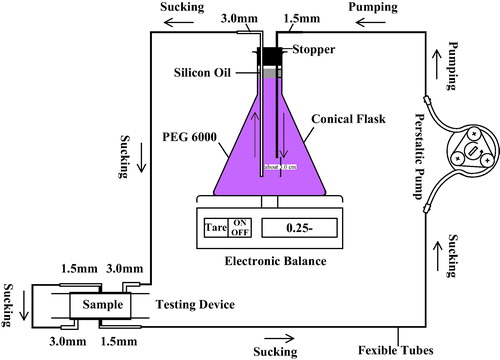
PEG solution is circulated in a closed loop with all connections well sealed to prevent probable leaks. Moreover, the surface of the PEG is sealed by a thick layer (10 mm) of light silicon oil to prevent potential evaporation of the PEG. The position of PEG surface was maintained in the flask neck to reduce the solution surface area exposed to evaporation. The flask neck was plugged with a stopper with three holes. Two glass tubes with inside diameter of 1.50 and 3.00 mm were fitted in two of these holes. The 1.50 mm tube is used to allow the flow of PEG from the peristaltic pump to the flask, while the 3.00 mm tube is used to transfer the flow from the flask to the tested specimen. The third hole was used to maintain atmospheric pressure on the top surface of the PEG solution.
The peristaltic pump was installed and rotated in a manner that permit PEG solution to be pulled, rather than pushed, under the membranes in the testing device, see . The solution was sucked from the centric hole of the lower part of testing device and enters to testing device from the outer hole of its upper part, . PEG returns back to the flask by pumping through the 1.5 mm glass tube. Pulling the solution from the device lower part, which is connected to the upper part, leads to circulate PEG solution on both sides of tested sample by sucking the solution from the outlet glass tube (3.0 mm). The lower level of the outlet tube (3.0 mm) was positioned to be lower than that of the inlet tube (1.5 mm) by 30.0 mm to keep sucking fresh solution and avoid sucking any air bubbles. It is aforementioned that PEG circulation by sucking reduces the possibility of air bubble formation and cancels the possibility of PEG leakage along the membrane edges.
During suction application, PEG solution is circulated behind the semipermeable membrane in contact with a specimen causing water to be extracted or added to the sample to attain a specific matric suction. This will result in change in PEG flask weight. At suction equilibrium, the recorded weight of the PEG flask remains unchanged. This indicates that suction equilibrium has been reached in the whole specimen and change in weight can be used to evaluate the change in specimen’s water content.
The above described osmotic system is connected to the loading apparatuses used as described in next sections. The experimental devices include two thin-walled oedometer cells and two triaxial devices.
Thin-walled oedometer
Two thin-walled oedometer cells (TW1 and TW2) were used in current study. Both cells have the same design which is similar in principle to that developed by Ofer [Citation15]. provides a schematic diagram showing the components of the thin-walled oedometer cell used in current study. The cell comprised of a copper ring with a reduced wall thickness of 1.5 mm (). The ring was instrumented with four strain gauges adhered every 90° on the outer surface of the ring’s circumference. Readings of all strain gauges were recorded by a portable data logger (TDS-303). The instrumented thin-walled ring provided an indirect method for the measurement of lateral stresses during expansive soil testing. Lateral strains measured during the test were transformed to lateral stresses via appropriate calibration factor – discussed later – thus enabling the evaluation of specimen’s stress path during the test. Lateral (circumferential) strains, εc, were evaluated using the following equation:(1)
(1) where r is the ring radius and ∂r is the change in ring radius.
Fig. 2 Schematic diagram showing the components of the osmotic suction control oedometer cell.
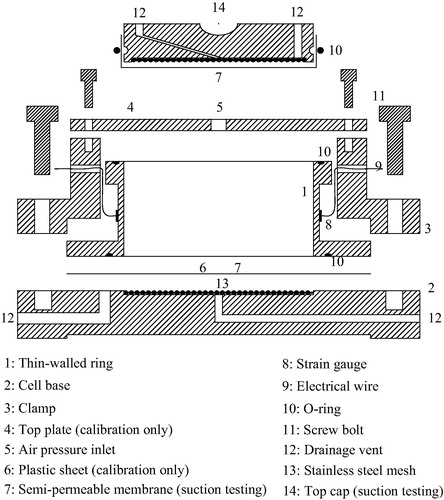
The PEG solution was circulated around the specimen ends within small recesses (1.0 mm deep) formed in the faces of top cap and the cell base. The recesses were covered with stainless steel meshes (opening 0.60 mm) and sealed with semi-permeable membranes. Two (double) sheets of semi-permeable membranes were used to minimize the risk of PEG leakage due to semi-permeable membrane puncture or membrane degradation. Concentric groves were machined in both cell base and top cap (of 1.5 mm deep and 3.0 mm thick) to facilitate the circulation of PEG solution over the entire surface area of the specimen. This setup is believed to improve the circulation of PEG solution and to minimize testing time.
Triaxial devices
During current research, two devices (TRX1 and TRX2) have been used in order to accelerate testing progress. These two devices have the same system of a single cell stress path triaxial device. Cell and back pressures were applied using computer controlled pressure volume controllers (PVC). The cell pressure PVC was used in volume change measurements of test specimens and can measure volume of cell water egress or ingress in the order of 1.0 mm3 while axial deformation was measured using a linear variable differential transformer (LVDT) connected to the loading ram.
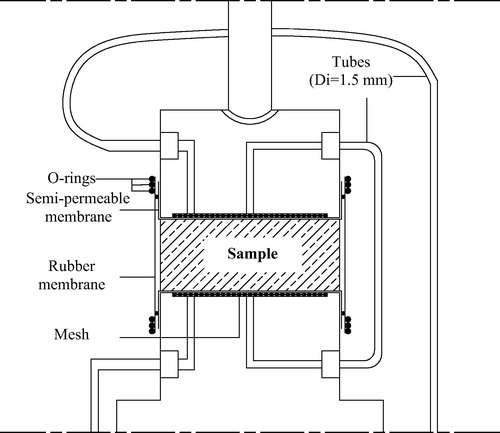
Similar to the thin-walled oedometer device, suction controlled testing using osmotic technique was used in the triaxial device by circulating PEG solution through modified cell base and top cap with stainless steel mesh and semi-permeable membrane as shown in .
Fig. 3 Specimen setup for the osmotic suction control triaxial.
Axial deformations due to device flexibility
Correction for device flexibility is stipulated in ASTM D 2435-04 [Citation16] and ASTM D 4767 [Citation17]. These standards mention that measured axial deformations must be corrected for apparatus flexibility in all tests especially when filter paper disks are used. The standards also suggest that calibration to be performed following the exact loading and unloading schedule to be used due to the inelastic deformation characteristics of filter paper. During data reduction, this correction should be applied to the recorded deformation.
In current experimental setup, the filter paper was replaced by a semi-permeable membrane supported by wire mesh (stainless steel or woven). Monroy [Citation8] identified several bedding errors associated with osmotic technique. These errors included the deformation of the semi-permeable membrane and woven mesh as well as indentation of mesh into semi-permeable membrane and soil sample. Monroy [Citation8] stated that these errors were hard to quantify and depended on soil stiffness which, in turn, was a function of soil’s degree of hydration. Furthermore, Monroy [Citation8] and Monroy et al. [Citation9] stated that these effects were minimal and no correction was applied to their test results. From the authors’ point of view, these errors depend not only on soil stiffness but also on the membrane stiffness which in turn affects the amount of penetration besides its compressibility.
Calibration procedure of tested device involved assembling the cell using a stainless steel disk of dimensions similar to tested samples but with a diameter 1 mm less than the thin-walled ring. Double semi-permeable membrane (OM) and stainless steel mesh were placed on top and bottom of the stainless steel disk. The device was then loaded and unloaded in accordance with the loading sequence expected during the test. For the sake of comparison, identical calibration tests were performed to assess the compressibility of filter paper (FP) used in conventional testing. For these tests, filter paper and porous stone disk were used in lieu of the semi-permeable membranes and steel meshes.
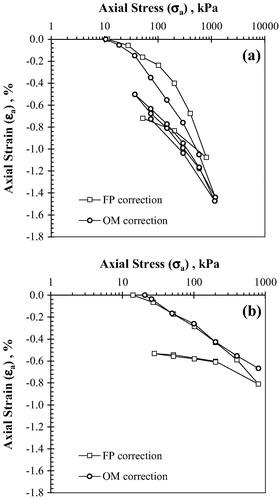
shows the axial strains – with respect to a sample height of 16.1 mm – emerged during calibration of thin-walled oedometer cells (TW1 and TW2) having filter paper and double semi-permeable membrane configurations. From , it is observed that the oedometer flexibility correction in case of using double membranes is higher than that in case of using filter paper. Furthermore, both filter paper and membrane experienced inelastic strain behavior. This highlights the importance of following loading and unloading sequence scheduled for testing. Similarly, calibration results of triaxial devices (TRX1 and TRX2) are depicted in . Based on calibration results shown in , corrections due to device flexibility can be applied to experimental data.
Fig. 4 Axial deformations correction due to device flexibility (a) TW1 and (b) TW2.
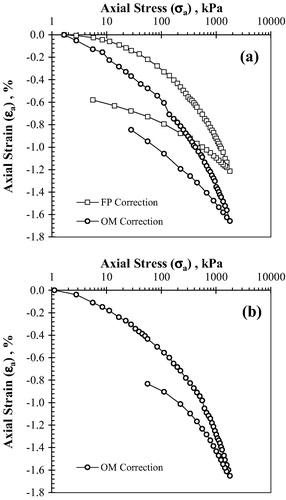
Fig. 5 Calibration of device flexibility for testing systems (a) TRX1 and (b) TRX2.
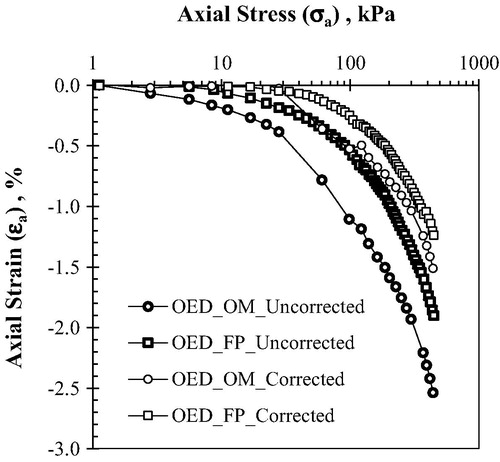
Reconstituted samples of Al-Qatif expansive clay were used in this study. Details of physical properties of tested soil were provided in [Citation18]. illustrates the uncorrected and corrected axial strain for oedometer samples investigated – at the same conditions – under conventional and suction controlled testing. From , it is apparent that even after corrections have been applied, variation exists between both FP corrected and OM corrected loading curves. This can be attributed to indentation of mesh into the soil.
Fig. 6 Uncorrected and corrected vertical strains for TW1 flexibility.
Correction for PEG solution losses
The amount of water ingoing or outgoing the sample during suction control testing is considered important data for the evaluation of sample’s water content. This will help in the determination of soil water retention curve (SWRC). To measure accurately the change in sample water, it is essential to measure precisely the change in weight of the PEG solution, which can be obtained by weighing the solution flask. With the configuration shown in , the evaporation and circulation losses, which may cause error in weighing, have been minimized. PEG solution losses have been monitored using a balance with 0.01 g precision for about 7 days and it was deemed of negligible effect.
Calibration of thin-walled oedometer cells
Lateral strain calibration
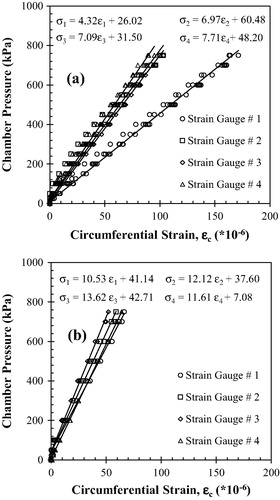
As stated earlier, lateral strains recorded using thin-walled ring instrumented with strain gauges were transformed to lateral stresses via a calibration curve. To this end, a procedure for the thin-wall ring was devised to estimate relationship between lateral strains observed and developed lateral stresses. The thin-walled ring was encased between a solid upper plate from the top and a thick plastic sheet from the bottom creating a sealed compartment as shown in . The upper plate has an inlet port for admittance of pressurized air into the compartment. Air pressure was incrementally increased and the strains developed corresponding to each air pressure increment were recorded. Several cycles of air pressure loading and unloading were performed to ensure the reliability and the repeatability of calibration results. Variation of recorded lateral strains with air pressures applied is presented in . Based on , the slope of the linear relationship between lateral strains and pressure (i.e., lateral stress) can be used as a calibration factor for each strain gauge. From , it is apparent that the calibration factor is nearly equal for three strain gauges with one having a different value (strain gauge #1). Close examination of strain gauges revealed that strain gauge #1 was installed on the lower third of the ring in contrary to other strain gauges which were installed at the ring mid-height. This indicates the significance of strain gauge location on the calibration and test results.
Fig. 7 Calibration of lateral strain gauges relating to applied pressures (a) TW1 and (b) TW2.
Temperature correction for lateral strains
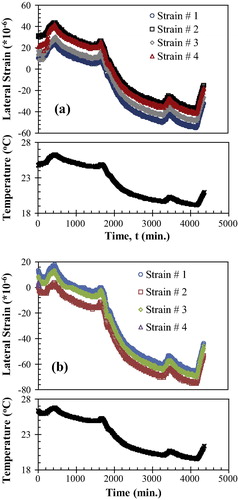
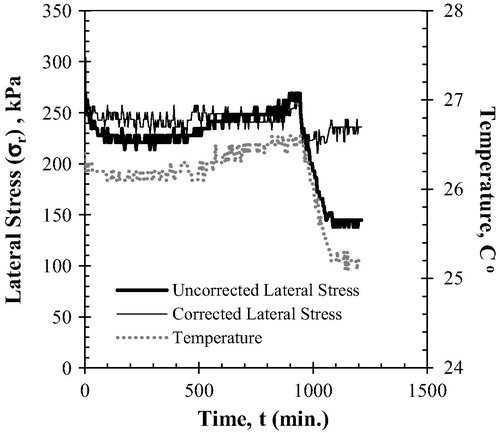
The ambient temperature was observed to have a significant effect on the lateral strain readings and, consequently, on estimated lateral stresses. shows the variation of the lateral strains recorded. From , it is observed that the lateral strain readings vary in tandem with ambient temperature changes. As such, calibration is required to evaluate lateral strain correction factor due to temperature changes. The proposed calibration procedure involved fully assembling the oedometer cell without sample and simultaneously record lateral strain and temperature for an extended time period of 3 days. Temperature readings were recorded using a thermo-couple type K temperature sensor mounted on the oedometer body. All strain gauges and temperature readings were recorded using a data logger. Based on results of calibration, the coefficient of circumferential thermal expansion, αc, of the copper thin-walled ring was estimated to be 11 ∗ 10−6/°C. Hence, corrected lateral strains were computed using the following equation;(2)
(2) where
Fig. 8 Variation of lateral strain gauges readings with temperature (a) TW1 and (b) TW2 cells.
εcc = Lateral strain corrected for temperature variation at time i,
εcu = Lateral strain uncorrected for temperature variation at time i,
Ti = Temperature reading at time i,
Tr = Temperature reading at a reference time,
εru = Lateral strain uncorrected for temperature variation at start of loading,
εrc = Lateral strain corrected for temperature variation at start of loading.
Using Eq. (Equation2(2)
(2) ), raw data of lateral strain measurement developed during sample testing were corrected for temperature variation. shows the uncorrected and corrected lateral stresses.
Fig. 9 Correction of lateral stresses during sample testing due to temperature variation.
Calibration of triaxial cells
One common technique used in measuring volume change of unsaturated specimens in triaxial cells involves recording the ingress or egress of water from the cell. Nevertheless, there are number of factors that may affect the overall accuracy of the volume change measurement using this technique. Ng et al. [Citation19] attributed errors in volume change measurements to three components: (i) “immediate” volume change due to the expansion–contraction of the cell wall, connecting tubes and cell water caused by the change in cell pressure; (ii) volume change variation due to temperature fluctuation; and (iii) increase in volume change with time due to the cell and membranes creep. These components are referred to as apparent volume change, AVC [Citation19]. At this point, it is worth noting that the last two components are considered time-dependent components.
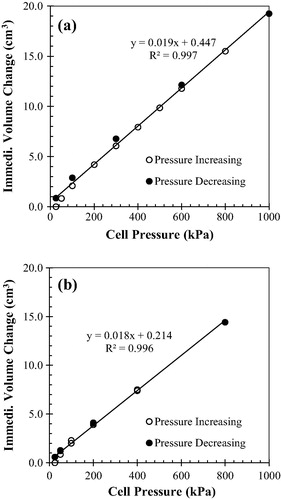
To quantify and develop correction factors for different error components, a series of calibrations were performed. All triaxial equipment calibrations were performed using a stainless steel dummy sample placed between the triaxial platens to discard volume changes due to sample volume change. The first series of calibration tests involved applying two cycles of cell pressure similar to loading and unloading sequence followed during the test. For each pressure increment or decrement, the target pressure was applied in two minutes ramp and sustained for one day. The immediate volume change relationship with respect to applied pressure is shown in . From , it was observed that there is a linear relation between the immediate apparent volume change and the applied pressure for pressures above 50 kPa. The immediate volumetric strain error with respect to applying cell pressure can be estimated to be in order of 0.0136%/kPa for a sample with dimensions 30 mm in height and 75 mm in diameter. Moreover, the calibration data were repeatable and there is a slight difference between the loading and unloading relations. This relationship can be used to adjust volume change measurements for immediate volume change recorded during the test.
Fig. 10 Immediate volume change for uncontrolled testing systems (a) TRX1 and (b) TRX2.
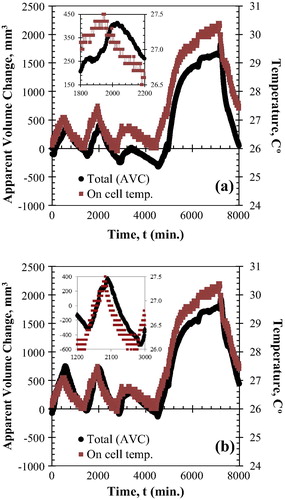
To evaluate time-dependent AVC due to temperature (only temperature variation was considered given the required long monitoring duration for assessment of creep correction for each applied stress), a second series of test was performed in which cell pressure was applied and maintained for about one week. During this period, cell volume change measurements and ambient temperature using a thermocouple-type K temperature sensor mounted on the triaxial cell exterior were recorded.
Variation of “on cell” temperature and AVC with time was recorded as shown in . From , it is observed that on cell temperature and AVC follow similar trends; however, with an 80 min response delay for volume change to “on cell” temperature (see insert in ). The volume change variation with respect to temperature can be estimated to be in order of 345 mm3/°C which is equivalent to volumetric strain rate of 0.26%/°C for a sample with dimensions 30 mm in height and 75 mm in diameter.
Fig. 11 Time-dependent volume change for uncontrolled testing systems (a) TRX1 and (b) TRX2.
Conclusion
The purpose of this paper was to present the calibration procedures that should be taken in account during suction controlled testing of expansive soils using osmotic suction technique. Calibration procedures related to osmotic suction technique and devices used were discussed.
The study highlighted the importance of correcting the axial deformation due to device flexibility and semi-permeable membrane compressibility to obtain reliable estimation of the stiffness parameters. The correction of PEG losses has been estimated and was believed to be minimal according to the proposed configuration.
Calibration procedure for estimating lateral stresses from lateral strain gauges instrumented in thin-walled oedometer has been demonstrated. Moreover, correcting equation for temperature variation effect on the lateral strain readings has been presented. Given the magnitude of the temperature correction, it would be good to emphasize the importance of testing in a controlled temperature environment. Finally, corrections for the apparent volume change components have been depicted.
Conflict of interest
The authors declare that there are no conflict of interests.
Acknowledgments
The project was financially supported by King Saud University, Vice Deanship of Research Chairs.
Notes
Peer review under responsibility of Housing and Building National Research Center.
References
- P.DelageM.D.HowatY.J.CuiThe relationship between suction and the swelling properties in a heavily compacted swelling clayEng. Geol. J.5019983148
- O.CuisinierF.MasrouriHydromechanical behaviour of a compacted swelling soil over a wide suction rangeJ. Eng. Geol.8132005204212
- G.KassifA.Ben ShalomExperimental relationship between swell pressure and suctionGéotechnique211971245255
- P. Delage, G.P.R. Suraj De Silva, E. De Laure, Un nouvel appareil triaxial pour les sols non saturés, in: 9e Europe Conference of Soil Mechanics and Foundation Engineering, Dublin, vol. 1, 1987, pp. 26–28.
- P. Delage, G.P.R. Suraj De Silva, T. Vicol, Suction controlled testing of non-saturated soils with an osmotic consolidometer, in: 7th International Conference on Expansive Soils, Dallas, vol. 2; 1992, pp. 206–211.
- K. Dineen, J.B. Burland, A new approach to osmotically controlled oedometer testing, in: Proceedings of the 1st Conference on Unsaturated Soils Unsat’95, Paris, Balkema, vol. 2, 1995, pp. 459–465.
- O.CuisinierF.MasrouriTesting the hydromechanical behavior of a compacted swelling soilGeotech. Test. J.276200419
- R. Monroy, The Influence of Load and Suction Changes on the Volumetric Behaviour of Compacted London Clay, PhD Thesis 2006, University of London.
- R. Monroy, L. Zdravkovic, A. Ridley, Volumetric behaviour of compacted London Clay during wetting and loading, in: Proceedings of the 1st European Conference, E-UNSAT 2008, Durham, United Kingdom, 2008, pp. 315–320.
- H.NowamoozM.MradA.AbdallahF.MasrouriExperimental and numerical studies of the hydromechanical behaviour of a natural unsaturated swelling soilCan. Geotech. J.4642009393410
- R.P. Joshi, R.K. Katti, Lateral pressure development under surcharges, in: Proceedings of the 5th International Conference on Expansive Soils, Adelaide, South Africa, 1984, pp. 227–241.
- F.H. Chen, D. Huang, Lateral expansion pressure on-basement walls, in: Proceedings of the 6th International Conference Expansive Soils, New Delhi; vol. 1, 1987, pp. 55–59.
- J.WilliamsC.F.ShaykewichAn evaluation of poly-ethylene glycol PEG 6000 and PEG 20000 in the osmotic control of soil water matrix potentialCan. J. Soil Sci.10261969394398
- A.M.TangY.J.CuiL.X.QianP.DelageW.M.YeCalibration of the osmotic technique of controlling suction with respect to temperature using a miniature tensiometerCan. Geotech. J.4732010359365
- Z.OferInstruments for laboratory and in-situ measurement of the lateral swelling pressure of expansive claysProceedings of the 4th International Conference on Expansive Soils1980ASCENew York4553
- ASTM D 2435-04. Standard Test Methods for One-dimensional Consolidation Properties of Soils Using Incremental Loading. West Conshohocken, PA.
- ASTM D 4767. Standard Test Methods for Consolidated Un-drained Triaxial Compression Test for Cohesive Soils. West Conshohocken, PA.
- M.F.AbbasT.Y.ElkadyM.A.Al-ShamraniMulti-dimensional swelling behavior of Al-Qatif expansive soilsAdvances in Unsaturated Soils2013Taylor and Francis group279284
- C.W.W.NgL.T.ZhanY.J.CuiA new simple system for measuring volume changes in unsaturated soilsCan. Geotech. J.3922002757764