
 ?Mathematical formulae have been encoded as MathML and are displayed in this HTML version using MathJax in order to improve their display. Uncheck the box to turn MathJax off. This feature requires Javascript. Click on a formula to zoom.
Abstract
Nanocrystalline meta-zinc titanate (ZnTiO3) ceramic was prepared using a self-propagating solution combustion synthesis (SCS) for the first time using urea as fuel. The product was calcined at 800 °C for 2 h to improve the crystallinity. Powder X-ray diffraction (PXRD), Fourier transform infrared spectroscopy (FTIR), scanning electron microscopy (SEM), energy-dispersive X-ray spectroscopy (EDAX), high resolution transmission electron microscopy (HR-TEM) and UV–vis absorption spectroscopy were used to characterize the final product. PXRD results show that the ilmenite type rhombohedral structure was formed when the sample was calcined at 800 °C for 2 h. Adsorption experiments were performed with cationic malachite green (MG) dye. ∼96% dye was adsorbed onto nanocrystalline ZnTiO3 ceramic at pH 9 for 30 min of the contact time. The optimum adsorbent dose was found to be 0.45 g/L of dye. Langmuir–Hinshelwood model was used to study adsorption kinetics and first order kinetic model best describes the MG adsorption on ZnTiO3. Antibacterial activity was investigated against gram negative Klebsiella aerogenes, Pseudomonas desmolyticum, Escherichia coli, and gram positive Staphylococcus aureus bacteria by agar well diffusion method. Nanocrystalline ZnTiO3 ceramic showed significant effect on all the four bacterial strains at the concentration of 1000 and 1500 μg per well.
1 Introduction
With increasing revolution in science and technology, there was a bigger demand on opting for newer chemicals which could be used in various industrial processes. Among many new chemicals, organic dyes came up as one of the most widely used chemical stuff which could be used in many industrial activities. Therefore, dyes have become integral part of all industrial effluents. Unprocessed textile effluents are highly poisonous in nature as they contain a large number of organic and inorganic dyes. The bigger environmental responsiveness is for effective treatment of industrial effluent [Citation1]. The colouring pigments such as anthraquinone or azo groups present in the anionic, cationic or non-ionic dyes, which have complex chemical structure are very difficult to degrade at normal condition [Citation2]. Recently greater attention has been committed to the study of removal of dyes and pigments from industrial effluents and waste water by adsorption process using nanostructured materials [Citation3]. Usually organic and inorganic dyes are removed by different chemical and physical techniques, such as chemical reaction, electro-coagulation, reverse osmosis, adsorption, flocculation, electro-floatation, ion exchange, membrane filtration, electrochemical destruction, precipitation and many others [Citation4]. Among all these techniques, adsorption technique has been found to be superior to other techniques for waste water treatment in terms of initial cost, simplicity of design, ease of operation and insensitivity to toxic substances [Citation5].
Malachite green (MG) is a synthetic dye which is commonly used for dyeing of cotton, silk, paper, and leather industries, in manufacturing of paints and printing inks, and as a food colouring agent, food additive, and medical disinfectant. However, despite its use, MG is hazardous because of its adverse effects on the immune and reproductive systems, carcinogenic, genotoxic, mutagenic and teratogenic properties [Citation6,Citation7]. For these reasons the United States and the European Council have imposed a strict ban on the use of MG in all categories of food. In addition to this, discharge of MG into the hydrosphere can cause severe ecological imbalance as it gives undesirable colour to water and reduces sunlight penetration that harms aquatic life. Therefore, it is important to remove MG from aqueous effluents before they are discharged into bodies of water.
In the past few years zinc-titanium based oxide materials (Zn–Ti–O) have been used widely because of their outstanding properties and potential scientific and technical applications [Citation8]. Recently, zinc titanates have been investigated for application in many fields such as regenerable sorbents for high-temperature hydrogen sulfide (H2S) removal from coal gasifier gas [Citation9,Citation10], gas sensors [Citation11], humidity sensors [Citation12], paint pigments [Citation13], dielectric materials [Citation14,Citation15], antibacterial agents [Citation16] and as photocatalysts [Citation17,Citation18]. It is reported by various authors that there are three compounds existing in the ZnO–TiO2, including cubic inverse-spinel type zinc ortho-titanate (Zn2TiO4), rhombohedral ilmenite type zinc meta-titanate (ZnTiO3) and cubic spinel type structured Zn2Ti3O8 which is considered as low-temperature form of ZnTiO3 [Citation19,Citation20]. Among all these, nanosized crystalline ZnTiO3 is a highly significant material which has been used as adsorbent for the dyes.
Even though many new antibiotics have been developed in the last few decades, none of them have been found with better activity against multidrug-resistant bacteria. It is therefore essential to plan better healing strategies including novel antibiotics. Recently metal oxide nanoparticles have been effectively used for the delivery of therapeutic agents, in chronic disease diagnostics, to reduce bacterial infections in skin and burn wounds, to prevent bacterial colonization on medical devices and in the food and clothing industries as an antimicrobial agent. Because of their unique mode of action and potent antimicrobial activity against gram positive and gram negative bacteria's, the prospectus for developing new generation antibiotics makes metal oxide nanoparticles as an attractive substitute to antibiotics to overcome the drug resistance problem [Citation21]. ZnO and TiO2 nanoparticles show antibacterial properties, but there is no satisfactory literature relating to the antibacterial behaviour of nanocrystalline ZnTiO3 ceramic. This attracts our attention to prepare nanocrystalline ZnTiO3 and to study its antibacterial properties. In this study we present the preparation and characterization of ilmenite type nanocrystalline ZnTiO3 ceramic and studied its effectiveness in the adsorption of hazardous MG dye. We also evaluated the antibacterial activity against different pathogenic bacteria's by agar well diffusion method.
2 Experimental
2.1 Materials
Commercially pure zinc nitrate hexahydrate (Zn(NO3)2·6H2O, AR 99%, Merck), tetra-n-butyl titanate (Ti(OC2H9)4, AR 99%, Aldrich), urea (CO(NH2)2, AR 99%, Merck), 1:1 nitric acid (HNO3, Fisher Scientific), hydrochloric acid (HCl, Fisher Scientific), sodium hydroxide (NaOH, Fisher Scientific), MG dye (C23H26ON2, Sigma–Aldrich), nutrient agar media and Ciprofloxacin (Hi Media, Mumbai, India) were used as such without further purification.
2.2 Preparation of nanocrystalline ZnTiO3 ceramic
Solution combustion synthesis (SCS) was used for the first time to prepare nanocrystalline ZnTiO3 ceramic. There are no satisfactory literatures available to prepare nanocrystalline ZnTiO3 in SCS; we succeeded in producing ZnTiO3 ceramic material in the nanoscale without any secondary phases. In this method, the reaction mixture was calculated based on the total oxidizing and reducing valances of the oxidizer and fuel required to release the maximum energy for the reaction [Citation22,Citation23]. ZnTiO3 ceramic was prepared in two simple steps:
| (a) | Preparation of titanyl nitrate Titanyl nitrate solution was prepared by controlled hydrolysis of tetra-n-butyl titanate with distilled water; further reaction of formed titanyl hydroxide with 1:1 HNO3 gives titanyl nitrate. The following reactions take place during the formation. | ||||
| (b) | Combustion process The titanyl nitrate was dissolved in minimum quantity water and the stoichiometric quantities of Zn(NO3)2, and CO(NH2)2 were mixed in the double distilled water and stirred well using a magnetic stirrer for about 30 min. The crystalline dish containing the above solution was introduced into preheated muffle furnace maintained at 500 ± 10 °C. The solution was boiled and resulted in a highly viscous liquid. This viscous liquid catches fire and auto ignited with flames on the surface, which rapidly proceeded throughout the entire volume forming a white powdered product. The overall reaction can be written as | ||||
2.3 Preparation of malachite green dye solution
An accurately weighed amount of the MG dye was dissolved in distilled water to prepare stock solution (10 mg/l). Experimental solutions of desired concentration were obtained by successive dilutions.
3 Characterization techniques
SCS derived product was characterized by PXRD. Powder X-ray diffraction patterns were collected on a Shimadzu XRD-700 X-ray diffractometer with CuKα radiation with diffraction angle range 2θ = 20–80°, operating at 40 kV and 30 mA. Product was morphologically characterized by HR-TEM analysis which was performed on a Hitachi H-8100 (accelerating voltage up to 200 kV, LaB6 Filament). FE-SEM was performed on a ZEISS scanning electron microscope equipped with EDS with a voltage of 5 kV. Malvin zeta profiler was used to study the surface morphology with Z range 25 μm, step size 0.124 μm, field view 474 μm × 356 μm. The FT-IR studies have been performed on a Perkin Elmer Spectrometer (Spectrum 1000) with KBr pellet technique in the range of 400–4000 cm−1. To calculate optical energy band gap, UV–vis spectrum was recorded using Elico SL-159 UV-Vis spectrophotometer. Kemi centrifuge was used to separate dye solution from adsorbent.
4 Results and discussion
4.1 PXRD studies
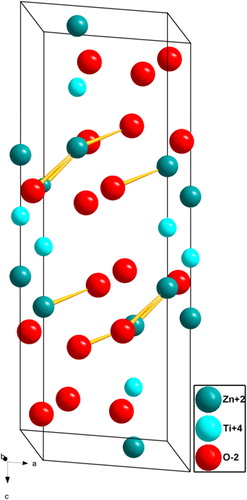
The formation of nanocrystalline phase of prepared sample was confirmed by PXRD measurements. The PXRD results were analyzed with crystallographica search match. The PXRD of as-formed sample and the sample calcined at 600 °C for 2 h show the amorphous nature of product (). Whereas the sample calcined at 700 °C for 2 h confirms the crystallinity of the sample with ilmenite type ZnTiO3 and secondary phases like inverse-spinel type cubic Zn2TiO4 (ICDD card number 25-1164) and rutile TiO2 (ICDD card number 65-192) [Citation24]. Whereas in the PXRD of the sample calcined to 800 °C for 2 h, the secondary phases were not observed and all the peaks are in good agreement with the ICDD card number 26-1500 with a space group R−3 (No-148) and cell parameters a = b = 5.078 Å, c = 13.927 Å. All the diffraction peaks can be indexed to (1 0 1), (1 0 2), (1 0 4), (1 1 0), (1 1 3), (0 2 4), (1 1 6), (0 1 8), (2 1 4), (3 0 0), (2 0 8), (1 1 9), (2 1 7) and (2 2 0) reflections. The broadening of the reflections clearly indicates the inherent nature of nanocrystals. The crystal structure of the nanocrystalline ZnTiO3 ceramic obtained using powder cell software is shown in . The crystallite size is calculated from the full width at half maximum (FWHM (β)) of the diffraction peaks using Debye–Scherer's method [Citation25] using the following equation:(4)
(4) where ‘d’ is the average crystalline dimension perpendicular to the reflecting phases, ‘λ’ is the X-ray wavelength, ‘k’ is Scherer's constant (0.92), ‘β’ is the full width at half maximum (FWHM) intensity of a Bragg reflection excluding instrumental broadening and ‘θ’ is the Bragg's angle. The calculated average crystallite size of the sample is found to be 16 nm. The lattice and the structural parameters of the nanocrystalline ZnTiO3 ceramic are summarized in .
Table 1 Crystal parameters of the nanocrystalline ZnTiO3 ceramic.
Fig. 1 PXRD patterns of nanocrystalline ZnTiO3 ceramic.
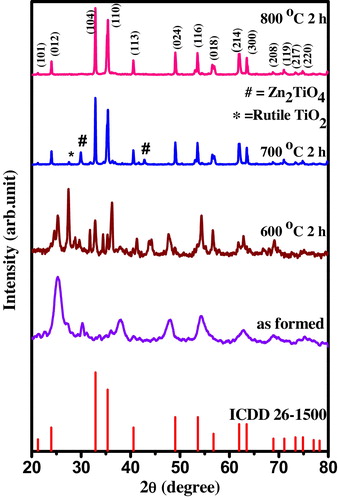
Fig. 2 Packing diagram of nanocrystalline ZnTiO3 ceramic.
4.2 FT-IR spectroscopic studies
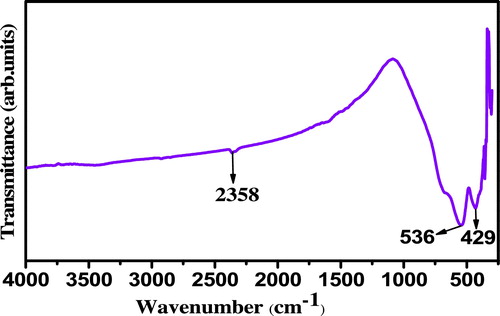
represents FT-IR spectrum of the sample recorded to define the vibrational frequency of metal–oxygen and other bonds related to impurities present in the nanocrystalline ZnTiO3 calcined at 800 °C for 2 h. It can be seen that no major impurity peaks corresponding to the organic impurities was observed. However, a weak band can be seen at 2358 cm−1 which is ascribed to the stretching vibration of the C–H band of butyl group in n-butyl titanate. Strong absorption bands at 536 cm−1 and 429 cm−1 can be assigned to the stretching vibration of M–O bonds (M = Zn, Ti) [Citation26].
Fig. 3 FTIR spectrum of nanocrystalline ZnTiO3 ceramic.
4.3 UV–vis spectroscopy studies
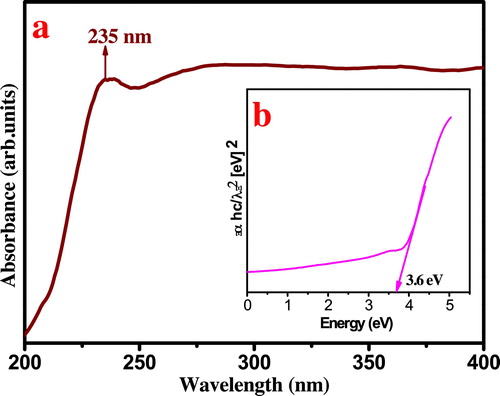
In order to determine the optical energy band gap of sample, the UV–vis absorption spectrum was recorded. The sample shows a strong absorption peak (λmax) at 235 nm at the UV region. (a) shows the UV–vis absorption spectrum of sample calcinated at 800 °C for 2 h. This can be attributed to photo excitation of electron from valence band to conduction band. The optical energy band gap (Eg) was estimated ((b)) by the method proposed by Wood and Tauc [Citation27] according to the following equation:(5)
(5) where ‘α’ is the absorbance, ‘h’ is the Planck constant, ‘ν’ is the frequency, ‘Eg’ is the optical energy band gap and ‘n’ is a constant associated to the different types of electronic transitions (n = 1/2, 2, 3/2 or 3 for direct allowed, indirect allowed, direct forbidden and indirect forbidden transitions, respectively). Eg value for ZnTiO3 ceramic is ∼3.6 eV which is well agreement with the literature.
Fig. 4 (a) UV–vis spectrum and (b) optical energy band gap of nanocrystalline ZnTiO3 ceramic.
4.4 Morphological analysis
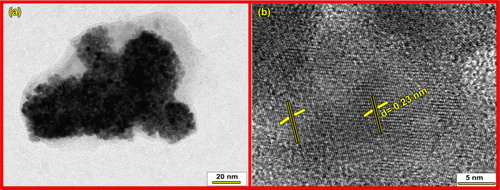
(a) and (b) shows FE-SEM images of nanocrystalline ZnTiO3 ceramic calcined at 800 °C for 2 h. Micrographs reveals that the particles are nearly spherical in shape, has uniform size and distribution. The particles are highly agglomerated due to sintering of particles during calcination. Energy dispersive spectroscopy was used to analyze the chemical composition of the prepared ZnTiO3 ceramic. No elements other than Zn, Ti and O are seen using energy dispersive spectroscopy ((c)). Furthermore, Zn:Ti:O is in the atomic ratio 19:19:61, which is very close to the expected composition. TEM image of ZnTiO3 ceramic ((a)) shows that the particles obtained are in nanoregime and has average particle size ∼10 nm. HR-TEM image ((b)) shows that the ZnTiO3 ceramic is highly crystalline with lattice spacing of 0.23 nm. These results are well matched with the results obtained by Debye–Scherer's method.
Fig. 5 (a and b) FE-SEM and (c) EDS micrographs of nanocrystalline ZnTiO3 ceramic.
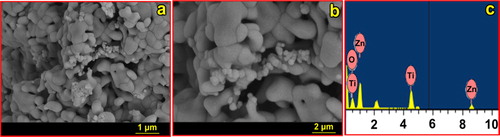
Fig. 6 (a) TEM and (b) HR-TEM of nanocrystalline ZnTiO3 ceramic.
4.5 Surface profile
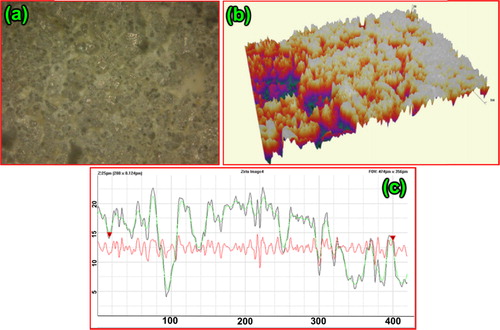
The surface profile was examined based on the optical interferometry measurements. The 2D, 3D and line graph of surface profile were as shown in (a)–(c). Roughness average (Ra), RMS roughness average (Rq), maximum profile height (Rpv), maximum peak height (Rp), maximum valley depth (Rv), symmetry of the profile around the mean (Rsk), maximum roughness depth/height parameter (Rz) and the randomness of the height (Rku) were tabulated in . The mean and standard deviation values of Rsk and Rku confirm the nanoscale surface morphology of the prepared sample. The 2D, 3D and line graph of surface profile images confirms the presence of agglomerated grains with their uniformity and connectivity through the grain boundaries. Muhammad Awais et al. studied dye adsorption studies of NOx and in their studies they found that more the surface roughness higher is the dye adsorption behaviour [Citation28].
Table 2 Surface profile of nanocrystalline ZnTiO3 ceramic.
Fig. 7 (a) 2D, (b) 3D and (c) line graph of surface profile of nanocrystalline ZnTiO3 ceramic.
5 Adsorption studies
Adsorption experiments were performed using organic hazardous cationic MG dye. MG is a basic triphenylmethane dye with a molecular weight 327. IUPAC name of MG is [4-[(4-dimethylaminophenyl)-phenylmethylidene]-1-cyclohexa-2,5-dienylidene] dimethylazanium with molecular formula C23H25N2+. MG has a high solubility in acidic organic solvents but less in water [Citation29]. Chemical structure and UV–vis spectrum of malachite green dye are shown in .
Fig. 8 (a) Chemical structure of MG. (b) UV–vis spectrum of MG.
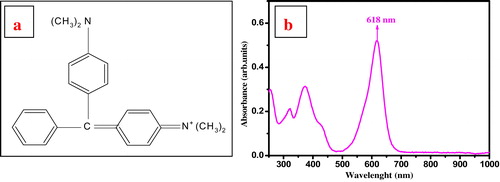
Batch experiments were carried out at different times, dose, pH, and initial concentration of dye. 100 ml of dye solution of concentration (5 ppm, 7.5 ppm and 10 ppm) was mixed with different dose (5–65 mg) of adsorbent in 250 ml beaker at lab temperature. The dye solution containing adsorbent was stirred magnetically (in absence of light) to increase the contact between the dye solution and the adsorbent. After desired time the adsorbent was separated from the solution by centrifugation at 1800 rpm for 5 min. Residual concentration of dye in supernatant was estimated spectrophotometrically by monitoring the absorbance at 618 nm (λmax).
5.1 Effect of contact time
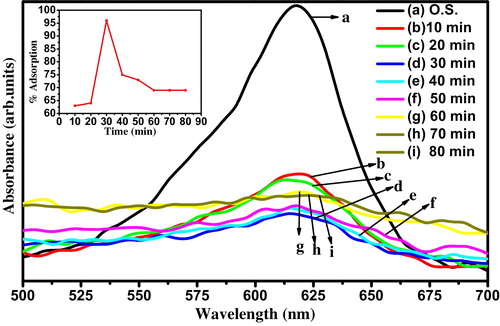
Effect of contact time on the adsorption of MG onto nanocrystalline ZnTiO3 ceramic was studied. It can be observed from that the dye adsorption increases with the increasing of stirring time of 30 min. The rate of adsorption is initially quite rapid with most of the compound being adsorbed within the first 30 min. It was found that more than 96% adsorption of dye occurred in the first 30 min; thereafter the rate of adsorption was found to be slow. This shows that equilibrium can be assumed to be achieved after 30 min. It is basically due to saturation of the active site which does not allow further adsorption to take place [Citation30].
Fig. 9 Effect of contact time on adsorption of MG. (Inset) % degradation plot.
5.2 Effect of dose of adsorbent
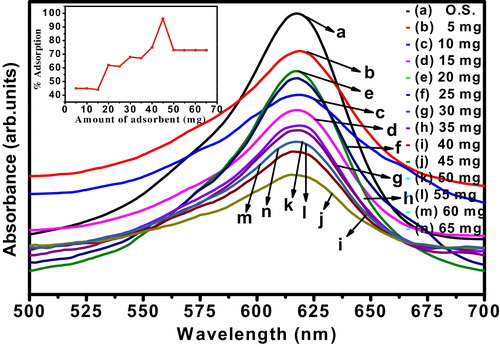
Adsorption of dye is strongly influenced by the quantity of the adsorbent. Adsorption of MG onto nanocrystalline ZnTiO3 ceramic was studied with changing the amount of adsorbent from 5 mg/L to 65 mg/L at a constant stirring rate of 30 min with optimum dye concentration of 10 ppm. It is observed from that with increase in the dose, adsorption of MG increases up to optimum quantity of adsorbent. Maximum of 96% dye adsorbed at the dose of 45 mg of adsorbent. Further increase in adsorbent dose, decreases the adsorption percentage. This might be attributed to over-lapping or aggregation of adsorption sites resulting in decrease in total adsorbent surface area available to MG and increase in path length [Citation31].
Fig. 10 Effect of dose of adsorbent on adsorption of MG. (Inset) % degradation plot.
5.3 Effect of pH
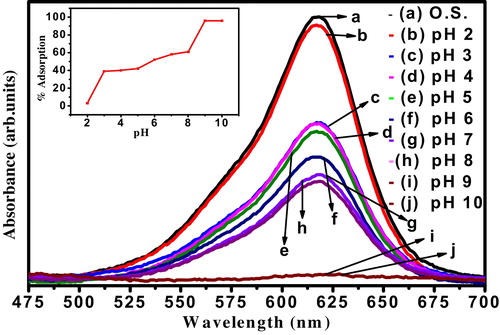
The pH of system has a great effect on the adsorption efficiency of organic dyes. Effect pH on MG adsorption onto the nanocrystalline ZnTiO3 ceramic was carried out at 10 ppm of initial dye concentration with 45 mg mass of adsorbent at 30 min of stirring rate at lab temperature. As given in , nanocrystalline ZnTiO3 show maximum of 96% dye adsorption at the pH of 9 which decreased to 3% at pH of 2. This confirms that the low pH (2–5) was unfavourable for MG adsorption by nanocrystalline ZnTiO3 ceramic.
Fig. 11 Effect of pH on adsorption of MG. (Inset) % degradation plot.
5.4 Effect of initial concentration
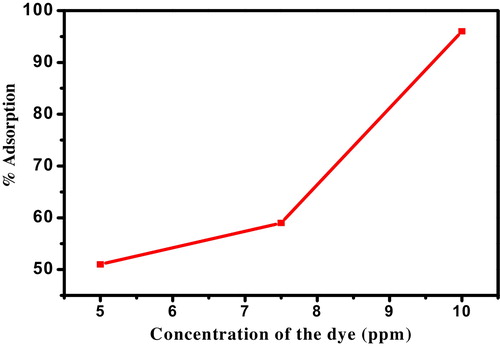
The initial concentration of dye is also another parameter which needs to be taken into account. It is very interesting to note that the percentage of adsorption for 5 ppm dye solution was very low since the availability of dye molecules to the adsorbent was poor. With increasing the concentration of dye to 7.5 ppm, percentage of adsorption slightly increases further for 10 ppm of MG concentration, and percentage of adsorption onto nanocrystalline ZnTiO3 ceramic was found to be high (96%). This experimental result clearly explains that availability of dye molecules to interact with the adsorbent should be in the optimum range. As the initial dye concentration increased from 5 ppm to 7.5 ppm, 7.5 ppm to 10 ppm, the adsorption of MG onto the nanocrystalline ZnTiO3 ceramic is indicating that the initial concentration provided a powerful driving force to overcome the mass transfer resistance between the aqueous and solid phases. shows the effect of initial concentration of the dye.
Fig. 12 Effect of initial concentration of dye.
5.5 Mechanism of adsorption of MG onto nanocrystalline ZnTiO3 ceramic
Mechanism of adsorption of MG onto the nanocrystalline ZnTiO3 ceramic can be explained on the basis of pH effect [Citation32]. Under acidic conditions, it is difficult for cationic MG dye to adsorb onto the nanocrystalline ZnTiO3 surface. This is because, as initial pH of dye solution decreased, the number of negatively charged adsorbent sites decreased and positively charged sites increased which did not favour the adsorption since the MG is a cationic dye resulting in electrostatic repulsion. This decrease in the adsorption at lower pH is also due to the fact that the presence of excess H+ released from the MG dye at acidic condition which opposing with dye cations for the adsorption. In turn at higher pH the negatively charged sites on adsorbent molecule increase which attracts the positively charged sites of cationic MG dye resulting in high adsorption. The proposed scheme of interaction of nanocrystalline ZnTiO3 with MG is as shown below.
5.6 Efficiency of reused adsorbent
The ZnTiO3 used in the treatment was centrifuged, and desorption of pollutant was done using chemical leaching method. HCl (0.1 N) was used to desorb the pollutant (malachite green) from ZnTiO3 adsorbent and dried at 120 °C in a hot oven before it was reused for the succeeding adsorption experiments. However, the results obtained for regenerated adsorbent were not so significant and the ZnTiO3 shows poor adsorption efficiency after first use. So, it cannot be recycled and reused further as adsorbent for malachite green in aqueous solution.
5.7 Adsorption kinetics
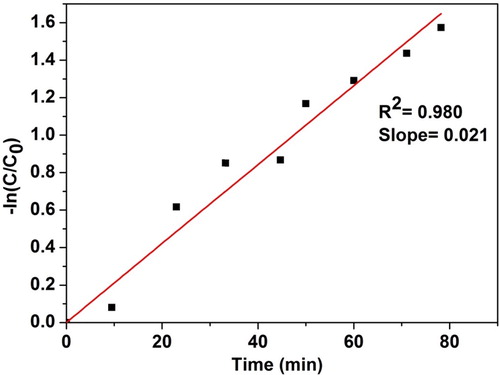
In order to find out the potential rate controlling steps involved in the process of adsorption, adsorption kinetics were established. Langmuir–Hinshelwood model expressed in Eq. Equation(7)(7)
(7) was applied to understand the adsorption kinetics quantitatively. This model has been used to calculate the rate constant of adsorption experiments [Citation33].
(6)
(6) where ‘r’ is the adsorption rate, ‘kr’ is the adsorption rate constant, ‘K’ is the absorption coefficient of the reactant, and ‘C’ is the reactant concentration. When C is very small, Eq. Equation(6)
(6)
(6) can be expressed by Eq. Equation(7)
(7)
(7) .
(7)
(7) where ‘k’ is the first-order rate constant. Set t = 0, C = C0, Eq. Equation(8)
(8)
(8) can be induced.
(8)
(8) shows the adsorption rate of nanocrystalline ZnTiO3 under room temperature. It is clear that the kinetic simulation curve with stirring time (t) as abscissa and ln(C0/C) as the vertical ordinate is close to a linear curve with the fitting constant ‘R’ greater than 0.96. It is observed that nanocrystalline ZnTiO3 exhibits good adsorption activity (k = 0.021 min−1).
Fig. 13 Adsorption kinetics of MG adsorption over ZnTiO3.
6 Antibacterial studies
Antibacterial activity was screened by agar well diffusion method [Citation34] against four bacterial strains gram negative Klebsiella aerogenes NCIM-2098, Pseudomonas desmolyticum NCIM-2028, Escherichia coli NCIM-5051, and gram positive bacteria Staphylococcus aureus NCIM-5022. The Muller hinton agar was used to culture bacteria. Nutrient agar plates were prepared and swabbed using sterile L-shaped glass rod with 100 μl of 24 h mature broth culture of individual bacterial strains. The wells were made by using sterile cork borer (6 mm) and were created into the each petri-plate. Varied concentrations of nanocrystalline ZnTiO3 (1000 and 1500 μg/well) were used to assess the activity. Compound was dispersed in sterile water and it was used as a negative control and simultaneously the standard antibiotic Ciprofloxacin (5 μg/50 μl) (Hi Media, Mumbai, India) as positive control was tested against the bacterial pathogens. Then the plates were incubated at 37 °C for 24–36 h, the zone of inhibition was measured in millimetre of the every well and also the values were noted. Triplicates were maintained in every concentration and also the average values were calculated for the ultimate antibacterial activity.
6.1 Results of antibacterial studies
The antibacterial properties of the nanocrystalline ZnTiO3 ceramic were evaluated against gram negative K. aerogenes, E. coli, P. desmolyticum, and gram positive S. aureus bacteria using agar well diffusion method. In this method the nanocrystalline ZnTiO3 showed significant antibacterial activity on all bacterial strains with 1000 and 1500 μg concentration. The zone of inhibition is given in and data is given in .
Table 3 Antibacterial activity of nanocrystalline ZnTiO3 ceramic on pathogenic bacterial strains.
Fig. 14 Zone of inhibition tests for nanocrystalline ZnTiO3 against (a) K. aerogenes, (b) E. coli, (c) S. aureus and (d) P. desmolyticum.
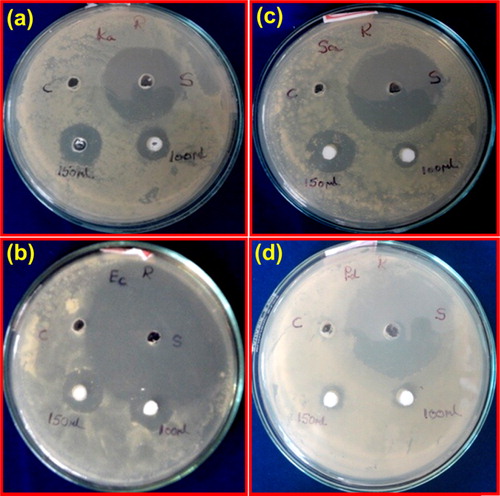
The observed antibacterial activity of the prepared nanocrystalline ZnTiO3 may be due to the presence of both ZnO and TiO2 in the prepared compound. The following factor may be responsible for antibacterial activity viz., (i) the improved colloidal aqueous stability of composite nanoparticles from the combination of ZnO with TiO2, (ii) the ionic size of nanocrystalline ZnTiO3 and (iii) reactive oxygen species (ROS) formation [Citation35]. The antibacterial effect of this nanocrystalline ZnTiO3 seems to be administered by the presence of ionic and colossal structural patterns which is in good agreement with the pharmacophore. The presence of these helps the compounds to interact or penetrate more with cell membrane of the bacteria's and thereby inactivating them. This may be due to the distance between the positively charged groups and the nanoparticles. Another widely postulated mechanism is that of the “self-promoted uptake” [Citation36] of the antibiotic across the outer membranes of bacteria which consist of lipopolysaccharide surface. This suggests that the nanoparticles interact with the charged outer membrane and subsequent channel formation in the cytoplasmic membrane via either “Barrel-Stave” or “Carpet” mechanism [Citation37,Citation38] resulting in cell death.
7 Conclusion
Nanocrystalline ilmenite type ZnTiO3 ceramic was successfully prepared by the simple SCS method and its adsorption capacity for MG dye was investigated. The result showed that the parameters such as effect of pH and contact time will play a very important role on the adsorption. Adsorption kinetics results show that adsorption of MG over ZnTiO3 follows first order kinetics. Antibacterial activity of the nanocrystalline ZnTiO3 was evaluated with four different bacterial pathogens. Results of antibacterial tests conclude that at higher concentration (1000 and 1500 μg), nanocrystalline ZnTiO3 can act as an excellent antibacterial agent against gram negative K. aerogenes, E. coli, P. desmolyticum and gram positive S. aureus bacteria in agar well diffusion method.
Acknowledgements
The authors R.S. Raveendra and Dr. P.A. Prashanth thank the Principal and management of Sai Vidya Institute of Technology for their constant encouragement and Mr. Nagabhushana Patel of IISc, Bangalore for their valuable help.
Notes
Peer review under responsibility of The Ceramic Society of Japan and the Korean Ceramic Society.
References
- S.D.KhattriM.K.SinghJ. Hazard. Mater.167200910891094
- J.Z.KongA.D.LiH.F.ZhaiH.LiQ.Y.YanJ.MaD.WuJ. Hazard. Mater.1712009918923
- J.Q.WangY.H.LiuM.W.ChenD.V.Louzguine-LuzginA.InoueJ.H.PerepezkoSci. Rep.22012
- M.GeC.GuoX.ZhuL.MaZ.HanW.HuY.WangFront. Environ. Sci. Eng. China32009271280
- L.K.LudwigR.BereiterE.MullerR.KrebsR.GalliW.J.StarkEnviron. Sci. Technol.42200858285833
- S.A.CardenasS.L.CortezM.C.MazonJ.C.M.GutierrezAppl. Surf. Sci.28020137478
- H.R.RajabiO.KhaniM.ShamsipurV.VatanpourJ. Hazard. Mater.2502013370378
- D.SunX.YanJ.ChenS.YuL.HuQ.XueChem. Eng. Commun.13201139053909
- T.J.LeeW.T.KwonW.C.ChangJ.C.KimKorean J. Chem. Eng.141997513518
- J.A.PostonInd. Eng. Chem. Res.351996875882
- B.C.YadavA.YadavS.SinghK.SinghSens. Actuators B: Chem.1772013605611
- N.K.PandeyK.TiwariA.RoyBull. Mater. Sci.352012347352
- V.H.AgehMohseniT.W.ScharfSurf. Coat. Technol.2372013241247
- S.K.ManikS.K.PradhanPhysica E: Low Dimen. Syst. Nanostruct.3320066976
- Y.L.HuangD.C.TsaiY.C.LeeD.R.JungF.S.ShieuSurf. Coat. Technol.2312013153156
- A.StoyanovaH.HitkovaA.B.NedelchevaR.IordanovaN.IvanovaM.SredkovaDigest J. Nanomater. Biostruct.72012777784
- Y.WangP.H.YuanC.M.FanY.WangG.Y.DingY.-F.WangCeram. Int.38201241734180
- T.SurendarS.KumarV.ShankerPhys. Chem. Chem. Phys.162014728735
- F.H.DullnD.E.RaseJ. Am. Ceram. Soc.431960125131
- N.T.NolanM.K.SeeryS.C.PillaiChem. Mater.23201114961504
- S.MohantyS.MishraP.JenaB.JacobB.SarkarA.SonawaneNanomed. Nanotechnol. Biol. Med.82012916924
- K.C.PatilS.T.ArunaT.MimaniCurr. Opin. Solid State Mater. Sci.62002507512
- R.S.RaveendraP.A.PrashanthB.D.PrasadS.C.NayakaG.P.SureshaB.M.NagabhushanaH.NagabhushanaN.P.BhagyaInt. J. Sci. Res.12013543547
- X.LiuMater. Lett.8020126971
- H.P.KlugL.AlexanderX-ray Diffraction Procedure1954WileyNew York
- Y.L.ChaiY.S.ChangG.J.ChenY.-J.HsiaoMater. Res. Bull.43200810661073
- J.TaucF.AbelesOptical Properties of Solids1970North-HollandAmsterdam
- M.AwaisM.RahmanJ.M.Don Mac ElroyN.CoburnD.DiniJ.G.VosD.P.DowlingSurf. Coat. Technol.204201027292736
- N.HidayahF.A.BakarN.A.MahyudinS.FaridahM.S.Nur-AzuraM.Z.ZamanInt. Food Res. J.20201315111519
- M.H.BaekC.O.IjagbemiD.S.KimJ. Hazard. Mater.1762010820828
- V.K.GargM.AmitaR.KumarR.GuptaDyes Pigments632004243250
- E.AkarA.AltinisikY.SekiEcol. Eng.5220131927
- X.WangY.LinX.DingJ.JiangJ. Alloys Compd.509201165856588
- C.PerezM.PaulP.BazerqueActa Bio. Med. Exp.151990113115
- H.U.SimonA.H.YehiaF.Levi-SchafferApoptosis52000415418
- M.R.YeamanN.Y.YountPharmacol. Rev.5520032755
- Y.ShaiBiochim. Biophys. Acta146219995570
- M.ZasloffNature4152002389395