
 ?Mathematical formulae have been encoded as MathML and are displayed in this HTML version using MathJax in order to improve their display. Uncheck the box to turn MathJax off. This feature requires Javascript. Click on a formula to zoom.
Abstract
Plasma sprayed ceramic coatings are successfully used in many industrial applications, where high wear and corrosion resistance with thermal insulation are required. The alumina powders were plasma sprayed on AZ31B magnesium alloy with three different plasma spraying parameters. In the present work, the influence of plasma spray parameters on the corrosion behavior of the coatings was investigated. The corrosion behavior of the coated samples was evaluated by immersion corrosion test in 3.5 wt% NaCl solution. Empirical relationship was established to predict the corrosion rate of plasma sprayed alumina coatings by incorporating process parameters. The experiments were conducted based on a three factor, five-level, central composite rotatable design matrix. The developed relationship can be effectively used to predict the corrosion rate of alumina coatings at 95% confidence level. The results indicate that the input power has the greatest influence on corrosion rate, followed by stand-off distance and powder feed rate.
1 Introduction
Magnesium alloys are the lightest of all metals used as the basis for constructional alloys. Lightness, high strength-to-weight ratio and its demonstrated versatility make this material a great choice for application in aerospace, transportation and in civil and military applications [Citation1,Citation2]. However, several drawbacks restrict the application of unprotected magnesium alloys, especially their low wear and corrosion behavior. The use of coatings is one of the most effective strategies to protect these light alloys against corrosion and wear.
Ceramic coating, for example, has shown its ability to be used where corrosion and wear co-exist. As far as anticorrosion and antiwear applications are concerned, the most frequently used coating materials are oxide ceramic coatings [Citation3]. Among the oxide materials, aluminum oxide, Al2O3, which is more often referred as alumina, is an exceptionally important ceramic material which has many technological applications. Alumina ceramic can retain up to 90% of their strength even at 1100 °C. Because of the excellent properties of alumina ceramics, they are widely used in many refractory materials, grinding media, cutting tools, high temperature bearings, a wide variety of mechanical parts, and critical components in chemical process environments, where materials are subjected to aggressive chemical attack, increasingly higher temperatures and pressures [Citation4]. It is reported that the corrosion resistance of alumina coatings is higher than that of cermet and metallic coatings [Citation5]. Thermally sprayed Al2O3 is widely employed to protect components against sliding, abrasive and erosive wear in a number of applications including rolls, pump bodies and plungers, industrial machinery parts (such as packaging and food processing equipment), etc. [Citation6]. Alumina (Al2O3) is the most widely established coating material, and these coatings have been used for many applications in textile, electronic, aerospace, and aircraft industries because of their dielectric and wear resistance properties [Citation7]. Alumina coatings could be prepared by techniques such as chemical vapor deposition (CVD), physical vapor deposition (PVD), sol–gel, plasma electrolytic oxidation (PEO) and plasma spray [Citation8]. Among these techniques, plasma spraying is one of the most popular methods because it does not cause deterioration of the substrate, and by using this, comparatively thick coatings can be formed at a low cost and high deposition rate. Since the 1960s atmospheric plasma spraying (APS) has been widely used in industry and found applications in many fields such as automotive, aeronautical, medical, and paper milling [Citation9]. As a result of the spraying process, ceramic coatings usually have open porosity and incomplete bonding between lamellae, which are deleterious when the coatings have to perform in an aggressive environment. The porosity allows a path for electrolytes from the outer surface to the substrate [Citation10]. Therefore, reduction of porosity of the sprayed coatings plays a key role in improving the corrosion resistance of the coatings.
Celik et al. [Citation11] studied the effect of grit blasting of substrate on the corrosion behavior of plasma-sprayed Al2O3 coatings. The results of their investigation showed that the corrosion resistance of the alumina coatings increased with decreasing porosity and coating thickness. Aruna et al. [Citation12] reported that out of the three coatings prepared at different critical plasma spray parameters (CPSP), the coating deposited with a moderate CPSP exhibited the maximum wear and corrosion resistance, moderate microhardness and <10% spallation with 700 thermal cycles. Zhongshan et al. [Citation13] used a heat treatment to aluminum arc sprayed coatings to improve the behavior of AZ31 alloy immersed in 3.5% NaCl. Chiu et al. [Citation14] used hot pressing and anodizing as post-treatment of the thermally sprayed coating to improve its protection effectiveness against corrosion. Arrabal et al. [Citation15] and Carboneras et al. [Citation16] used oxy-acetylene flame spraying to deposit Al/SiCp coating on different magnesium alloys and a cold pressing post-treatment to reduce the porosity values of the coating.
All the above literature focused on the corrosion behavior of thermal sprayed coatings. To the best of our knowledge, there is no information available on the role of spraying parameters such as power, stand-off distance, and powder feed rate on the corrosion behavior of plasma sprayed ceramic coatings on magnesium alloy in open literature. Hence, the present investigation was carried out to develop an empirical relationship to predict the corrosion rate of plasma sprayed alumina coatings. The effect of input power, stand-off distance and powder feed rate on corrosion behavior of alumina coating is reported in this paper.
2 Methodology
2.1 Finding the working limits of the parameters
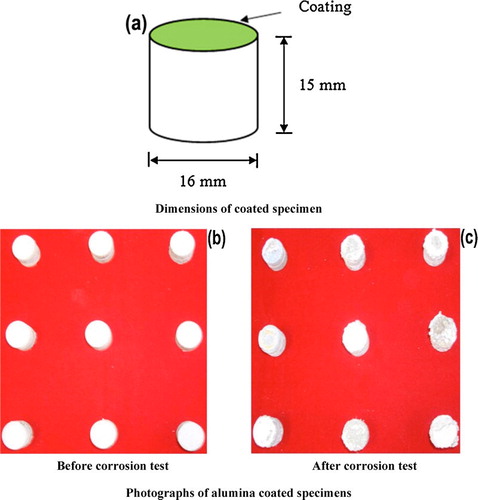
The chemical compositions of the AZ31B alloy used in this study are as follows (in wt%): Al 3.0, Zn 0.1, Mn 0.2 and Mg balance. The dimensions of the coated specimen are shown in a. Plasma spraying of the alumina powder was carried out using an in-house system. Details about this system are reported elsewhere [Citation10,Citation17]. Coating thickness for all the deposits was maintained at 200 ± 15 μm. This was achieved using the following method. The values of the factors were set in the machine as prescribed by a run in the design matrix, after which one single layer was made. The gun traverse rate was constant for all experiments; it was 300 mm s−1, and the coating track overlap was 30%. The thickness of the single layer made after the run was measured using a digital micrometer (Model DIGIMATIC MDC-25SB). The number of passes required to achieve 200 μm thickness was determined, and the spray run was carried out to achieve it. The microstructure of the coatings for fixing the working range of parameters is presented in .
Table 1 Microstructure observation for fixing the working range of parameters.
Fig. 1 Experimental details.
2.2 Developing the design matrix
With a view to study the effects of the considered process parameters on the corrosion rate, statistically designed experiments, based on a factorial technique, were used to reduce the cost and time and to obtain the required information pertaining to the main and the interaction effects of the parameters on the response. presents the ranges of factors considered, and shows the 20 sets of coded conditions used to form the design matrix.
Table 2 Important APS process parameters and their levels.
Table 3 Design matrix and experimental results.
2.3 Conducting the experiments
The porosity analysis was carried out using an optical microscope equipped with an image analysing system (Make: MEIJI, Japan; Model: MIL-7100) [Citation18]. Customary metallographic procedures were adopted to polish the cross-section of the coatings. A 200 μm square area was selected on the polished cross section of the coating, and the image was analyzed. The same procedure was repeated at five random locations to find out the average percentage volume of porosity. It was explained in .
Fig. 2 Measure the porosity level using computer image analyzing software.
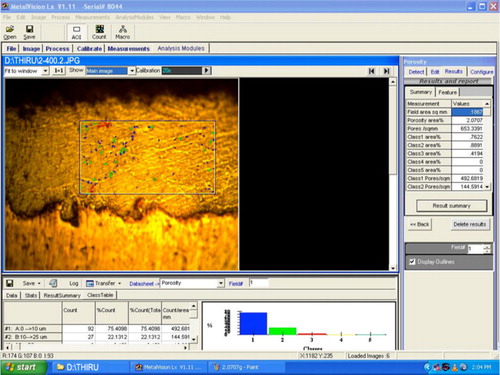
The porosity analysis results of coatings produced are summarized in . In the case of APS coatings, porosity can be inter-lamellar or intra lamellar. Inter-lamellae pores mostly form from the random build-up of splats and the volume change during solidification results in intra lamellae pores [Citation19]. Further, several possible sources of porosity in a coating have also been identified including: curling up of splats due to thermal stresses; incomplete filling of interstices during deposition; presence of unmelted particles in the spray; satellite droplets formed by splat break-up at the time of impact; overshooting of liquid over solidified splats during droplet spreading; entrapment of gas between splats and the presence of an oxide layer on the spray particles. Precursor powder can also be trapped by the molten splats. It should be noted that not all powder particles are fully molten when they land on the substrate. Some of them may be molten droplets without enough kinetic energy to form splats. These droplets re-solidify and get attached to the substrate by landing over the solidifying splats [Citation20]. All of the trapped and attached spherical particles are integrated into the coating after being covered by subsequent deposits. In this investigation, different types of pores () were observed in the coatings. Pore size and pores are classified from 0 to 10 μm as type A and designated as A02, A04, A06 and A08. Pores classification in the range from 10 to 25 μm as type B and designated as B02, B04, B06 and B08. Type A pores may be formed as a result of interaction between material particles and the gaseous medium. The type A pores are formed owing to placement in a layer of particles which are either liquid or rehardened in the plasma jet, containing within them gas bubbles which remain in place when the granule is deposited. As a result, voids can be localized in the material of a size generally commensurate with large micropores. Otherwise, these types of pores may be caused by gas dissolution from the liquid material being deposited. The type B pores are caused by the splashing of particles on impact with deposited material; or it may be due to voids resulting from the poor deformation of partially melted particles. These pores can have different sizes and exceedingly intricate shapes [Citation21]. Moreover, results show that coating consists of type A and type B pores and distributed as A08 and B08 forms which are evidence of the characteristics of plasma-sprayed coating. The microstructure of plasma-sprayed alumina coatings may be altered with change in plasma spray conditions. It can be explained by changes in total porosity, shape/size of the inter-splat pores and unmelted particles.
Table 4 Results summary of porosity analysis.
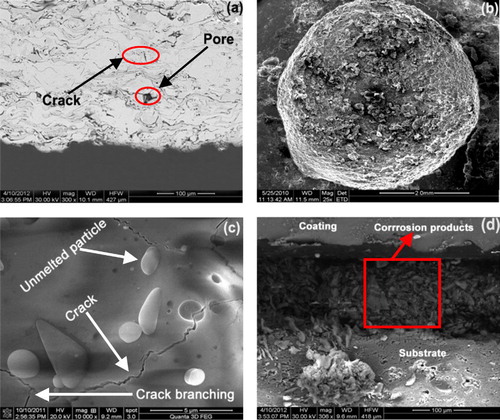
The presence of pores, cracks, and localized compositional variations could degrade corrosion resistance [Citation22]. The pores and microcracks would be preferential corrosion initiation sites when exposed to the electrolyte. Chloride ions penetrated into the pores and microcracks easily and promoted localized corrosion, such as pitting. With the progress of corrosion, the pores and microcracks joined together and formed macrocracks and finally led to the removal of loosened platelets of the coating ().
Fig. 3 (a) SEM image of alumina coating, (b and c) high magnification images of pore and crack and (d) cross-section of the alumina coated specimen after immersion in NaCl solution.
The corrosion behavior of the coatings was evaluated by conducting immersion corrosion test in a 3.5% NaCl solution with a constant pH value of 7 and exposure time of 6 h. For each experimental condition two coated specimens were prepared and tested. b and c presents the corrosion test samples. The specimens were ground with 500#, 800#, 1200#, and 1500# grit SiC papers washed with distilled water and dried by warm flowing air. The corrosion rates of the as coated specimens were estimated through the weight loss measurement. The original weight (WO) of the specimen was recorded and then immersed in the solution of 3.5% NaCl solution for 6 h. Finally, the corrosion products were removed by immersing the specimens for 1 min in the solution prepared by using 50 g chromium trioxide (CrO3), 2.5 g silver nitrate (AgNO3) and 5 g barium nitrate (Ba(NO3)2) for 250 ml distilled water. The final weight (wt) of the specimen was measured and the net weight loss was calculated using the following equation [Citation23]:(1)
(1) where W = weight loss in mg, A = surface area of the specimen in cm2, D = density of the Mg alloy substrate in g/cm3, T = corrosion time in h.
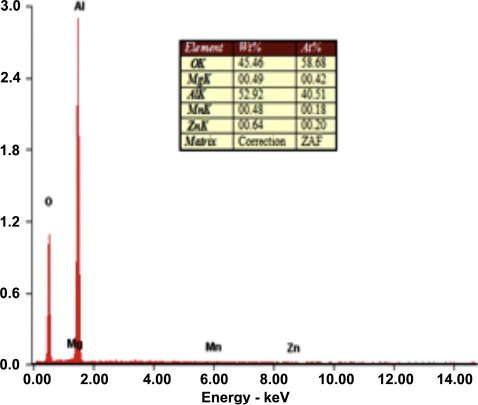
The Scanning Electron Microscope (Make: Jeol, Japan; Model: 6410-LV) was used to analyze the size and morphology of the parent materials. The powder is fused and then crushed, which gives its characteristic angular shape as shown in . SEM micrographs of the plasma-sprayed alumina coating are shown in a and b. A number of microcracks were observed on the surface of the coating. a and b shows the optical microstructure and SEM images of the alumina coating. From these micro-graphs, it can be seen that the coating microstructure consists of completely melted splat structures, unmelted particulate regions, pores between the splats and cracks within the splats. EDS analysis of the interface area () detected the presence of Al and O in the coating.
Fig. 4 Optical micrograph of the Al2O3 powder.
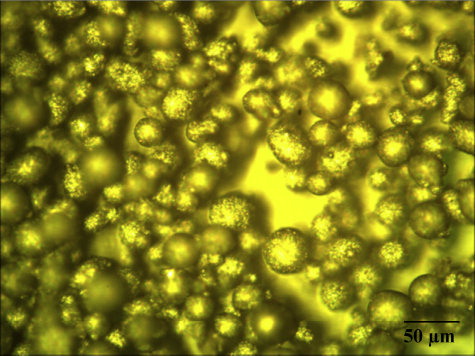
Fig. 5 SEM surface morphology of alumina coating.
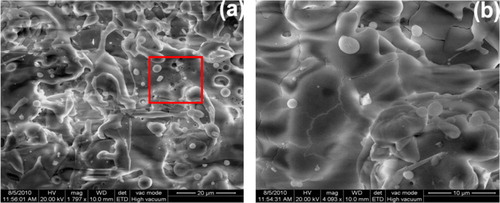
Fig. 6 Optical microstructure and SEM image of the coating.
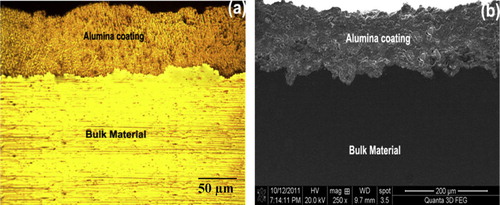
Fig. 7 EDAX analysis.
3 Predictive statistical model for corrosion rate
In this study, a response surface model-building technique was utilized to predict the corrosion rate in terms of the input power, the stand-off distance and the powder feed rate. Details of the model building technique are discussed below.
3.1 Response surface methodology (RSM)
RSM is an experimental strategy that explores the space of the process independent variables, and an empirical statistical modeling, to develop an appropriate relationship between the responses (output) and the process variables or factors (input). In the present investigation, to correlate the process parameters and the corrosion rates, an empirical relationship was developed to predict the responses based on experimentally measured values. The response is a function of power (P), stand-off distance (S), powder feed rate (F) and hence it can be expressed as(2)
(2)
The empirical relationship chosen includes the effects of the main and interaction effect of all factors. The construction of empirical relationship and the procedure to calculate the values of the regression coefficients can be referred elsewhere [Citation24]. In this work, the regression coefficients were calculated with the help of Design Expert V 8.1 statistical software. After determining the coefficients (at a 95% confidence level), the final empirical relationship was developed using these coefficients. The final empirical relationship to estimate the response is given below:(3)
(3)
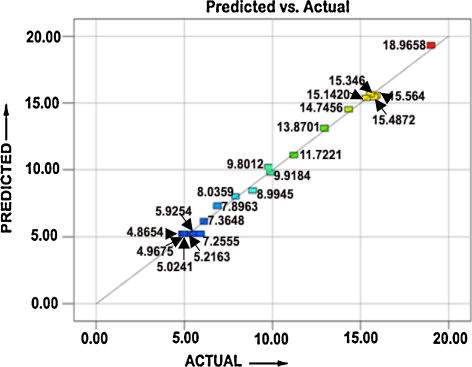
The analysis of variance (ANOVA) technique was used to find the significant main and interaction factors. The results of second order response surface model fitting in the form of analysis of variance (ANOVA) are given in . The determination coefficient (r2) indicated the goodness of fit for the model. The Model F-value of 249.23 implies the model is significant. There is only a 0.01% chance that a “Model F-value” this large could occur due to noise. Values of “Prob > F” <0.0500 indicate that model terms are significant. In this case P, S, F, PS, PF, SF, P2, S2 and F2 are significant model terms. Values greater than 0.1000 indicate the model terms are not significant. If there are many insignificant model terms (not counting those required to support hierarchy), model reduction may improve the model. The “Lack of Fit F-value” of 1.14 implies the Lack of Fit is not significant relative to the pure error. There is a 44.49% chance that a “Lack of Fit F-value” this large could occur due to noise. Non-significant lack of fit is good. The “Pred R-squared” of 0.9780 is in reasonable agreement with the “Adj R-squared” of 0.9915. “Adeq precision” measures the signal to noise ratio. P ratio greater than 4 is desirable. Our ratio of 46.90 indicates an adequate signal. The normal probability of the corrosion rate shown in reveals the residuals were falling on the straight line, which meant that the errors were distributed normally. All of these indicated an excellent suitability of the regression model. Each of the observed values compared with the experimental values shown in .
Table 5 ANOVA test results.
Fig. 8 Normal probability plot for the response.
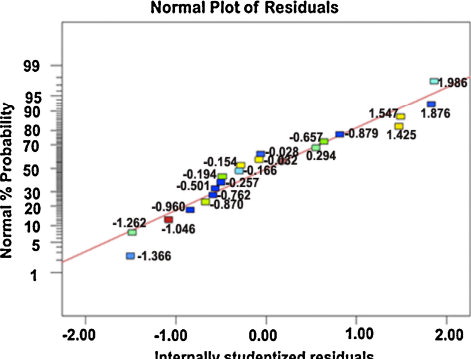
Fig. 9 Correlation plot for the response.
4 Results and discussion
The developed mathematical model can be used to predict the range of parameters used in the investigation by substituting their respective values in coded form. Based on these models, the main and interaction effects of process parameter on corrosion rate were computed and plotted in graphical form as shown in and .
Fig. 10 Effect of power and stand-off distance on corrosion rate.
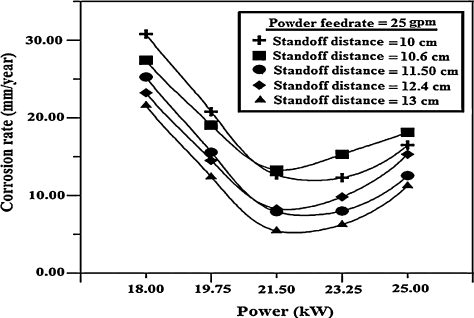
Fig. 11 Effect of powder feed rate and power on corrosion rate.
4.1 Effect of input power on corrosion rate
The effects of input power on response of the coatings are illustrated in and . The spraying power is an important parameter that affects the quality of the coating, since it can influence the temperature and velocity of the powder particles at the moment of impinging the substrate. More complete particle melting usually results in lower porosity content. It can be seen from a, lower power levels gave improper melting of the particles, which resulted in poor quality coatings. At the lowest spraying powers, the powder particles are poorly melted. When they impact on the substrate or the already formed coating, they are not able to spread out completely to form splats and therefore, could not conform to the surface [Citation25]. In such a case, the interlamellar pores and cracks will be formed due to the solidification of the splats. Moreover, when the spraying power is relatively low, numerous unmelted and partially melted particles are existed in the coating. The SEM micrograph of the corroded specimens a reveals the at lower power levels, the alumina coated specimen which suffered a severe chemical dissolution in exposed area, the alumina coating flaked-off in a few regions. The coating was found to have been damaged at localized regions (a). Thus, the magnesium substrate underneath the coating was exposed to the electrolyte. The flake off of larger coating areas in NaCl solutions was caused possibly by the formation of corrosion products [Citation26].
Fig. 12 Effect of APS process parameters on porosity level.
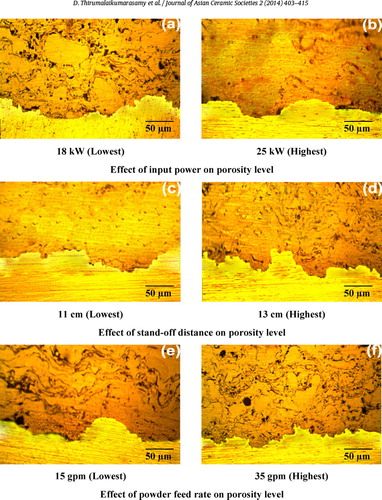
As the arc current increases, the total and the net available energies in the plasma increase. This condition leads to a better in-flight particle molten state and higher velocities. The deposition yield reaches a plateau for the highest current levels because of the increase in plasma jet temperature, which in turn increases both the particle melting ratio and the plasma jet viscosity for particles to flatten better. Porosity decreases under high power levels (b) because the particles are more likely to melt at high plasma energy levels, thereby enhancing flow and compaction of the coating during its build up. If the velocity of the particles is increased and/or the viscosity is decreased, then particle spreading tends to increase [Citation27]. The SEM micrograph (b) revealed that the coating surface did not undergo any discernible corrosion degradation. It is thus evident in this case that the alumina film at the interface was very stable and could resist the corrosion damage. When the power level was increased to 25, the alumina coated specimen exhibited a higher corrosion resistance and a more stable behavior than those in the lower power levels (a). It is clear from b, no obvious damage and coating degradation were observed on the surface of the material.
Fig. 13 Effect of APS process parameters on corrosion rate.
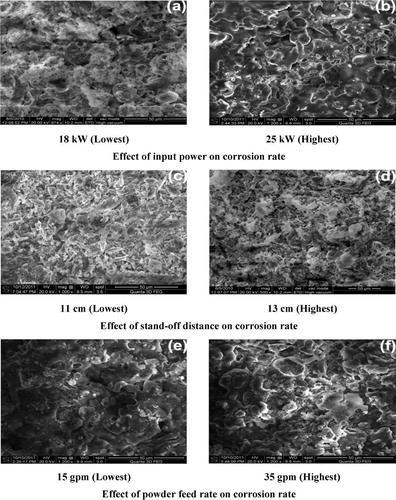
4.2 Effect of stand-off distance on corrosion rate
The influence of the stand-off distance on the corrosion rate of the coatings is displayed in and . In this case as the corrosion rate increases with the increase in the stand-off distance. The stand-off distance mainly controls the cohesion between splats because the temperature and velocity of particles in the plasma flame significantly change with stand-off distance. At short spraying distance, the droplets striking the substrate are semi or fully melted (c). With smaller stand-off distance, the splashing of material with possible fragmentation and quenching cracks may result. Therefore, better spreading and cohesion would be achieved with shorter spraying distances [Citation28]. As shown in the SEM micrograph of c, it is also observed that at lower stand-off distance, coating has no pronounced deterioration in this condition. At this stage, the corrosion deterioration of coated specimens was dictated by the degradation of coatings especially in inner regions of the coating. Therefore, due to the denser and more compact inner layer in the alumina coating was superior and the corrosion deterioration was slower in lower stand-off distance (c).
With longer stand-off distances, the enthalpy of the molten ceramic particles is largely lost, and the particles are decelerated in a relatively longer flight path because of the interaction with the surrounding air. As a result, the particles striking on the substrate will not be adequately flattened to overlap the layers, resulting in porosity as shown in d. At higher spray distance, the sprayed powder has more time to react with the air entrained in the flame, which would result in an increase in oxide content with spray distance. The coatings deposited at a spraying distance of 130 mm were found to contain fewer unmelted particles and lower porosity than the trends would have suggested porosity level in the coating increased with the increase in spray distance (d). It has been reported that the longer spray distance increases the dwell time in the plume and allows more thorough heating/melting of the particles and the enthalpy of the molten ceramic particles is largely lost, and also the particles begin to slow down in a relatively longer flight path because of the interaction with the surrounding air [Citation29].
At the stand-off distance not more than 100 mm, the coating was only deteriorated lightly on the edge of the samples. However, when the stand-off distance reaches 130 mm, chloride ions penetrate the coating and contact with the substrate, resulting in heavy corrosion reaction and a larger level of corrosion damage (d). Based on this investigation, it is concluded that the alumina coatings cannot provide a long term protection to the magnesium alloy substrate in higher stand-off distance.
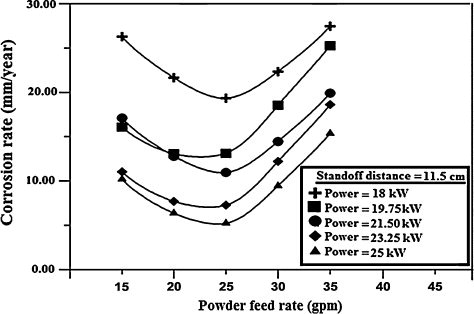
4.3 Effect of powder feed rate on corrosion rate
The effect of powder feed rate on the corrosion rate of the coatings is shown in and . Varying the powder feed rate affects the number of particles having to share the kinetic and thermal energies of the flame, which in turn affects the particle velocity and the temperature. When the powder feed rate is extremely low (e.g., 15 gpm), most of the particles are fully melted. In such a case, the coating with dense microstructure and low porosity will be fabricated (e). Too low a powder feed rate will result in vaporization, and over melting of the particles resulting in quench cracks [Citation30], splashing, and high porosity levels, whereas too high a feed rate will end up in poor melting of the powder particles resulting in a decrease of the splat flattening ratio and an increase in the porosity. With a further increase in powder feed rate, the heat content in the plasma gas becomes insufficient for the melting of the powder particles. As a result, the boundary of the unmelted particle, the micro-cracks and pores can be found. Thus, it is clear that these micro-cracks and pores may be created due to the residual stress arisen from the material mismatch of unmelted particles and the splats in a molten state. The poorly melted (unmelted and partially melted) particles will be remained in the coating, resulting in a less-dense coating with high porosity as can be seen in f. This result indicates that, when the powder feed rate is high, the particles which obtain low thermal energy and kinetic energy cannot be fully melted.
The SEM micrograph of the coating exposure is shown in e, where no obvious indication of blistering of the coating can be observed. However, the coating seems to be locally attacked in some areas inside the coating (e). The SEM micrograph of alumina coating after 6 h of exposure showed that unlike the APS coating, localized attack can be detected (f) through the coating surface. In the case of APS coating, micro cracks and intersplat oxides are responsible for the electrolyte penetration into the coating. A localized corrosion can also take place at these defects which attacks the coating body.
5 Corrosion products characteristics
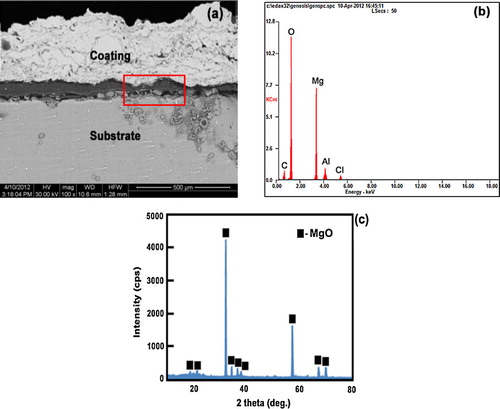
a and b displays the cross section and EDS analysis of as-sprayed alumina coating on AZ31B magnesium alloy after 6 h of immersion in NaCl solution. The cross section images of as-sprayed coatings revealed significant signs of degradation in the coating/substrate interface a evidences the extent of the corrosion process that occurs in the chloride medium, since the as-sprayed alumina coating was detached from the AZ31B substrate after 6 h of immersion. Examination of the coating/substrate interface showed the presence of corrosion products in this area, although only a part of them remained over the substrate or in the coating after the immersion tests [Citation31,Citation32]. This behavior is produced because the as-sprayed coating is highly porous, so that, there are a high number of pathways through this coating and the electrolyte rapidly reaches the magnesium alloy surface, giving rise to the substrate corrosion. Afterwards, the corrosion process progresses along the interface area, giving rise to the formation of corrosion products on the metal surface, which will finally cause the detachment of the coating. The growth of corrosion products would separate the coating from the substrate and their low mechanical properties would allow its detachment. According to EDX analysis (b), corrosion products rich in Mg and O were mainly detected in the interface area, along with a small amount of Al and of Cl. The main corrosion products responsible for the detachment of the coatings in immersion environment were identified as MgO (c).
Fig. 14 (a) Cross section of as-sprayed alumina coating on AZ31B magnesium alloy after immersion in NaCl solution for 6 h (b and c) EDX and XRD pattern analysis.
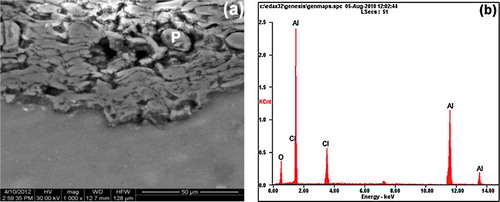
The corroded surfaces of the coated samples were examined using SEM and X-ray diffraction techniques immediately after the immersion test. The occurrence of uniform corrosion (a) can be observed. However, in the as-coated sample, an additional thicker top layer at discrete locations can be noted (a) indicative of higher corrosion rate. X-ray diffraction results obtained from the corroded surfaces of the samples are presented in b. The main corrosion products formed are bayerite (Al(OH)3) (JCPDS 33-0018) and aluminum oxide (AlO) (JCPDS 75-0278) as confirmed by EDX. Subsequent to the surface analysis, the coatings were cut in transverse direction and the cross section was immediately polished and observed under SEM. In the case of as-coated sample (a), presence of corrosion product can be observed as patches at discrete locations and an EDS analysis carried out on the patch (labeled P) indicates the presence of Cl and O besides Al as major constituents (b) as expected. The presence of corrosion product as discrete patches on the corroded sample cross section can be understood by noting that the intersplat cracks, through which electrolyte can penetrate the coating, follow a very tortuous path. Thus, the corrosion patch represents a situation where in the cut plane intersects with the tortuous crack path of intersplat cracks filled with electrolyte [Citation33,Citation34]. If the coating is nobler than the substrate, then pores/cracks only provide the path for electrolyte penetration into the pore since pore walls do not corrode being nobler than the substrate. In such cases, the secondary corrosion process can only be the corrosion at the coating–substrate interface. In contrast, in the present case, wherein the Al2O3 coating is less noble than the magnesium substrate, pore walls also undergo corrosion and the resulting corrosion product in the pores can impede further corrosion [Citation35Citation[36]–Citation37]. To validate the proposal that the corrosion occurs only at the coating surface and on the intersplat pore/crack walls and not at the magnesium substrate–coating interface.
Fig. 15 SEM micrographs (a) and X-ray diffraction analysis (b) of the corroded surface after 6 h exposure of coatings.
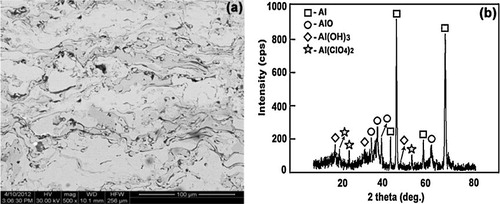
Fig. 16 (a) SEM micrograph showing corrosion product in the cross section of as-coated coating exposed for 6 h and (b) EDS analysis.
6 Relationship between porosity and corrosion rate of alumina coatings
The coating porosity and the corrosion rate obtained from the experimental results are related as shown in . The experimental data points are fitted by a straight line. The straight line is governed by the following regression equation:(4)
(4)
Fig. 17 Relationship graph for porosity and corrosion rate.
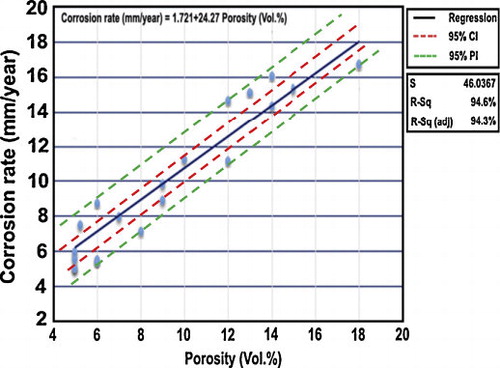
The slope of the estimated regression equation (+24.27) is positive, implying that as porosity decreases, corrosion rate increases. The coefficient of determination is R2 = 94.6%. It can be interpreted as the percentage of the total sum of squares that can be explained by using the estimated regression equation. The coefficient of determination R2 is a measure of the goodness of fit of the estimated regression equation [Citation38].
The fitted regression line (Eq. Equation(4)(4)
(4) ) may be used for two purposes:
| (a) | To estimate the mean value of corrosion rate for the given value of coating porosity. | ||||
| (b) | Predicting an individual value of corrosion rate for a given value of coating porosity level. | ||||
The confidence interval and prediction interval show the precision of the regression results. Narrower intervals provide a higher degree of precision (). Confidence interval (CI) is an interval estimate of the mean value of y for a given value of x. Prediction interval (PI) is an interval estimate of an individual value of y for a given value of x. The estimated regression equation provides a point estimate of the mean value of corrosion rate for a given value of porosity. The difference between CI and PI reflects the fact that it is possible to estimate the mean value of corrosion rate more precisely than an individual value of corrosion rate. The greater width of the PI is reflecting the added variability introduced by predicting a value of the random variable as opposed to estimating a mean value. From , it is also inferred that the closer the value to ‘x’ (15.21 vol%) the narrower will be the interval.
7 Conclusions
The following important conclusions are obtained from this investigation:
| • | Empirical relationship was established using RSM to predict the corrosion rate of plasma sprayed alumina coatings, incorporating few important spray parameters. The developed relationship can be effectively used to predict the corrosion rate of alumina coatings on AZ31B magnesium alloy at 95% confidence level. | ||||
| • | The corrosion behavior of the coating was strongly affected by the power of the plasma. High power level of 25 kW improved the corrosion resistance of the coatings. Higher power also led to higher fractions of melted particles which consequently produce a higher probability of successful deposition. | ||||
| • | In higher stand-off distance, the alumina coatings were found to be highly susceptible to localized damage, and could not provide an effective corrosion protection to Mg alloy substrate. The level of the corrosion attack of alumina coated AZ31 alloy is much higher when stand-off distance is greater than 130 mm, which was validated by the surface micrographs. | ||||
| • | The coating fabricated at the long powder feed rate contained a considerable amount of pores and partially melted regions, thereby resulting in deterioration of the corrosion resistance. When the powder feed rate decreased, dense coatings containing reduced pores and partially melted regions could be fabricated. In these coatings, cracks or spalled-outs of oxides were hardly found on the smoothly worn surface. | ||||
| • | The input power was found to have greater influence on the corrosion rate of plasma sprayed alumina coatings followed by process parameters such as stand-off distance and powder feed rate. | ||||
Notes
Peer review under responsibility of The Ceramic Society of Japan and the Korean Ceramic Society.
Related Research Data
References
- G.L.SongJ. Adv. Eng. Mater.72005563586
- D.ThirumalaikumarasamyK.ShanmugamV.BalasubramanianTrans. Indian Inst. Met.6720141932
- K.A.KhorY.W.GuThin Solid Films3722000104113
- R.McPhersonSurf. Coat. Technol.17319893940
- T.LampkeD.MeyerG.AlischB.WielageH.PokhmurskaM.KlapkivM.StudentJ. Mater. Sci. (Ukrainian Original)462011591598
- E.CelikI.OzdemirE.AvciY.TsunekawaSurf. Coat. Technol.1932005297302
- T.LampkeD.MeyerG.AlischD.NickelI.ScharfL.WagnerU.RaabSurf. Coat. Technol.206201120122016
- Z.YinS.TaoX.ZhouMater. Charact.6220119093
- S.CostilC.VerdyR.BolotC.CoddetJ. Therm. Spray. Technol.162007839843
- D.ThirumalaikumarasamyK.ShanmugamV.BalasubramanianProg. Nat. Sci. Mater. Int.222012468479
- E.CelikA.S.DemirkiranE.AvciSurf. Coat. Technol.116199910611064
- S.T.ArunaN.BalajiJ.ShedthiV.K.William GripsSurf. Coat. Technol.208201292100
- W.ZhongshanL.LiufaD.WenjiangJ. Mater. Sci. Forum4882005685688
- L.ChiuH.LinC.ChenC.YangC.ChangJ.WuJ. Mater. Sci. Forum4192003909914
- R.ArrabalA.PardoM.C.MerinoM.MohedanoP.CasajusS.MerinoSurf. Coat. Technol.204201027672774
- M.CarbonerasM.D.LopezP.RodrigoM.CampoB.TorresE.OteroJ.RamsCorros. Sci.522010761768
- C.S.RamachandranV.BalasubramanianP.V.AnanthapadmanabhanSurf. Eng.272011217229
- ASTM B276-05Standard Test Method for Apparent Porosity in Cemented Carbides2010
- B.RogeA.FahrJ.S.R.GiguereK.I.McRaeJ. Therm. Spray. Technol.122003530535
- J.ZhangV.DesaiSurf. Coat. Technol.190200598109
- G.AntouG.MontavonF.HlawkaA.CornetC.CoddetMater. Charact.532004361372
- N.AhmedM.S.BakareD.G.McCartneyK.T.VoiseySurf. Coat. Technol.204201022942301
- ASTM G31-72Standard Practice for Laboratory Immersion Corrosion Testing of Metals2002
- S.KumarP.KumarH.S.ShanJ. Mater. Process. Technol.1822007615623
- H.WuH.-j.LiQ.LeiQ.-g.FuC.MaD.-j.YaoY.-j.WangC.SunJ.-f.WeiZ.-h.HanAppl. Surf. Sci.257201155665570
- Y.WangW.TianT.ZhangY.YangCorros. Sci.51200929242931
- R.VenkataramanG.DasaS.R.SinghL.C.PathakR.N.GhoshaB.VenkataramanR.KrishnamurthyJ. Mater. Sci. Eng.4452007269274
- A.PortinhaV.TeixeiraJ.CarneiroJ.MartinsM.F.CostaR.VassenD.StoeverSurf. Coat. Technol.1952005245251
- A.KucukC.C.BerndtU.SenturkR.S.LimaC.R.C.LimaJ. Mater. Sci. Eng. A28420002940
- S.KurodaT.FukushimaS.KitaharaJ. Therm. Spray. Technol.11992325332
- W.-m.ZhaoC.LiuL.-x.DongY.WangJ. Therm. Spray. Technol.5182009702707
- C.BlawertT.V.HeitmannW.DietzelH.M.NykyforchynM.D.KlapkivSurf. Coat. Technol.20020056872
- L.GilM.H.StaiaThin Solid Films4202002446454
- K.SpencerD.M.FabijanicM.X.ZhangJ. Therm. Spray. Technol.2042009336344
- D.DzhurinskiyE.MaevaE.V.LeshchinskyR.Gr.MaevJ. Therm. Spray Technol.212012304313
- F.L.TomaC.C.StahrL.M.BergerS.SaaroM.HerrmannD.DeskaG.MichaelJ. Therm. Spray. Technol.192009137147
- J.ZhangW.ZhangC.YanK.DuF.WangElectrochim. Acta552009560571
- S.KarthikeyanV.BalasubramanianR.RajendranJ. Ceram. Int.40201431713183