
Abstract
The (100 − x)Na3BO3·xNa2SO4 (0 ≤ x (mol%) ≤ 50) glasses were prepared by mechanical milling. Halo patterns were observed in the compositions 0 ≤ x ≤ 50 by XRD measurements. The Raman spectra indicated that all the glasses were composed of BO33− anions, SO42− anions and Na+ cations. The (100 − x)Na3BO3·xNa2SO4 glasses showed good deformation properties and a dense pellet was prepared by cold-press. The conductivities of the glasses increased with increasing Na2SO4 content, and the 50Na3BO3·50Na2SO4 glass showed the highest conductivity of 5.9 × 10⁻⁸ S cm−1 at 25 °C.
1 Introduction
Recently, the diversification of portable electronics requires rechargeable energy sources that are safe, economical and environmental friendly. Lithium-ion batteries are known as one of the types of rechargeable batteries with the highest energy density [Citation1] for portable electronic device applications. However, a growing number of fire accidents involving cell phones and electric vehicles are raising questions regarding the safety of lithium-ion batteries using flammable organic liquid electrolytes. Furthermore, the cost of lithium-based batteries is high because lithium is a rare material. All-solid-state sodium secondary batteries are one of the solutions to these issues. The batteries are expected to remove safety hazards because of nonflammable inorganic solid electrolytes [Citation1–Citation3]. Sodium secondary batteries can be low-cost since the sodium element is abundant and ubiquitous [Citation4]. As one example of sodium batteries, sodium-sulfur batteries, which employ β-alumina as the solid electrolyte, have been used for large-scale energy storage because of their high theoretical specific energy densities of over 760 Wh kg−1 [Citation5]. Oxide-based solid electrolytes represented by the β-alumina and NASICON show high conductivities of over 10−3 S cm−1 at room temperature [Citation6]. The preparation process of these electrolytes includes high-temperature sintering to reduce the resistance of grain boundaries. However, this process sometimes causes chemical reactions between electrolytes and electrodes, which generate large interfacial resistance [Citation7]. In order to solve this issue, the preparation process for electrode-electrolyte interfaces without high-temperature sintering is desirable. Materials with low-melting temperatures, possessing a small cohesive energy, have excellent formability achieving good solid–solid contacts by pressing at room temperature. Good formability is important to make appropriate conduction paths of carriers between electrodes and electrolytes as well as to reduce the resistance of grain boundaries [Citation8]. It is considered that the conductivity of glassy materials is usually higher than that of corresponding crystalline ones [Citation9,Citation10]. Therefore, glassy materials with low-melting temperatures are very attractive. Moreover, the conductivity of Li+ ion conducting glasses is known to increase with increasing Li+ ion content [Citation11,Citation12]. The glasses are thus required to contain a large amount of Li+ ions [Citation13] and thus ortho-oxosalt compositions are expected to show high conductivities. It is difficult to fabricate ortho-oxosalt compositions by melt quenching. In the systems Li2O–MxOy (M = B, Si, P, Ge or Al), the glass forming region by mechanical milling is wider than that by rapid quenching [Citation14]. Glasses at ortho-oxosalt compositions such as Li3BO3 and Li4SiO4 can be prepared by mechanical milling. In addition, pseudobinary systems show “mixed-anion effect” by which the conductivity shows the highest value at a certain composition [Citation15]. We discovered a series of Li+ ion conducting glasses in lithium ortho-oxosalt pseudobinary systems with high Li+ ion concentration and “mixed-anion effect” such as Li4SiO4–Li3BO3 and Li3BO3–Li2SO4 glasses [Citation7,Citation16]. The conductivity of the Li3BO3–Li2SO4 glasses is nearly 10−6 S cm−1 at room temperature, which is relatively high among lithium oxide glasses. Moreover, the glasses show good formability only by cold-press. However, sodium ortho-oxosalt pseudobinary glasses have not been studied.
In this study, glasses in the system Na3BO3–Na2SO4 were prepared by mechanical milling. The effects of the addition of Na2SO4 to Na3BO3 on conductivity and structure of the glasses were examined.
2 Experimental
Starting materials were NaOH (99.99%; Aldrich Chem.), H3BO3 (99.5%; Wako Chem.), and Na2SO4 (99.9%; Wako Chem.). A mixture of NaOH and H3BO3 was heated in an Al2O3 crucible at 400 °C for 4 h and at 450 °C for 2 h. After each heat treatment, the sintered samples were ground and Na3BO3 crystal powders were prepared. The Na3BO3–Na2SO4 glasses were prepared by mechanical milling (MM) using a planetary ball mill apparatus (Fritsch Pulverisette 7). A mixture of the crystals of Na3BO3 and Na2SO4 was put into a 45 ml ZrO2 pot with 160 ZrO2 balls (5 mm in diameter) and milled at the rotating speed of 370 rpm with the milling period of 15–125 h. All processes were conducted in a dry Ar atmosphere.
X-ray diffraction (XRD) measurements (Cu Kα) were conducted using a diffractometer (Ultima IV; Rigaku) to identify crystal phases of the milled samples. Raman spectra of the samples were measured using a Raman spectrometer (LabRAM HR-800; Horiba) with 325 nm He–Cd laser. Differential thermal analyses (DTA) were performed using a thermal analyzer (Thermo-plus 8120; Rigaku) to determine their glass transition and crystallization temperatures. The milled samples were sealed in Al pans in an Ar-filled glove box and heated at 10 °C min−1 under N2 gas flow up to 550 °C. Ionic conductivities were measured for the pelletized samples pressed under 720 MPa at room temperature. The diameter and thickness of the pellets were 10 mm and about 0.8 mm, respectively. Gold electrodes were formed by sputtering with a quick coater (SC-701; Sanyu Electron) on both surfaces of the pellets. Then stainless steel disks were attached to the pellets as current collectors. The prepared cells were sealed in a silica glass tube in an Ar-filled globe box. Then AC impedance measurements were conducted under dry Ar gas flow using an impedance analyzer (SI-1260; Solartron). The frequency range and applied voltage were respectively 0.1 Hz to 8 MHz and 100 mV. The density of the powder-compressed pellets (d1) was calculated from the weight and volume of the pellets and the density of the powders (d2) was measured using a gas pycnometer (AccuPyc II 1340; Shimadzu). The relative density was defined as d1/d2. The micro-structure of a cross-section of the pellets was observed by scanning electron microscope (SEM) (JSM-6610A; JEOL).
3 Results and discussion
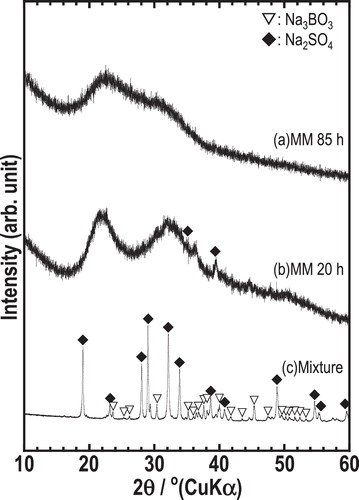
The XRD patterns of the mixture of starting materials and milled samples at the composition 50Na3BO3·50Na2SO4 (mol%) are shown in . The pattern of the mixture showed the peaks attributed to Na3BO3 and Na2SO4 crystals. After the sample was milled for 20 h, a halo pattern was mainly observed and weak peaks attributable to Na2SO4 crystal remained. The pattern of the sample milled for 85 h showed halo pattern, indicating that amorphous sample was prepared.
Fig. 1 XRD patterns of 50Na3BO3·50Na2SO4 samples milled for 0, 20 and 85 h.
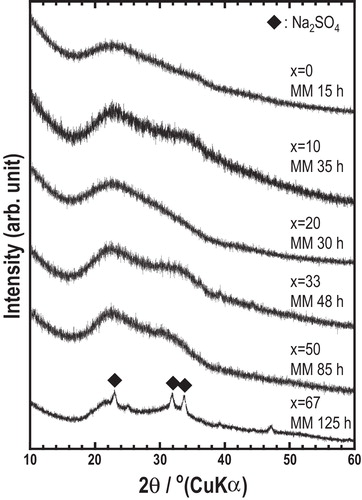
The XRD patterns of the (100 − x)Na3BO3·xNa2SO4 samples after mechanical milling are shown in . Halo patterns were observed in the range from x = 0 to 50. Small peaks attributed to Na2SO4 crystal remained in the pattern of the sample of x = 67. Amorphous samples were prepared at the compositions 0 ≤ x ≤ 50.
Fig. 2 XRD patterns of the (100 − x)Na3BO3·xNa2SO4 samples prepared by mechanical milling.
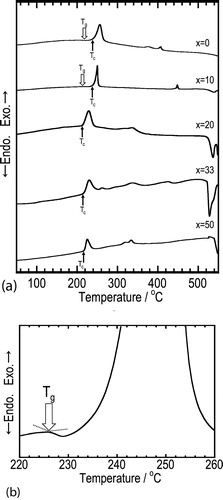
DTA curves of the amorphous samples are shown in (a). An enlarged DTA curve for the x = 10 sample is also shown in (b). An endothermic behavior attributable to glass transition was observed at 200–240 °C for the samples of x = 0 and x = 10, suggesting that the obtained amorphous samples are glasses. For the samples of x = 20, 33, and 50, glass transition behaviors were not clearly observed although all the samples showed exothermic peaks attributable to crystallization. The crystallization temperatures (Tc) shifted to the lower temperature side with increasing Na2SO4 content. Glass transition temperatures (Tg) probably shifted to the lower temperature side along with the shift of Tc, suggesting that Na2SO4 crystal was incorporated into the glass matrix. Endothermic peaks were observed at 520–550 °C for the glasses of x = 20, 33 and 50. All these samples were found to melt after the DTA measurement, indicating that these peaks are attributed to the temperatures at which melting began. It is noted that the initial melting temperatures decreased by the addition of Na2SO4.
Fig. 3 (a) DTA curves of the (100 − x)Na3BO3·xNa2SO4 samples prepared by mechanical milling and (b) an enlarged DTA curve of the 90Na3BO3·10Na2SO4 sample.
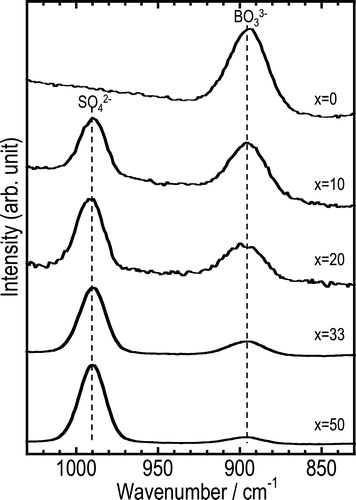
The Raman spectra of the (100 − x)Na3BO3·xNa2SO4 glasses are shown in . The bands at about 890 cm−1 and 990 cm−1 are attributable to BO33− and SO42− units, respectively [Citation17,Citation18]. No other peaks were observed except for those of the BO33− and SO42− units. Therefore, ionic glasses, which are composed of isolated BO33− and SO42− anions and Na+ cation, were prepared by mechanical milling.
Fig. 4 Raman spectra of the (100 − x)Na3BO3·xNa2SO4 glasses.
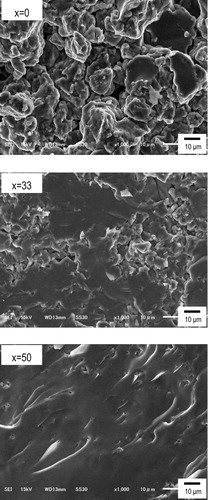
Cross-sectional SEM images of powder-compressed pellets are shown in . Densities of powder-compressed pellets (d1), powders (d2), and relative density (d1/d2) of the (100 − x)Na3BO3·xNa2SO4 glasses are listed in . Grain boundaries were clearly observed in the SEM image of the glass of x = 0. On the other hand, the SEM image of the glass of x = 50 showed less grain boundaries, suggesting that formability of the pellets improved with increasing Na2SO4 content. As shown in (a), melting temperatures decreased with an addition of Na2SO4. A material with lower melting temperature tends to have less cohesive energy [Citation7], and thus the glasses showed better formability with the Na2SO4 content.
Table 1 Densities of pellets (d1), powders (d2) and relative density (d1/d2) of (100 − x)Na3BO3·xNa2SO4 glasses.
Fig. 5 Cross-sectional SEM images of the (100 − x)Na3BO3·xNa2SO4 glasses.
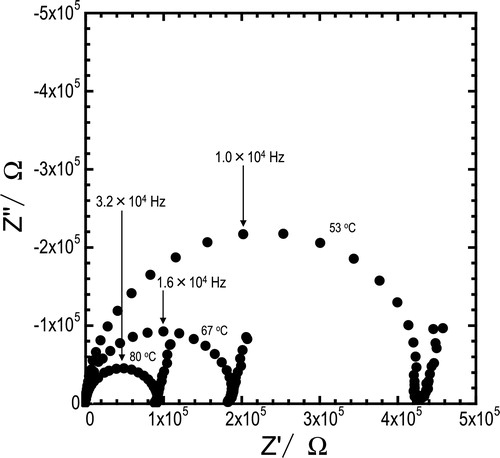
Nyquist plots for the pelletized glass of x = 50 at temperatures of 53, 67, and 80 °C are shown in . Semicircles and spikes were observed in Nyquist plots, and similar plots were obtained for all the compositions and temperatures. With an increase in the measuring temperature, the arcs diminished. The conductivities were calculated from the resistance of semicircle including bulk and grain boundary components.
Fig. 6 Nyquist plots of the 50Na3BO3·50Na2SO4 glass at 53, 67 and 80 °C.
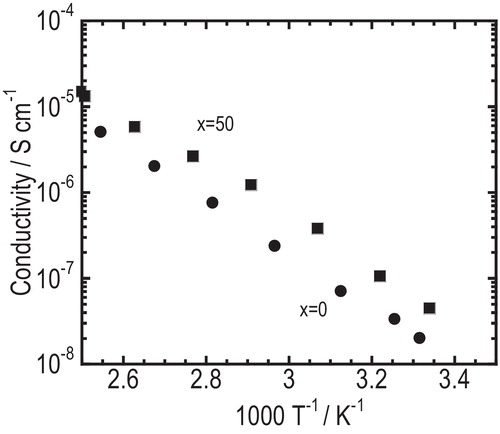
Temperature dependence of conductivity for the pelletized glasses of x = 0 and x = 50 is shown in . The conductivity for the glasses increased with increasing temperature and its temperature dependence obeyed the Arrhenius relation, σ = σ0 exp(−Ea/kT), where σ0 and Ea are respectively pre-exponential factor and activation energy for conduction. The conductivity at room temperature and the activation energy for all the glasses are summarized in . The glass of x = 50 showed the highest conductivity of 5.9 × 10⁻⁸ S cm−1 at room temperature and the lowest activation energy of 47 kJ mol−1. As shown in , the conductivity (σ25) increased and the activation energy decreased monotonously with increasing Na2SO4 content. There are two reasons why the conductivity of the glasses increased and activation energy decreased with increasing Na2SO4 content. First, the resistance of grain boundary decreased because of better formability of the glasses with increasing Na2SO4 content. Second, the bulk resistance decreased by so-called “mixed-anion effect.” Glasses in the Na3BO3–Na2SO4, pseudobinary system showed good formability with the conductivity of over 10−8 S cm−1.
Table 2 Conductivity and activation energy of (100 − x)Na3BO3·xNa2SO4 (mol%) glasses.
Fig. 7 Temperature dependence of conductivities for the glasses of Na3BO3 and 50Na3BO3·50Na2SO4.
4 Conclusions
The (100 − x)Na3BO3·xNa2SO4 glasses were prepared by mechanical milling. In the XRD patterns, halo patterns were observed in the range of 0 ≤ x ≤ 50. The glasses added with Na2SO4 exhibited higher conductivities than the mother Na3BO3 glass and the conductivities of the glasses increased with increasing Na2SO4 content. The glass at the composition of x = 50 showed the highest conductivity of 5.9 × 10⁻⁸ S cm−1 at room temperature. Good deformation character was also achieved in the glass electrolyte.
Notes
Peer review under responsibility of The Ceramic Society of Japan and the Korean Ceramic Society.
References
- J.-M.TarasconM.ArmandNature4142001359367
- M.ArmandJ.-M.TarasconNature4512008652657
- N.KamayaK.HommaY.YamakawaM.HirayamaR.KannoM.YoneuraT.KamiyamaY.KatoS.HamaK.KawamotoA.MitsuiNat. Mater.102011682686
- K.B.HuesoM.ArmandT.RojoEnergy Environ. Sci.62013734749
- X.LuG.XiaJ.P.LemmonZ.YangJ. Power Sources195201024312442
- M.TatsumisagoA.HayashiInt. J. Appl. Glass Sci.52014226235
- M.TatsumisagoR.TakanoK.TadanagaA.HayashiJ. Power Sources2702014603607
- A.SakudaA.HayashiM.TatsumisagoSci. Rep.320132261
- H.L.TullerD.P.ButtonD.R.UhlmannJ. Non-Cryst. Solids40198093118
- T.MinamiJ. Non-Cryst. Solids731985273284
- K.NassauM.GrassoA.M.GlassJ. Non-Cryst. Solids341979425436
- M.TatsumisagoA.HondaT.MinamiM.TanakaJ. Non-Cryst. Solids561983423428
- M.TatsumisagoK.YonedaN.MachidaM.MinamiJ. Non-Cryst. Solids95–961987857864
- A.HayashiD.FurusawaY.TakahashiK.MinamiM.TatsumisagoPhys. Chem. Glasses542013109114
- M.TatsumisagoN.MachidaT.MinamiJ. Ceram. Soc. Jpn.951987197201
- M.TatsumisagoN.MachidaT.MinamiJ. Ceram. Soc. Jpn.9519875963
- E.CazzanelliR.FrechJ. Chem. Phys.81198447294736
- Y.KowadaM.TatsumisagoT.MinamiJ. Phys. Chem.93198921472151